

Identification of a novel five ferroptosis-related gene signature as a promising prognostic model for breast cancer
- PMID: 37728703
- PMCID: PMC10645672
- DOI: 10.1007/s00432-023-05423-5
Identification of a novel five ferroptosis-related gene signature as a promising prognostic model for breast cancer
Abstract
Background: Breast cancer (BCa) is a major challenge for women's health worldwide. Ferroptosis is closely related to tumorigenesis and cancer progression. However, the prognostic value of ferroptosis-related genes in BCa remains unclear, and more accurate prognostic models are urgently needed.
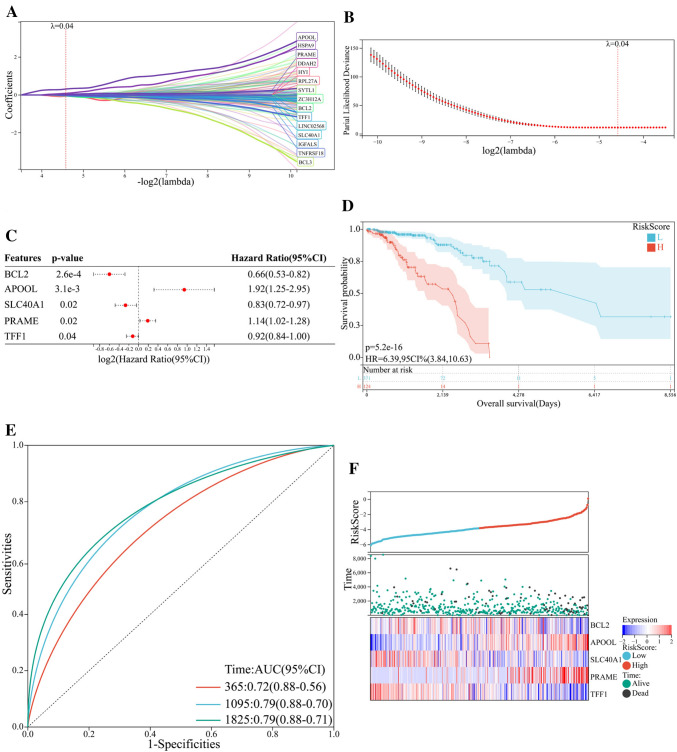
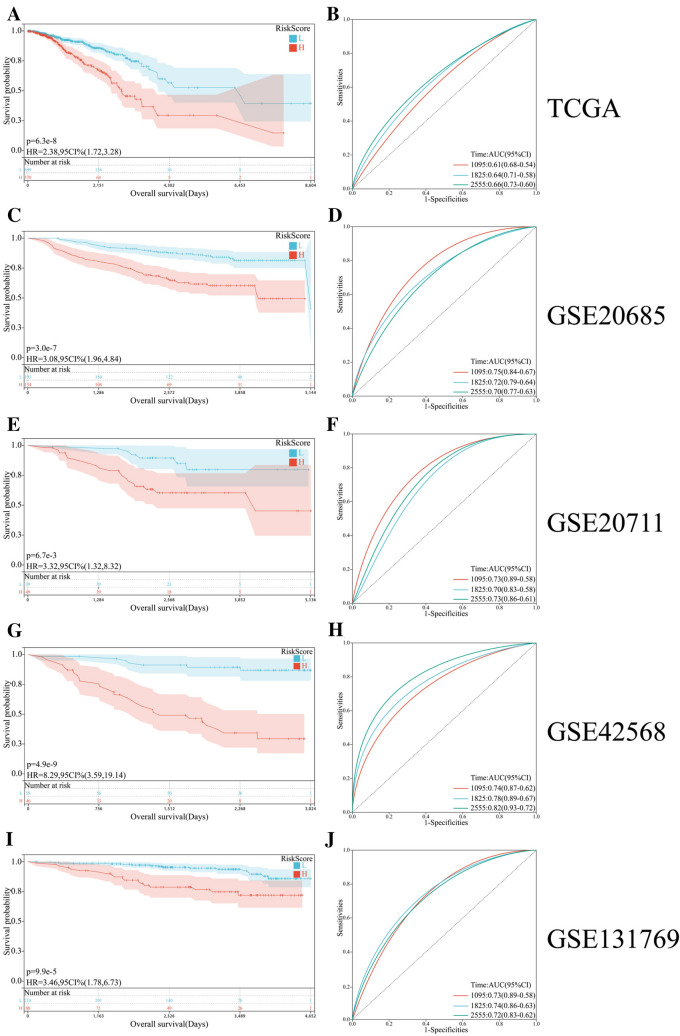
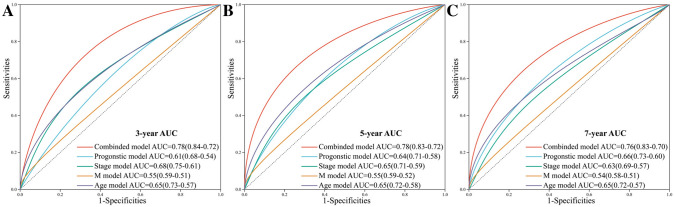
Methods: Gene expression profiles and clinical information of BCa patients were collected from public databases. LASSO and multivariate Cox regression analysis were utilized to construct the prognostic gene signature. Kaplan-Meier plotter, receiver operating characteristic (ROC) curves, and nomogram were used to validate the prognostic value of the gene signature. Gene set enrichment analysis was performed to explore the molecular functions and signaling pathways.
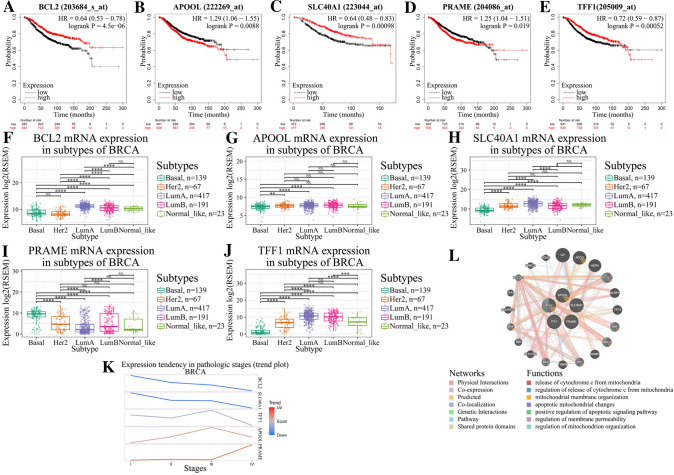
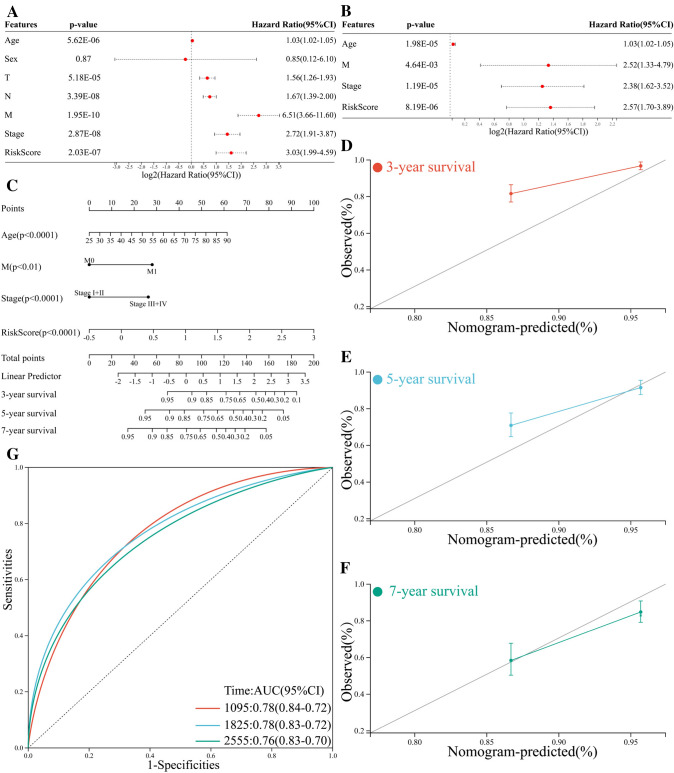
Results: Differentially expressed ferroptosis-related genes between BCa samples and normal tissues were obtained. A novel five-gene signature including BCL2, SLC40A1, TFF1, APOOL, and PRAME was established for prognosis prediction. Patients stratified into high-risk or low-risk group displayed significantly different survival. Kaplan-Meier and ROC curves showed a good performance for survival prediction in different cohorts. Biological function analysis revealed that the five-gene signature was associated with cancer progression, immune infiltration, immune response, and drug resistance. Nomogram including the five-gene signature was established.
Conclusion: A novel five ferroptosis-related gene signature and nomogram could be used for prognostic prediction in BCa.
Keywords: Breast cancer; Ferroptosis; Gene signature; Overall survival; Prognosis.
© 2023. The Author(s).
Conflict of interest statement
The authors declare no potential conflicts of interest.
Figures


Similar articles
-
Construction of a novel five programmed cell death-related gene signature as a promising prognostic model for triple negative breast cancer.PeerJ. 2025 Apr 28;13:e19359. doi: 10.7717/peerj.19359. eCollection 2025. PeerJ. 2025. PMID: 40313394 Free PMC article.
-
Identification of the prognostic value of ferroptosis-related gene signature in breast cancer patients.BMC Cancer. 2021 May 31;21(1):645. doi: 10.1186/s12885-021-08341-2. BMC Cancer. 2021. PMID: 34059009 Free PMC article.
-
Construction and analysis of a novel ferroptosis-related gene signature predicting prognosis in lung adenocarcinoma.FEBS Open Bio. 2021 Nov;11(11):3005-3018. doi: 10.1002/2211-5463.13288. Epub 2021 Oct 16. FEBS Open Bio. 2021. PMID: 34499810 Free PMC article.
-
A novel ferroptosis-related 12-gene signature predicts clinical prognosis and reveals immune relevancy in clear cell renal cell carcinoma.BMC Cancer. 2021 Jul 19;21(1):831. doi: 10.1186/s12885-021-08559-0. BMC Cancer. 2021. PMID: 34281531 Free PMC article.
-
Development and validation of a novel ferroptosis-related gene signature for predicting prognosis and immune microenvironment in head and neck squamous cell carcinoma.Int Immunopharmacol. 2021 Sep;98:107789. doi: 10.1016/j.intimp.2021.107789. Epub 2021 Jun 12. Int Immunopharmacol. 2021. PMID: 34130150
Cited by
-
Transcription factor TFAP2A drives the growth and metastasis and blocks ferroptosis of triple-negative breast cancer by activating PRAME transcription.Naunyn Schmiedebergs Arch Pharmacol. 2025 Aug 23. doi: 10.1007/s00210-025-04359-6. Online ahead of print. Naunyn Schmiedebergs Arch Pharmacol. 2025. PMID: 40848133
-
PRAME Updated: Diagnostic, Prognostic, and Therapeutic Role in Skin Cancer.Int J Mol Sci. 2024 Jan 27;25(3):1582. doi: 10.3390/ijms25031582. Int J Mol Sci. 2024. PMID: 38338862 Free PMC article. Review.
-
Construction of a novel five programmed cell death-related gene signature as a promising prognostic model for triple negative breast cancer.PeerJ. 2025 Apr 28;13:e19359. doi: 10.7717/peerj.19359. eCollection 2025. PeerJ. 2025. PMID: 40313394 Free PMC article.
-
m5C related-regulator-mediated methylation modification patterns and prognostic significance in breast cancer.Sci Rep. 2024 Nov 11;14(1):27477. doi: 10.1038/s41598-024-77389-4. Sci Rep. 2024. PMID: 39523404 Free PMC article.
-
Construction of a prognostic model based on ferroptosis- and mitochondrial metabolism-related genes for patients with breast cancer.Medicine (Baltimore). 2025 Jul 18;104(29):e43307. doi: 10.1097/MD.0000000000043307. Medicine (Baltimore). 2025. PMID: 40696656 Free PMC article.
References
-
- Corte MD, Tamargo F, Alvarez A, Rodríguez JC, Vázquez J, Sánchez R et al (2006) Cytosolic levels of TFF1/pS2 in breast cancer: their relationship with clinical-pathological parameters and their prognostic significance. Breast Cancer Res Treat 96(1):63–72. 10.1007/s10549-005-9041-7 - PubMed
MeSH terms
Substances
Grants and funding
- ZD202225/the Changzhou Science and Technology Program
- 2022ZB820/the Excellent Post-doctoral Program of Jiangsu Province
- 2022CZBJ065/the Top Talent of Changzhou "The 14th Five-Year Plan" High-Level Health Talents Training Project
- 2022M720543 and 2019M661677/the Post-doctoral Foundation of China
- 2019K161/the Post-doctoral Foundation of Jiangsu Province
LinkOut - more resources
Full Text Sources
Medical
