. 2023 Dec 1;29(23):4808-4821.
doi: 10.1158/1078-0432.CCR-23-1554.

Tumor-Infiltrating Normal B Cells Revealed by Immunoglobulin Repertoire Clonotype Analysis Are Highly Prognostic and Crucial for Antitumor Immune Responses in DLBCL

Affiliations

Tumor-Infiltrating Normal B Cells Revealed by Immunoglobulin Repertoire Clonotype Analysis Are Highly Prognostic and Crucial for Antitumor Immune Responses in DLBCL

Zijun Y Xu-Monette et al. Clin Cancer Res. .

Abstract

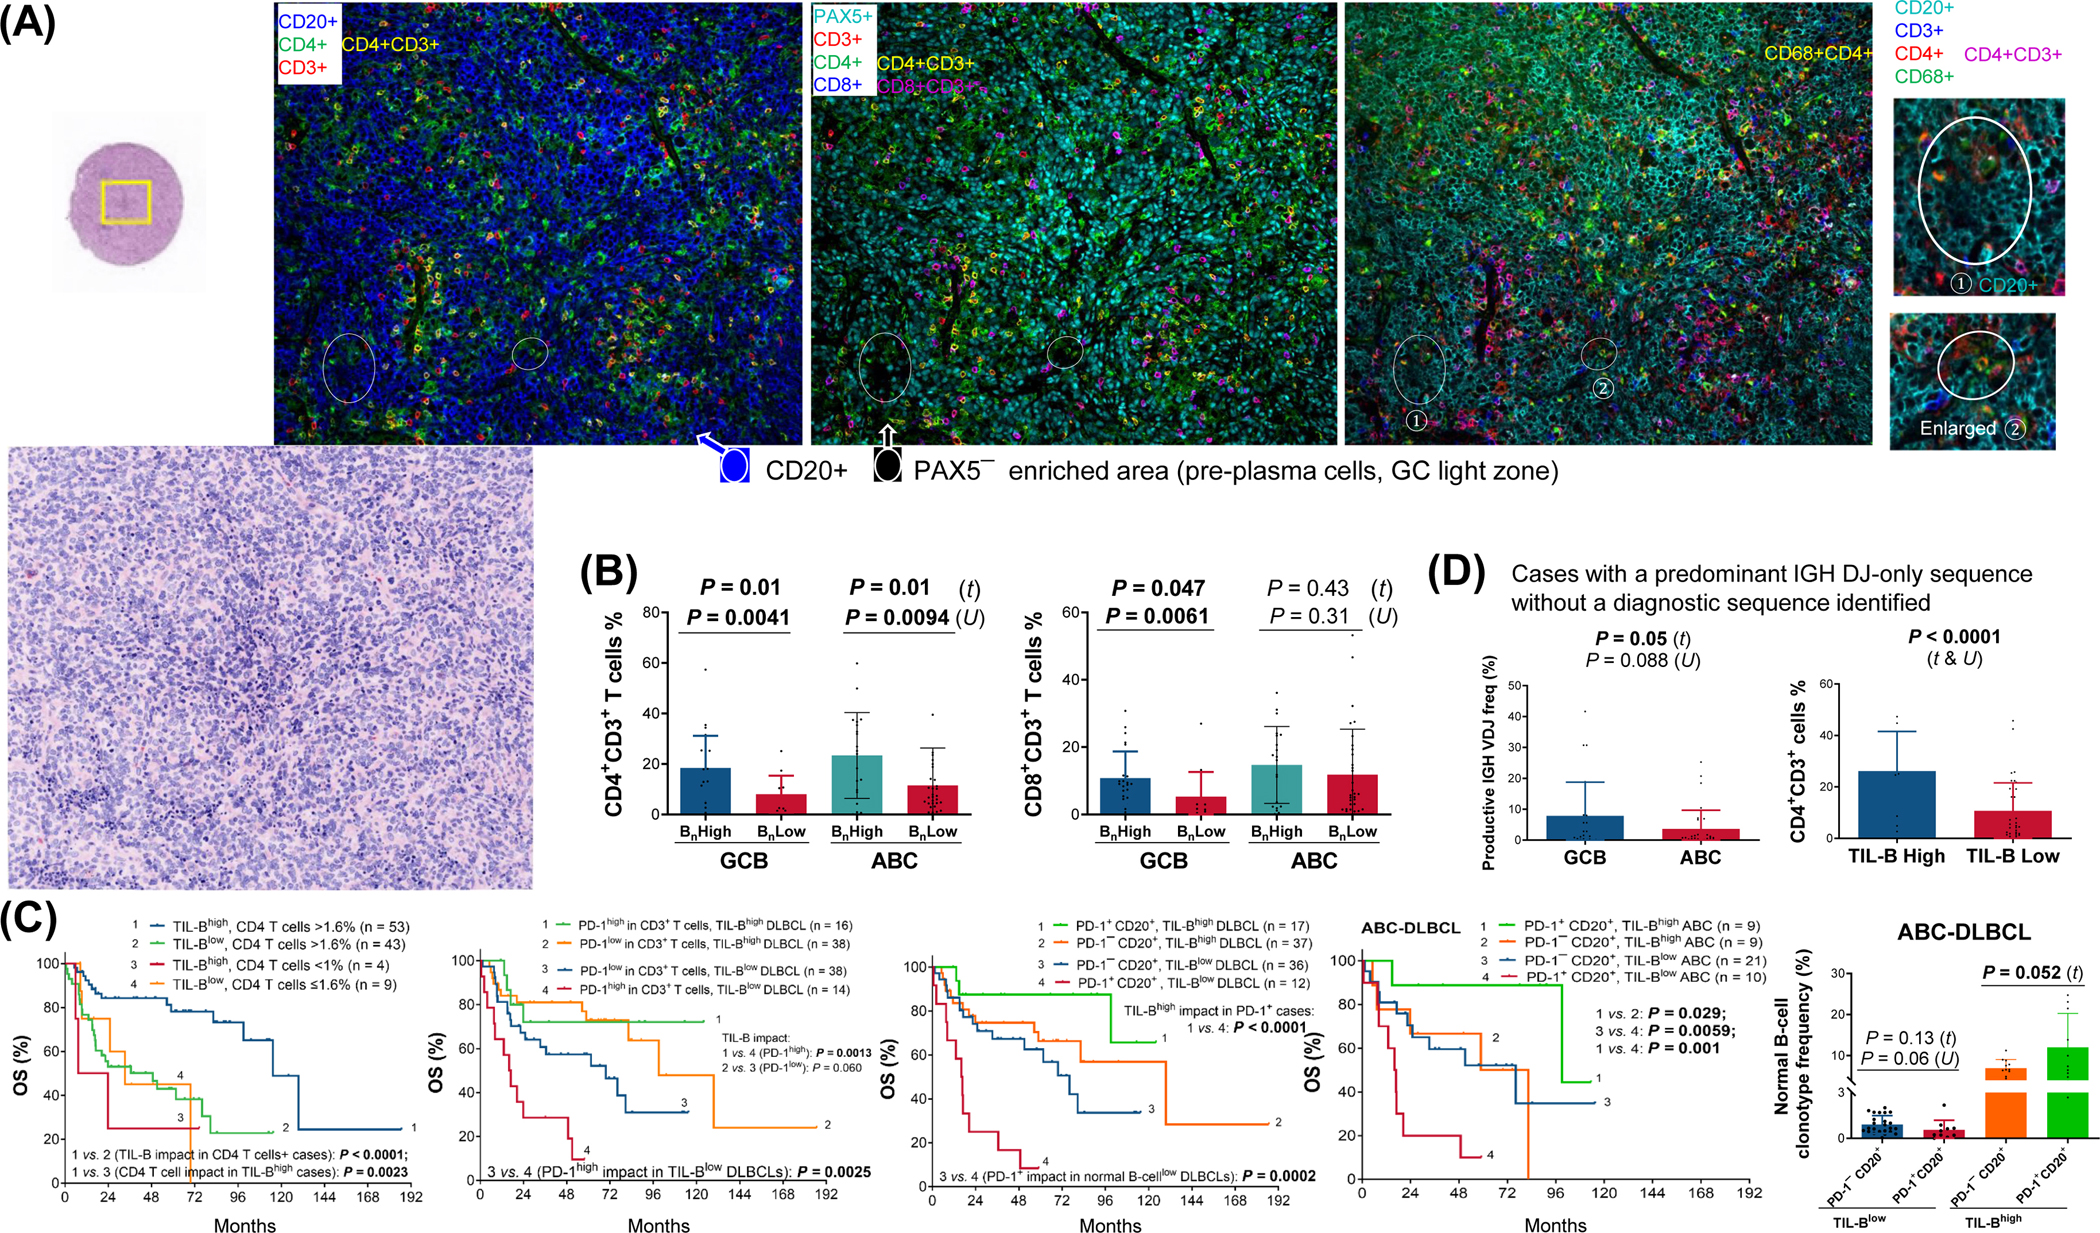
Purpose: Tumor-infiltrating B lymphocytes (TIL-B) have demonstrated prognostic and predictive significance in solid cancers. In this study, we aimed to distinguish TIL-Bs from malignant B-cells in diffuse large B-cell lymphoma (DLBCL) and determine the clinical and biological significance.

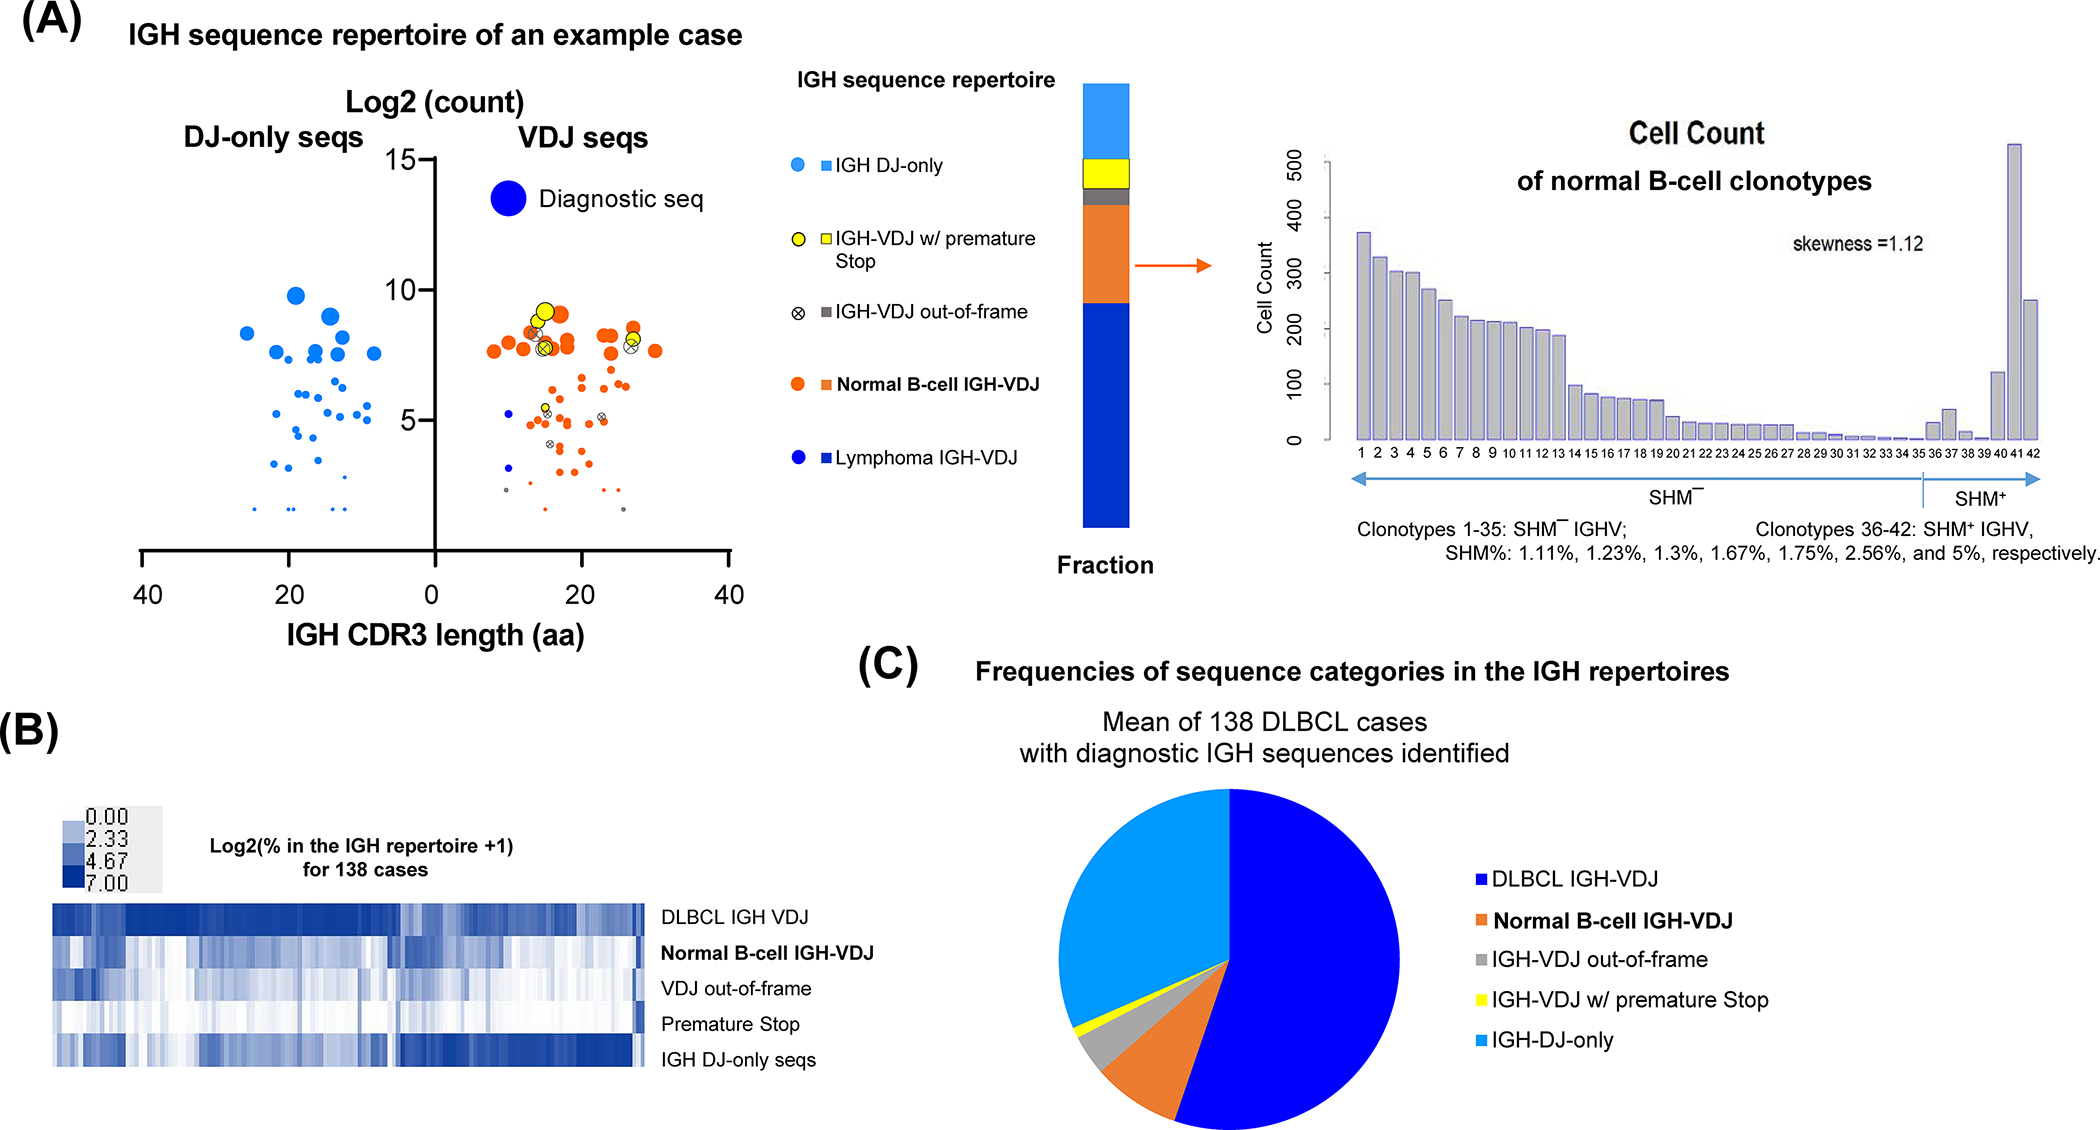
Experimental design: A total of 269 patients with de novo DLBCL from the International DLBCL R-CHOP Consortium Program were studied. Ultra-deep sequencing of the immunoglobulin genes was performed to determine B-cell clonotypes. The frequencies and numbers of TIL-B clonotypes in individual repertoires were correlated with patient survival, gene expression profiling (GEP) data, and frequencies of DLBCL-infiltrating immune cells quantified by fluorescent multiplex IHC at single-cell resolution.

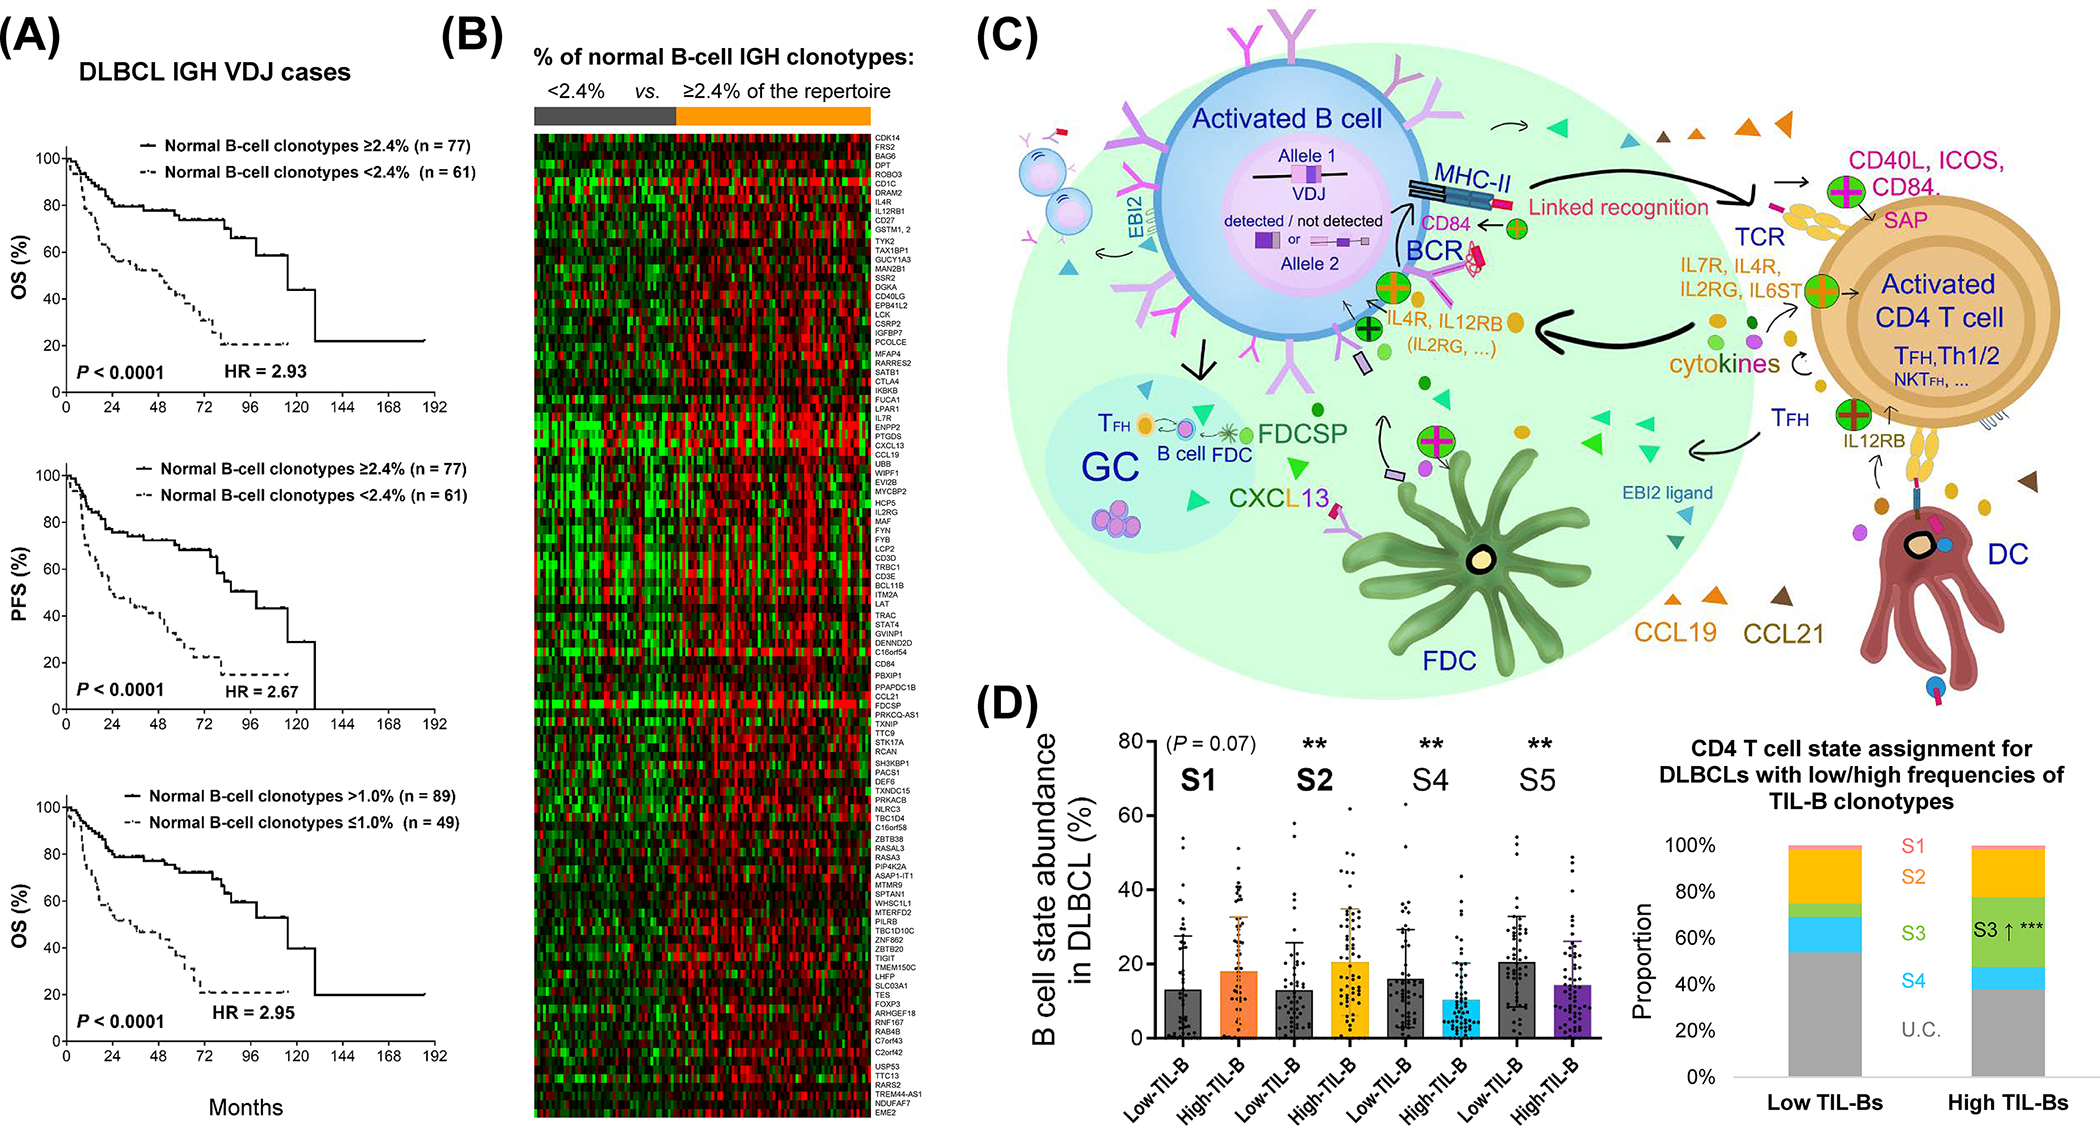
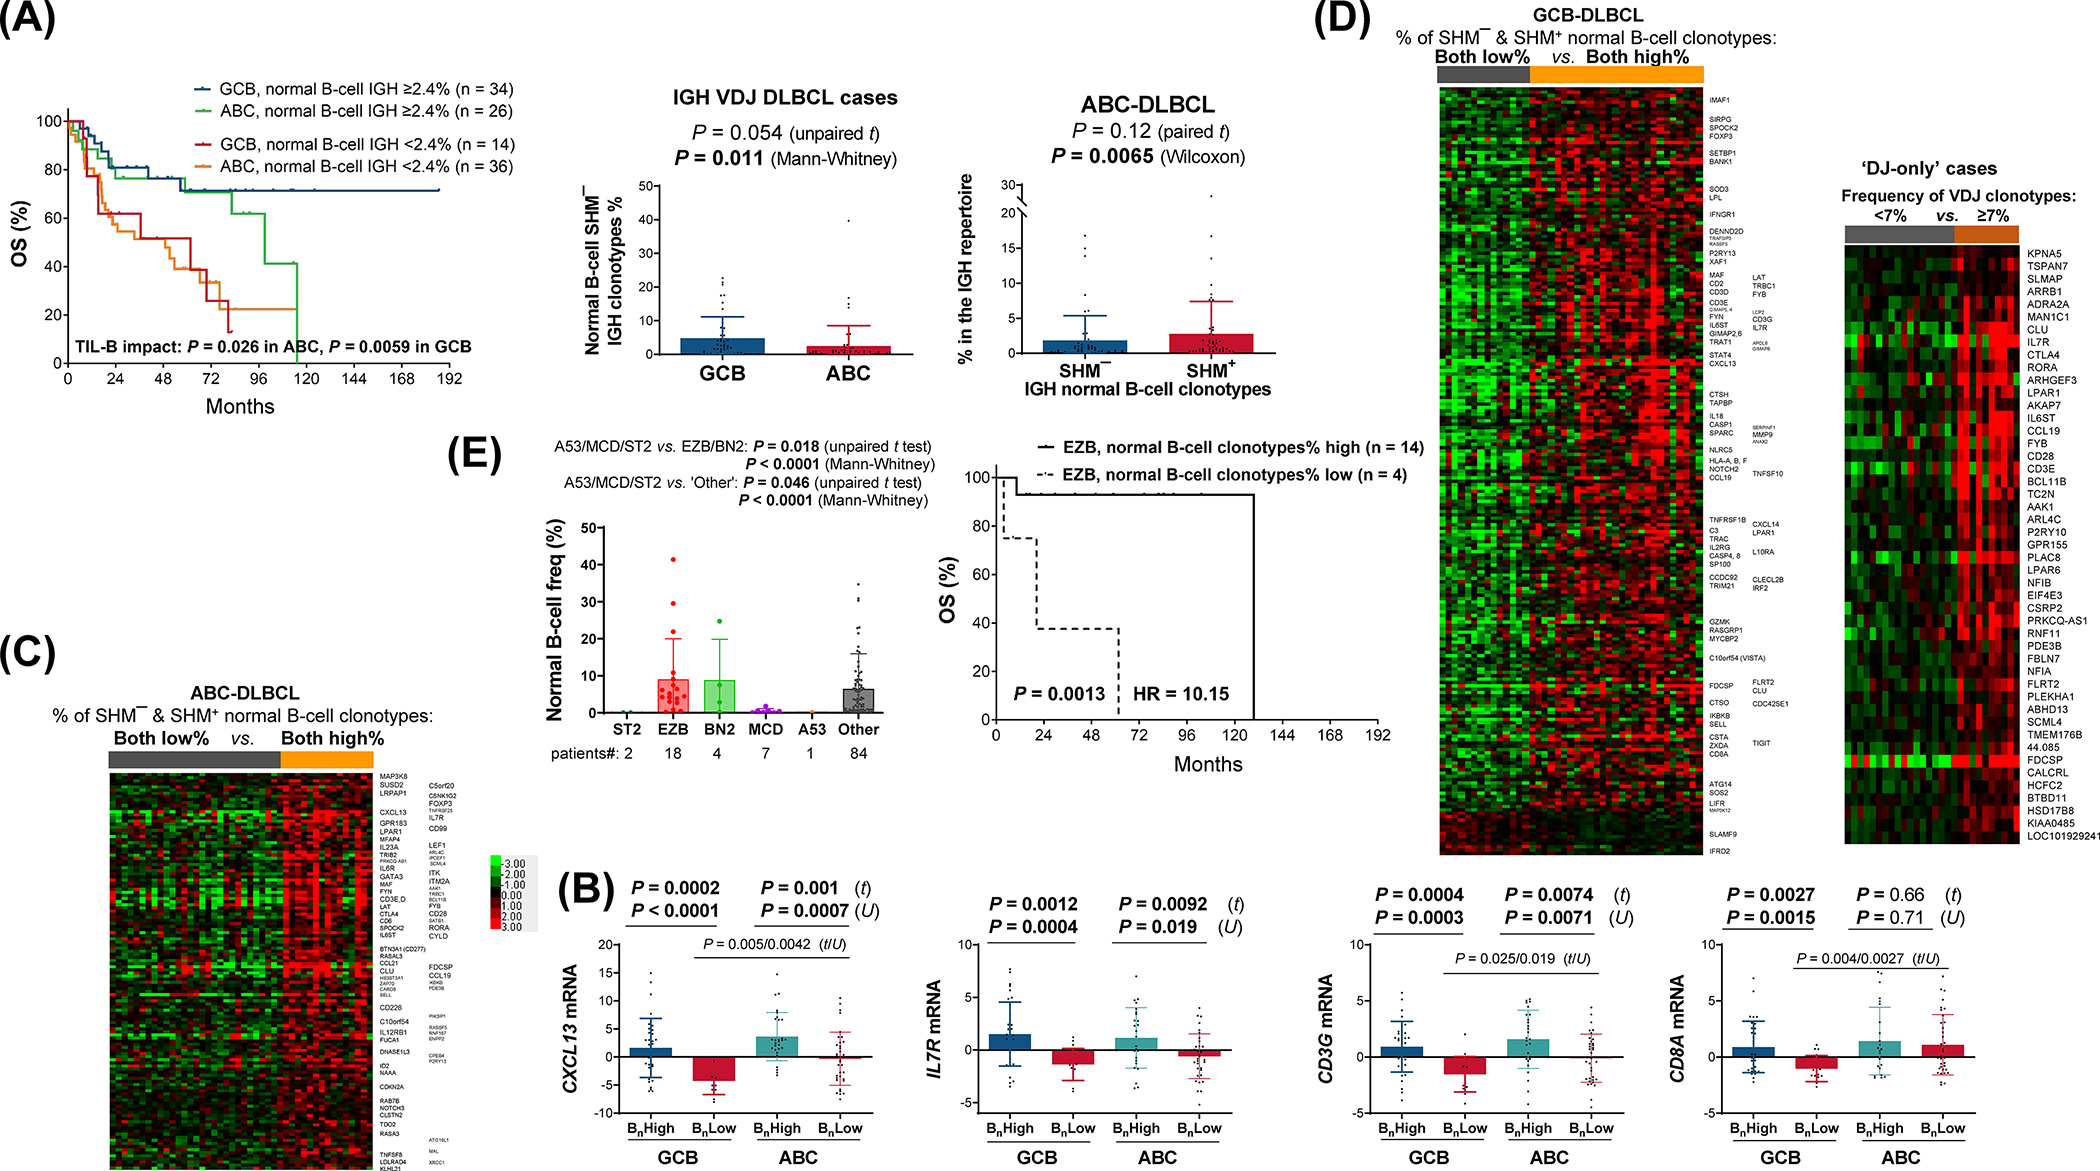
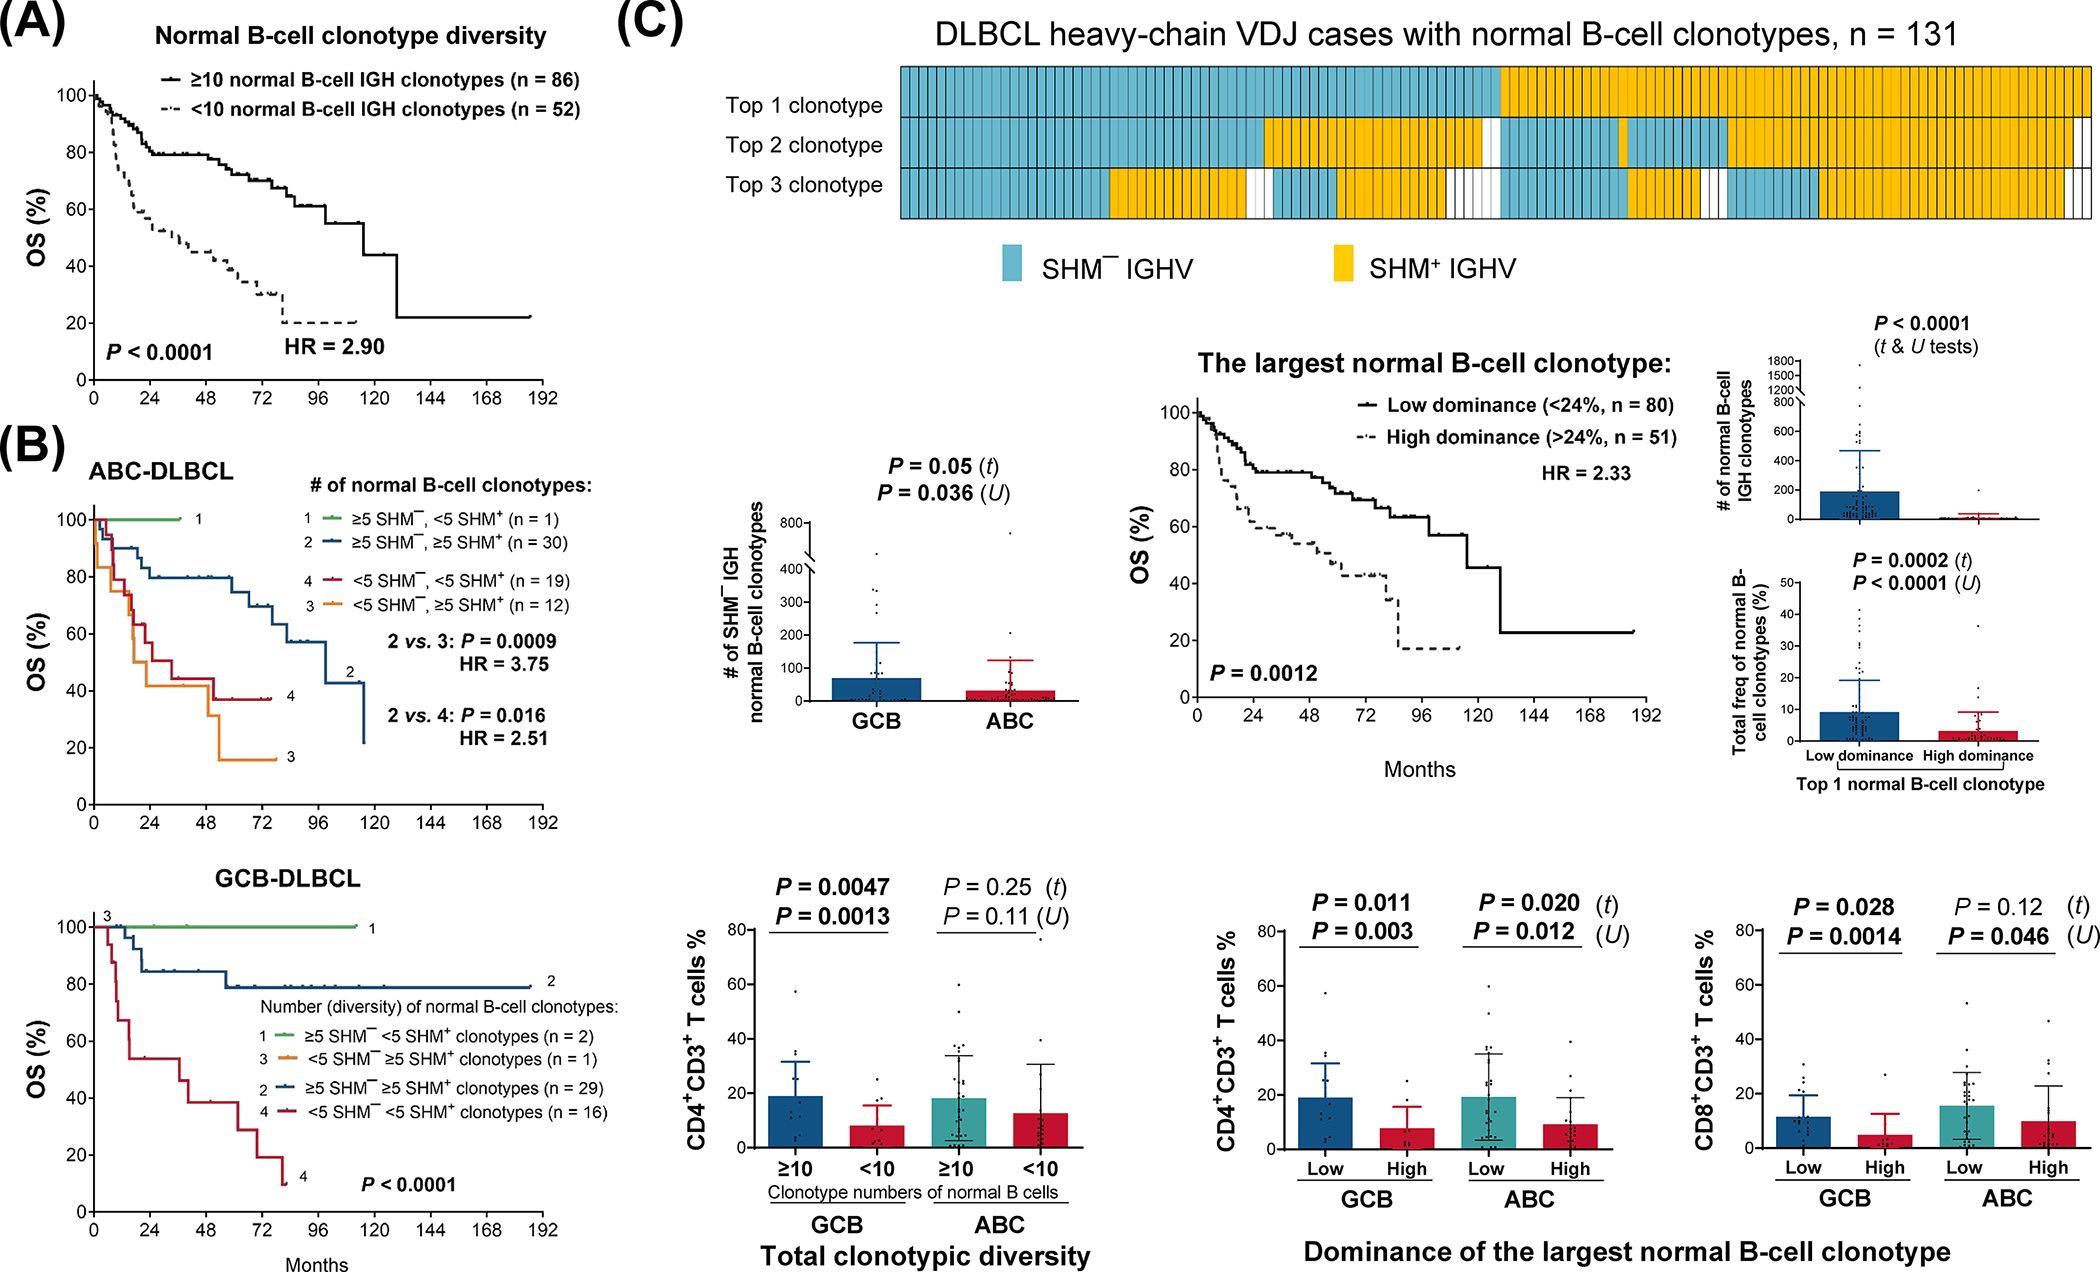
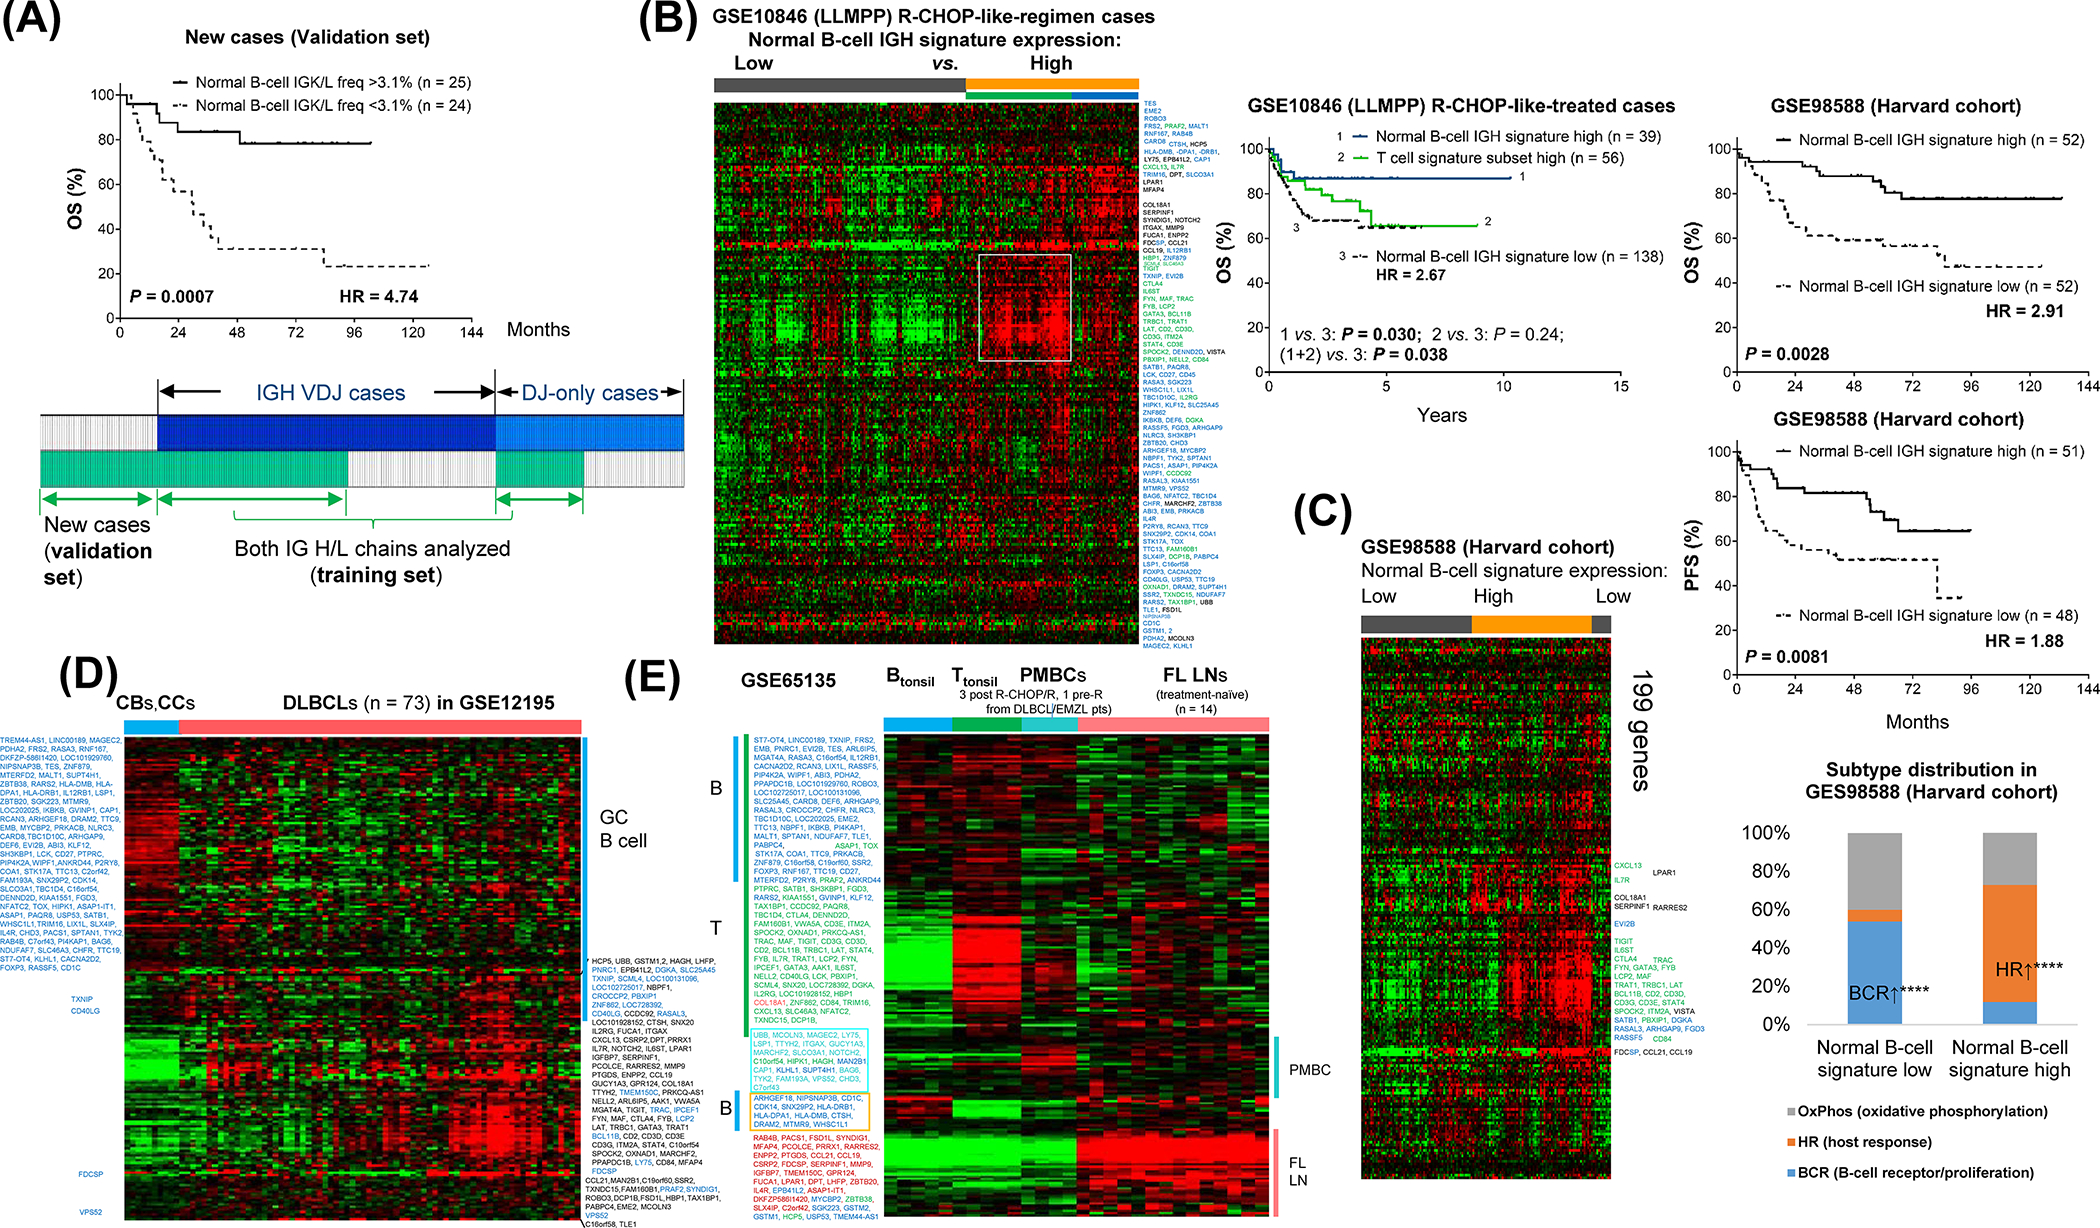
Results: TIL-B abundance, evaluated by frequencies of normal B-cell clonotypes in the immunoglobulin repertoires, remarkably showed positive associations with significantly better survival of patients in our sequenced cohorts. DLBCLs with high versus low TIL-B abundance displayed distinct GEP signatures, increased pre-memory B-cell state and naïve CD4 T-cell state fractions, and higher CD4+ T-cell infiltration. TIL-B frequency, as a new biomarker in DLBCL, outperformed the germinal center (GC) B-cell-like/activated B-cell-like classification and TIL-T frequency. The identified TIL-B-high GEP signature, including genes upregulated during T-dependent B-cell activation and those highly expressed in normal GC B cells and T cells, showed significant favorable prognostic effects in several external validation cohorts.

Conclusions: TIL-B frequency is a significant prognostic factor in DLBCL and plays a crucial role in antitumor immune responses. This study provides novel insights into the prognostic determinants in DLBCL and TIL-B functions with important therapeutic implications.


Conflict of interest statement

Authors’ Disclosure

T.S. and I.K. were employees of Adaptive Biotechnologies during their contributions to this research. QA is an employee of NeoGenomics Laboratories, Inc..

Other authors declare no potential conflicts of interest.

Figures

Figure 1.
Figure 1.
Composition of immunoglobulin heavy chain gene (IGH) sequence repertoires amplified from DNA samples extracted from DLBCL diagnostic tissues. (A) Left: A scatterplot illustrating the diverse clonotypes in an example IGH repertoire, which included a predominant productive IGH sequence and its two derivative sequences likely derived from lymphoma cells, other productive IGH sequences likely derived from normal B cells, unproductive VDJ sequences due to either out-of-frame insertion/deletions or mutations resulting in premature Stop codons, and DJ-only sequences (V genes were not inferred from IMGT) that could be derived from non-functional alleles or fragmented V genes in FFPE tissues. Note: The size of dots reflects, but are not scaled to, the normalized read count of each sequence. Middle: A stacked column chart showing the fraction of five categories of IGH sequences in this repertoire calculated by the normalized sequence read counts. Right: a column chart showing the normalized read counts of normal B-cell-derived clonotypes (range, 2–532 cell counts [2 was the cutoff to be included in the clonotype analysis]. For comparison, counts for the diagnostic clonotype and two derivative clonotypes were 11,709, 37 and 8, respectively). The somatic hypermutation (SHM) status of each clonotype is indicated below the chart. (B) A heatmap to visualize the Log2 transformed frequencies of five categories of sequences calculated from normalized read counts in individual IGH repertoires of 138 patients with DLBCL. Each column represents one patient’s repertoire. (C) A pie chart showing the mean frequencies of five categories of IGH sequences in the 138 repertoires.
Figure 2.
Figure 2.
Prognostic and gene expression profiling (GEP) analyses for the frequencies of normal B-cell IGH clonotypes in 138 patients with DLBCL. (A) Overall survival (OS) and progression-free survival (PFS) curves for high frequencies of normal B-cell clonotypes using a 2.4% cutoff and OS using a 1% cutoff. (B) Heatmap showing the significantly differentially expressed genes between patients with and without high frequencies (≥2.4%) of normal B-cell clonotypes with q < 0.01 and local false discovery rate < 0.025 by SAM. (C) Illustration of T-dependent B-cell activation suggested by the GEP signature associated with high frequencies of normal B-cell clonotypes. For simple illustration, molecules associated with T:B cell interaction and activation are depicted on a same T cell and a same B cell, even though the TFH cell is not extrafollicular. Most molecules illustrated are included in the heatmap in panel B, except for IL6ST with a higher q (0.0157, local false discovery rate: 0.0257), EBI2 and SAP which are significant in other TIL-B-associated signatures identified in this study (Supplementary Table 3 and Supplementary Table 8). (D) Comparisons between DLBCLs with and without high frequencies (≥2.4%) of normal B-cell clonotypes regarding B cell state (S) abundance and the T cell state assignment for DLBCL cases. Significance: **: P < 0.01; ***: P < 0.005. In the scatter plot, each dot represent one patient. The stacked column chart shows the proportion of patients with a T cell state assignment according to the most abundant T cell state in that case. Abbreviation: U.C. unclassified.
Figure 3.
Figure 3.
Prognostic and GEP analyses for normal B-cell IGH clonotypes in DLBCL cell-of-origin and genetic subtypes. (A) Left: High frequencies of normal B-cell clonotypes showed significant favorable prognostic effects in both GCB and ABC subtypes, whereas GCB/ABC cell-of-origin did not show significant effects in two groups stratified by normal B-cell clonotype frequencies. Right: Scatter plots showing the distribution (dots) and mean (bars) frequencies of SHM IGH normal B-cell clonotypes in GCB and ABC subtypes of DLBCL; in the ABC subtype, SHM+ IGH normal B-cell clonotypes showed higher frequencies than SHM IGH normal B-cell clonotypes by Wilcoxon matched paired signed rank test. (B) Scatter plots showing the distribution and mean transcriptional expression levels of immune genes in GCB/ABC patients with high/low frequencies of normal B-cell (Bn) clonotypes. ABC compared with GCB patients with Bn Low status had heterogeneously higher expression of immune genes. P values by Mann-Whitney test (2-tailed) are also provided. The expression values on the y axis are median centered log2(Robust Multi-chip Average [RMA] expression measure) processed and normalized by R package affy. (C) Heatmap visualizing differentially expressed genes (DEGs) between ABC-DLBCL cases with both high frequencies of SHM and SHM+ IGH normal B-cell clonotypes and those with both low. Most of these genes were not statistically significant in SAM analysis. (D) Left: Heatmap of significant DEGs of GCB-DLBCL cases with frequencies of SHM and SHM+ IGH normal B-cell clonotypes both being high vs. both low (q < 0.01, local false discovery rate ≤ 0.03). Right: Heatmap showing significant DEGs of high vs. low frequencies of productive VDJ clonotypes in the sequence repertoires of ‘DJ-only’ GCB-DLBCL cases. (E) A scatter plot showing the distribution (dots) and mean (bars) frequencies of normal B-cell clonotypes in genetic subtypes. Due to the small case numbers, A53, MCD and ST2 cases were combined for statistical significance in comparisons. P values by Mann-Whitney test (2-tailed) are also provided. High frequencies of normal B-cell clonotypes correlated with significantly better OS in the EZB genetic subtype.
Figure 4.
Figure 4.
Prognostic and correlative analyses for IGH clonotypic diversity of TIL-Bs in 138 patients with DLBCL. (A) High IGH clonotypic diversity of TIL-Bs (≥10 clonotypes) was associated with significantly better survival. (B) Survival analysis for IGH clonotypic diversity of TIL-Bs dissecting SHM+ and SHM clonotypes in GCB- and ABC-DLBCL. With a cutoff of ≥5 clonotypes for high diversity, the diversity status of SHM+ and SHM normal B-cell clonotypes was consistent in most GCB-DLBCL cases; in contrast, 28.6% of ABC-DLBCL cases with ≥5 SHM+ clonotypes (12 patients) had low-diversity (<5) of SHM clonotypes of normal B cells and significantly poorer survival. The scatter plot on the right side of survival curves in ABC-DLBCL shows that the ABC subtype had significantly lower numbers of SHM IGH normal B-cell clonotypes compared to the GCB subtype (unpaired t test; P value by Mann-Whitney test is also provided). (C) Top: A plot showing mutation status of the top 3 most expanded normal B-cell clonotypes in 131 patients with normal B-cell clonotypes (each column represents one patient). Middle: High dominance of the largest normal B-cell clonotype in bulk TIL-Bs was associated with significantly poorer OS, lower clonotype numbers, and lower total frequencies of normal B-cell clonotypes. Bottom: High clonotypic diversity (≥10) of normal B-cells was associated with significantly higher frequencies of CD3+CD4+ T cells in GCB-DLBCL. High dominance of the largest normal B-cell clonotype was associated with significantly lower frequencies of CD3+CD4+ T cells in the GCB/ABC subtypes and with significantly lower frequencies of CD3+CD8+ T cells in the GCB subtype only. Note: the bars indicate mean levels; P values by Mann-Whitney test (2-tailed) are also provided.
Figure 5.
Figure 5.
Fluorescent multiplex immunohistochemistry (mIHC) and correlative and prognostic analyses for the quantified immunofluorescence. (A) Representative mIHC images and corresponding H&E staining of a tissue core from the example case shown in Figure 1A. Original magnification 20x; each field of view: 2560×2160 pixels (~0.832×0.702mm). Two representative areas enriched with PAX5CD20+ cells are marked by white circles in three images and enlarged for the third image, which can also differentiate the CD68 status of CD4+CD3 cells. (B) High frequencies of normal B-cell clonotypes (cutoff: ≥2.4%) were associated with significantly higher frequencies of CD3+CD4+ TIL-Ts in the GCB/ABC subtypes of DLBCL (and overall DLBCL) and with higher frequencies of CD3+CD8+ T cells in the GCB subtype only (but not in the ABC subtype and overall DLBCL). Note: the bars indicate mean levels; P values by Mann-Whitney test (2-tailed) are also provided. (C) Left: Prognostic analysis with two factors in overall cohort. One factor is high/low frequency status of normal B-cell clonotypes (cutoff: ≥2.4%), and the other factor is deficiency/proficiency status of CD4+CD3+ cells (cutoff: >1.6% of total cell counts of PAX5+ cells, CD3+ cells, CD68+ cells, and CD56+ cells), PD-1+ percentage expression in CD3+ cells (cutoff: >50% of CD3+ cells), or PD-1+ percentage expression in CD20+ cells (cutoff: ≥5% of CD20+ cells). Right: In ABC-DLBCL, PD-1+ expression in CD20+ cells showed opposite prognostic effects in TIL-B-low and TIL-B-high cases, as well as associations of opposite trends of frequencies of normal B-cell clonotypes. (D) In ‘DJ-only’ cases (cases with a predominant IGH DJ-only sequence without a diagnostic VDJ sequence identified), GCB compared with ABC subset had a significantly higher mean frequency of productive VDJ clonotypes in the IGH sequence repertoires. High frequencies of productive VDJ clonotypes in these repertoires were associated with significantly higher frequencies of CD3+CD4+ TIL-Ts quantified by mIHC.
Figure 6.
Figure 6.
Validation of the prognostic effects of TIL-Bs in other DLBCL cohorts. (A) Cases with TIL-Bs already evaluated by IG heavy-chain clonotypes were viewed as the training cohort, and new cases with only IG light-chain clonotypes analyzed were used as a validation cohort. High frequencies of normal B-cell light-chain clonotypes were associated with significantly better OS in both the training and validation cohorts. The cutoff for high frequency was same as the median value in the training cohort and the overall light-chain cases (Supplementary Figure 10). The plot below illustrates the relationship between the analyzed IGH and IG light-chain cases. Each column represents one patient. (B) Validating the prognostic effect of a gene signature identified in this study (Signature 1, Supplementary Table 3) in 233 DLBCL cases treated with R-CHOP-like regimen from the GSE10846 dataset (LLMPP validation cohort). Patients with high expression identified by unsupervised clustering had significantly better overall survival. However, a subcluster shown in a white box had no significant prognostic effect albeit upregulation of T-cell signature genes. Notes: Not all genes were labeled due to space limitation. For labeled genes, blue color indicates high expression in normal B-cell control signatures in figure panels D and/or E; green color indicates high expression in the T-cell but not B-cell control signature in panel E. Some genes have both colors, due to the different clustering results in panels D and E. (C) Validating Signature 1 in the GSE98588 dataset (Harvard validation cohort, 137 cases. Not all cases had OS and PFS data). Visualized cluster of high expression by unsupervised clustering was associated with significantly better OS and PFS and higher proportion of HR (“host response”) subtype in this cohort. BCR/proliferation subtype of DLBCL was associated with low expression of the gene signature identified in this study. (D-E) Unsupervised clustering in the GSE12195 and GSE65135 datasets using the same gene signature identified in this study. Blue color was used for labeling genes showing high expression in control B cells (purified germinal center B cells in the panel D, and tonsil B cells in the panel E). For the rest of genes, genes showing high expression in tonsil T cells are in green color, genes shown in the PMBC cluster are in cyan color, and the remaining follicular lymphoma cluster genes are in red color. Abbreviations: CB, centroblasts; CC, centrocytes; PBMC, peripheral blood mononuclear cell; FL, follicular lymphoma; LN, lymph node.

Similar articles

Cited by

References

    1. Murphy K, Weaver C Janeway’s Immunobiology, Tenth Edition. New York, W. W. Norton & Company; 2022.
    1. Abbas AK, Lichtman AH, Pillai S. Cellular and Molecular Immunology, Tenth Edition. Philadelphia, PA: Elsevier; 2022.
    1. Fridman WH, Meylan M, Petitprez F, Sun CM, Italiano A, Sautès-Fridman C. B cells and tertiary lymphoid structures as determinants of tumour immune contexture and clinical outcome. Nat Rev Clin Oncol 2022;19:441–457. - PubMed
    1. Schumacher TN, Thommen DS. Tertiary lymphoid structures in cancer. Science 2022;375:eabf9419. - PubMed
    1. Yu K, Ravoor A, Malats N, Pineda S, Sirota M. A Pan-Cancer Analysis of Tumor-Infiltrating B Cell Repertoires. Front Immunol 2021;12:790119. - PMC - PubMed

Publication types

Substances