Meta-Analysis
. 2023 Sep 1;12(9):12.
doi: 10.1167/tvst.12.9.12.

Short-Term Outcomes of Trabeculectomy With or Without Anti-VEGF in Patients With Neovascular Glaucoma: A Systematic Review and Meta-Analysis

Affiliations
Meta-Analysis

Short-Term Outcomes of Trabeculectomy With or Without Anti-VEGF in Patients With Neovascular Glaucoma: A Systematic Review and Meta-Analysis

Xi Zhou et al. Transl Vis Sci Technol. .

Abstract

Objectives: The aim of this study was to compare the safety and efficacy of trabeculectomy alone or combined with intravitreal injections of anti-vascular endothelial growth factor (anti-VEGF) agents for the treatment of neovascular glaucoma.

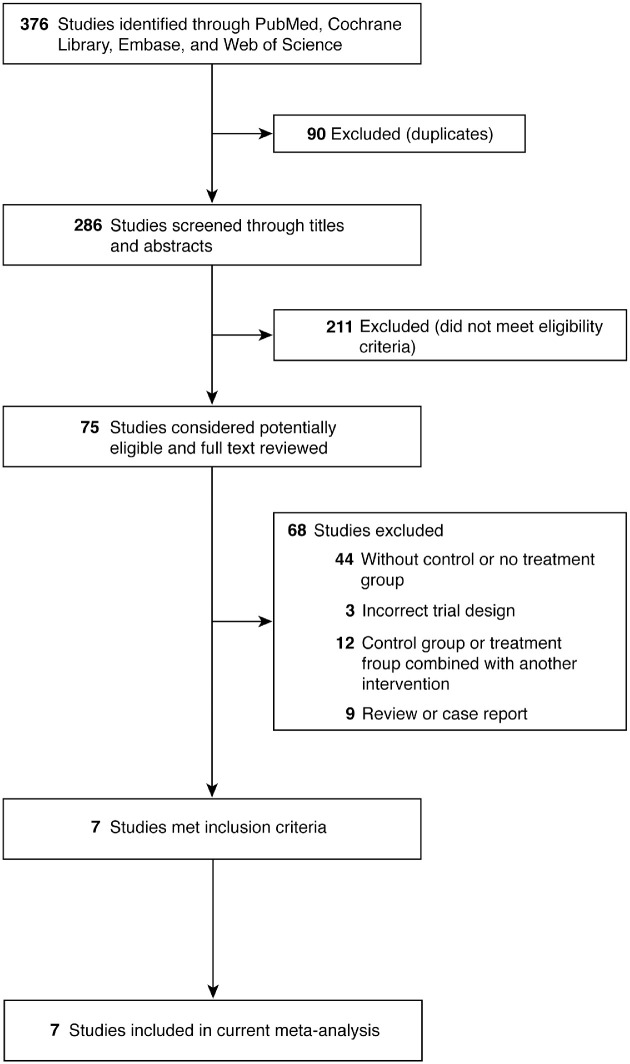
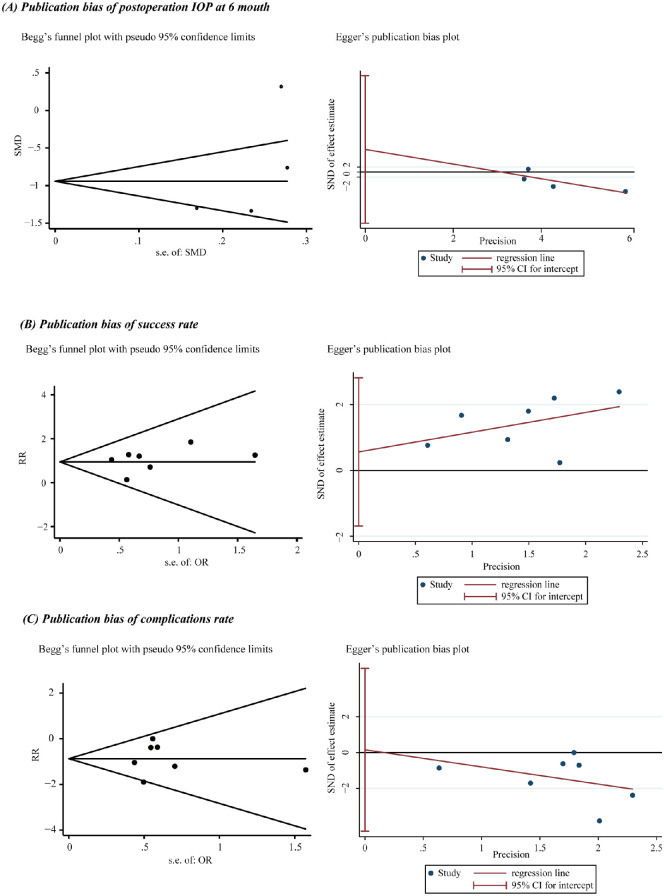
Methods: We conducted a systematic review and meta-analysis to compare the effects of trabeculectomy alone or combined with intravitreal injections of anti-VEGF agents for the treatment of neovascular glaucoma. We searched four databases (PubMed, Cochrane Library, Embase, and Web of Science) up to January 2023 and extracted data on three surgical outcomes: postoperative intraocular pressure, success rate and complications. We used a random-effects model to calculate pooled relative risk (RR) or standardized mean difference (SMD) estimates and 95% confidence intervals (CIs). We assessed publication bias using Begg and Egger tests.

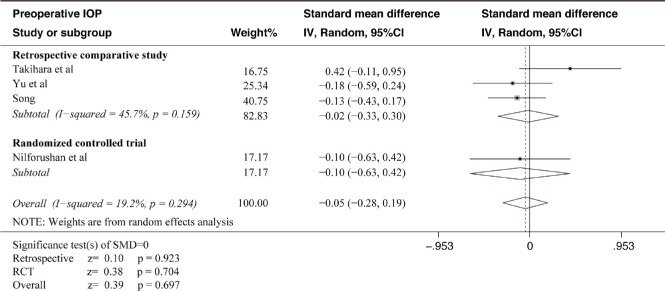
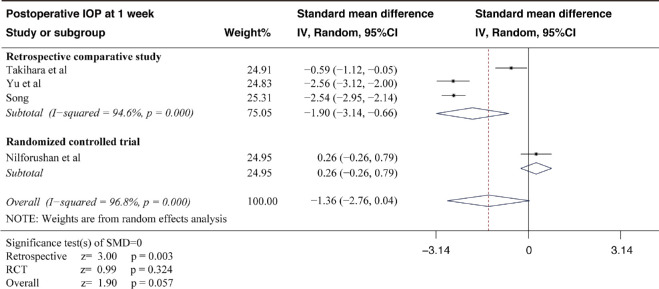
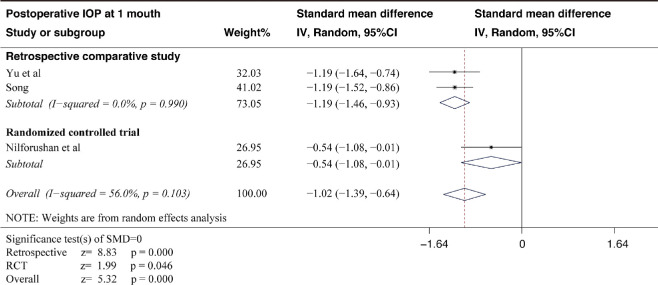
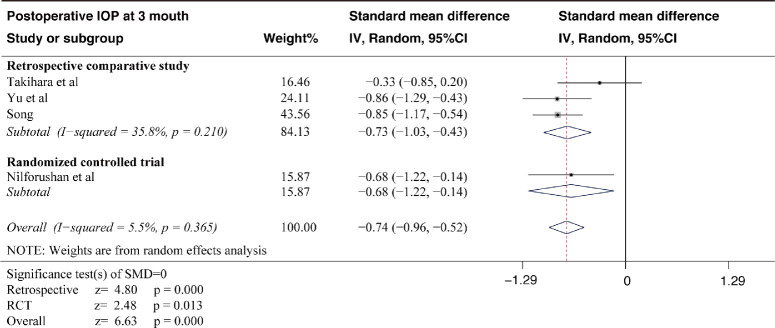
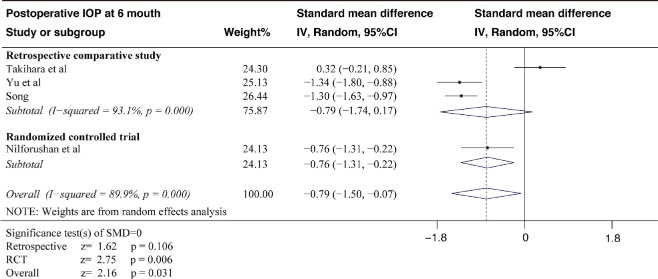
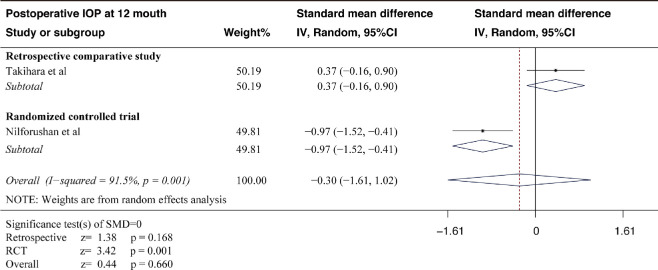
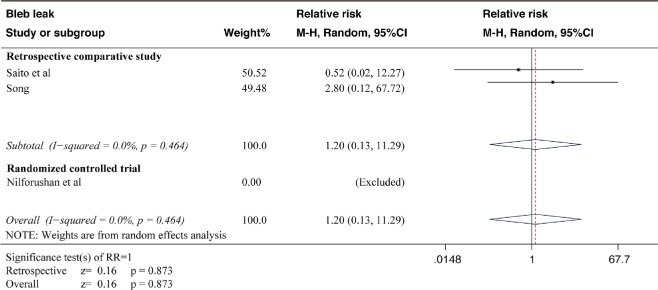
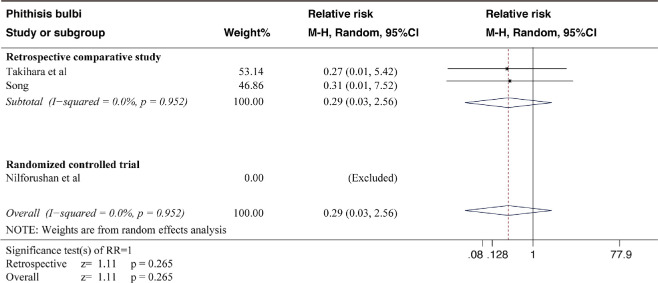
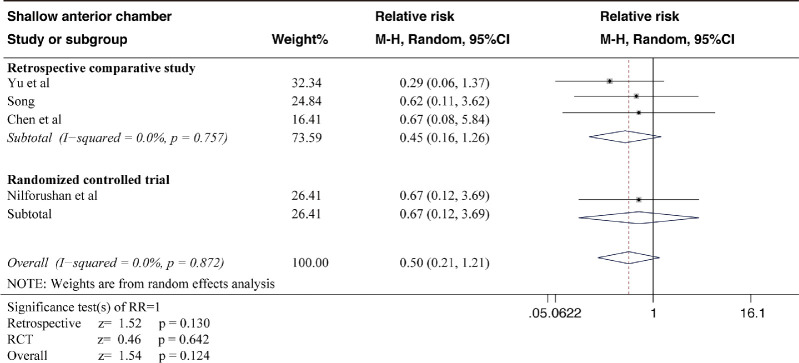
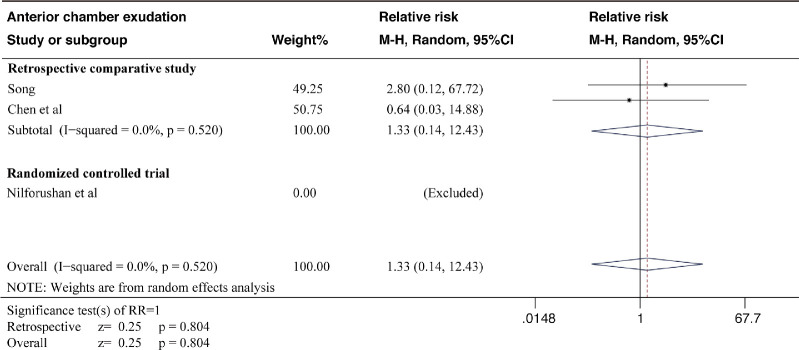
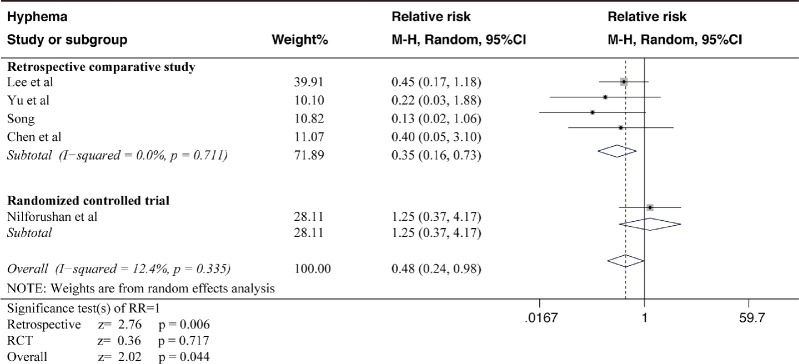
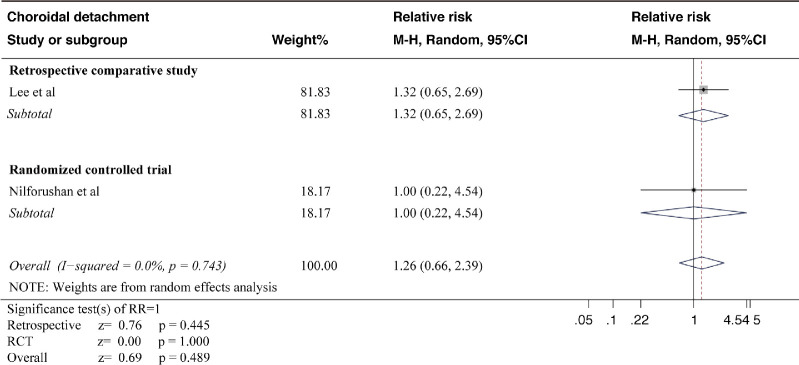
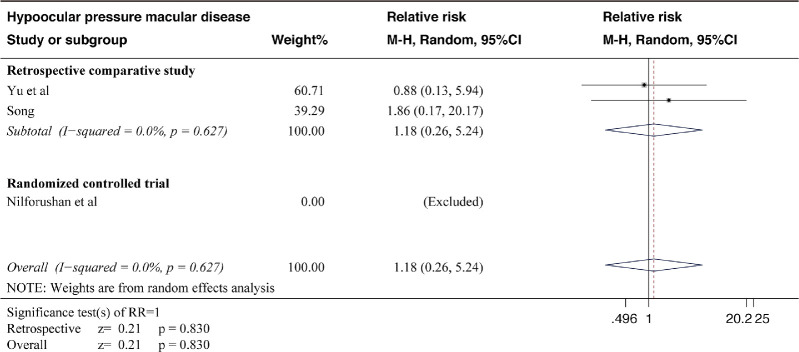
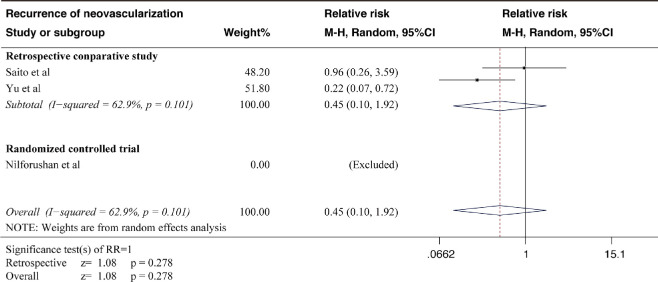
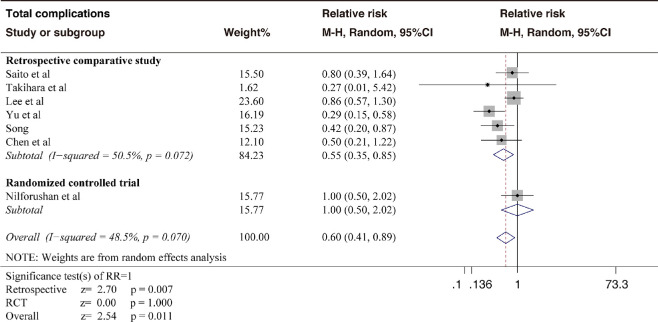
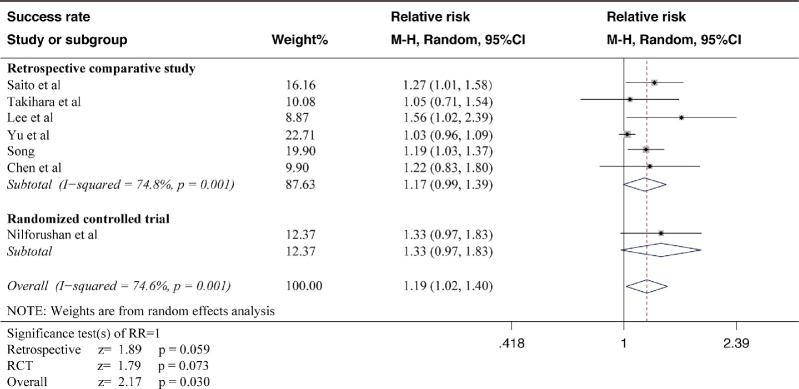
Results: We included seven studies with 353 eyes. Compared to trabeculectomy alone, trabeculectomy with anti-VEGF had a lower risk of postoperative complications (RR, 0.60; 95% CI, 0.41-0.89) and higher success rate (RR, 1.19; 95% CI, 1.02-1.40). The intraocular pressure reduction was significantly greater in the trabeculectomy with anti-VEGF augmentation group than the trabeculectomy group from 1 week (SMD, -1.36; 95% CI, -2.76 to 0.04) to 6 months (SMD, -0.79; 95% CI, -1.50 to -0.07) after surgery.

Conclusions: According to current evidence, adding intravitreal injection of anti-VEGF agents to trabeculectomy may improve the short time outcomes of patients with neovascular glaucoma.


Conflict of interest statement

Disclosure: X. Zhou, None; J. Chen, None; W. Luo, None; Y. Du, None

Figures

Figure 1.
Figure 1.
Flowchart of literature selection for this meta-analysis.
Figure 2.
Figure 2.
Forest plot of preoperative IOP in trabeculectomy combined with anti-VEGF and trabeculectomy alone for neovascular glaucoma. The forest plot shows the meta-analysis results of the data on IOP of preoperative baseline in the included studies. The SMD and its 95% CI are shown for each study and the pooled estimate. RCT, randomized controlled trial.
Figure 3.
Figure 3.
Forest plot of IOP reduction in trabeculectomy combined with anti-VEGF and trabeculectomy alone for neovascular glaucoma at 1 week postoperatively. The forest plot shows the meta-analysis results of the data on IOP of 1 week postoperatively in the included studies. The SMD and its 95% CI are shown for each study and the pooled estimate.
Figure 4.
Figure 4.
Forest plot of IOP reduction in trabeculectomy combined with anti-VEGF and trabeculectomy alone for neovascular glaucoma at 1 month postoperatively. The forest plot shows the meta-analysis results of the data on IOP at 1 month postoperatively in the included studies. The SMD and its 95% CI are shown for each study and the pooled estimate. The pooled estimate shows a significant difference in IOP reduction between the two groups.
Figure 5.
Figure 5.
Forest plot of IOP reduction in trabeculectomy combined with anti-VEGF and trabeculectomy alone for neovascular glaucoma at 3 months postoperatively. The forest plot shows the meta-analysis results of the data on IOP at 3 months postoperatively in the included studies. The SMD and its 95% CI are shown for each study and the pooled estimate. The pooled estimate shows a significant difference in IOP reduction between the two groups.
Figure 6.
Figure 6.
Forest plot of IOP reduction in trabeculectomy combined with anti-VEGF and trabeculectomy alone for neovascular glaucoma at 6 months postoperatively. The forest plot shows the meta-analysis results of the data on IOP at 6 months postoperatively in the included studies. The SMD and its 95% CI are shown for each study and the pooled estimate. The pooled estimate shows a significant difference in IOP reduction between the two groups.
Figure 7.
Figure 7.
Forest plot of IOP reduction in trabeculectomy combined with anti-VEGF and trabeculectomy alone for neovascular glaucoma at 12 months postoperatively. The forest plot shows the meta-analysis results of the data on IOP at 12 months postoperatively in the included studies. The SMD and its 95% CI are shown for each study and the pooled estimate.
Figure 8.
Figure 8.
Forest plot of postoperative complications of bleb leak in trabeculectomy combined with anti-VEGF and trabeculectomy alone for neovascular glaucoma. The forest plot shows the meta-analysis results of the data on postoperative complications of bleb leak from the included studies. The horizontal lines represent the 95% CI. The diamonds represent the pooled RR and its 95% CI.
Figure 9.
Figure 9.
Forest plot of postoperative complications of phthisis bulbi in trabeculectomy combined with anti-VEGF and trabeculectomy alone for neovascular glaucoma. The forest plot shows the meta-analysis results of the data on postoperative complications of phthisis bulbi from the included studies. The horizontal lines represent the 95% CI. The diamonds represent the pooled RR and its 95% CI. The pooled estimate shows a significant difference in postoperative hyphema between the two groups.
Figure 10.
Figure 10.
Forest plot of postoperative complications of shallow anterior chamber in trabeculectomy combined with anti-VEGF and trabeculectomy alone for neovascular glaucoma. The forest plot shows the meta-analysis results of the data on postoperative complications of shallow anterior chamber from the included studies. The horizontal lines represent the 95% CI. The diamonds represent the pooled RR and its 95% CI. The pooled estimate shows a significant difference in postoperative hyphema between the two groups.
Figure 11.
Figure 11.
Forest plot of postoperative complications of anterior chamber exudation in trabeculectomy combined with anti-VEGF and trabeculectomy alone for neovascular glaucoma. The forest plot shows the meta-analysis results of the data on postoperative complications of anterior chamber exudation from the included studies. The horizontal lines represent the 95% CI. The diamonds represent the pooled RR and its 95% CI.
Figure 12.
Figure 12.
Forest plot of postoperative complications of hyphema in trabeculectomy combined with anti-VEGF and trabeculectomy alone for neovascular glaucoma. The forest plot shows the meta-analysis results of the data on postoperative complications of hyphema from the included studies. The horizontal lines represent the 95% CI. The diamonds represent the pooled relative risk and its 95% CI. The pooled estimate shows a significant difference in postoperative hyphema between the two groups.
Figure 13.
Figure 13.
Forest plot of postoperative complications of choroidal detachment in trabeculectomy combined with anti-VEGF and trabeculectomy alone for neovascular glaucoma. The forest plot shows the meta-analysis results of the data on postoperative complications of choroidal detachment from the included studies. The horizontal lines represent the 95% CI. The diamonds represent the pooled RR and its 95% CI.
Figure 14.
Figure 14.
Forest plot of postoperative complications of hypo-ocular pressure macular disease in trabeculectomy combined with anti-VEGF and trabeculectomy alone for neovascular glaucoma. The forest plot shows the meta-analysis results of the data on postoperative complications of hypo-ocular pressure macular disease from the included studies. The horizontal lines represent the 95% CI. The diamonds represent the pooled RR and its 95% CI.
Figure 15.
Figure 15.
Forest plot of postoperative complications of recurrence of neovascularization in trabeculectomy combined with anti-VEGF and trabeculectomy alone for neovascular glaucoma. The forest plot shows the meta-analysis results of the data on postoperative complications of recurrence of neovascularization from the included studies. The horizontal lines represent the 95% CI. The diamonds represent the pooled RR and its 95% CI.
Figure 16.
Figure 16.
Comparison of total postoperative complications between trabeculectomy combined with anti-VEGF and trabeculectomy alone in neovascular glaucoma. A meta-analysis of the total number of postoperative complications reported in the included studies was performed. The figure shows the RR and its 95% CI for each study (squares and horizontal lines) and the pooled RR and its 95% CI (diamond). The pooled estimate indicates a significant difference in the total number of complications between the two groups, with trabeculectomy augmented by anti-VEGF agents having a lower incidence than trabeculectomy alone.
Figure 17.
Figure 17.
Meta-analysis of the effect of trabeculectomy combined with anti-VEGF and trabeculectomy alone on the surgical success rate for neovascular glaucoma. The RR and 95% CI were calculated for each study and pooled using a random-effects model. The figure shows the RR and its 95% CI for each study (squares and horizontal lines) and the pooled RR and its 95% CI (diamond). The pooled estimate indicates a significant difference in the surgical success rate between the two groups, with trabeculectomy augmented by anti-VEGF having a higher rate than trabeculectomy alone.
Figure 18.
Figure 18.
Publication bias analysis of the included studies. The funnel plots of the SMD or the RR were used to assess the publication bias for postoperative IOP (A), success rate (B), and total complications (C), respectively. The Begg and Egger methods were applied to test the asymmetry of the funnel plots. No significant publication bias was detected. OR, odds ratio.

Similar articles

Cited by

References

    1. Rodrigues GB, Abe RY, Zangalli C, et al. .. Neovascular glaucoma: a review. Int J Retina Vitreous. 2016; 2: 26. - PMC - PubMed
    1. Senthil S, Dada T, Das T, et al. .. Neovascular glaucoma—a review. Indian J Ophthalmol. 2021; 69: 525–534. - PMC - PubMed
    1. Shazly TA, Latina MA.. Neovascular glaucoma: etiology, diagnosis and prognosis. Semin Ophthalmol. 2009; 24: 113–121. - PubMed
    1. Havens SJ, Gulati V. Neovascular glaucoma. Dev Ophthalmol. 2016; 55: 196–204. - PMC - PubMed
    1. Hayreh SS. Neovascular glaucoma. Prog Retin Eye Res. 2007; 26: 470–485. - PMC - PubMed

Publication types