. 2023 Sep 1;64(12):33.
doi: 10.1167/iovs.64.12.33.

ABCA4 Variant c.5714+5G>A in Trans With Null Alleles Results in Primary RPE Damage

Affiliations

ABCA4 Variant c.5714+5G>A in Trans With Null Alleles Results in Primary RPE Damage

Jana Sajovic et al. Invest Ophthalmol Vis Sci. .

Abstract

Purpose: To determine the disease pathogenesis associated with the frequent ABCA4 variant c.5714+5G>A (p.[=,Glu1863Leufs*33]).

Methods: Patient-derived photoreceptor precursor cells were generated to analyze the effect of c.5714+5G>A on splicing and perform a quantitative analysis of c.5714+5G>A products. Patients with c.5714+5G>A in trans with a null allele (i.e., c.5714+5G>A patients; n = 7) were compared with patients with two null alleles (i.e., double null patients; n = 11); with a special attention to the degree of RPE atrophy (area of definitely decreased autofluorescence and the degree of photoreceptor impairment (outer nuclear layer thickness and pattern electroretinography amplitude).

Results: RT-PCR of mRNA from patient-derived photoreceptor precursor cells showed exon 40 and exon 39/40 deletion products, as well as the normal transcript. Quantification of products showed 52.4% normal and 47.6% mutant ABCA4 mRNA. Clinically, c.5714+5G>A patients displayed significantly better structural and functional preservation of photoreceptors (thicker outer nuclear layer, presence of tubulations, higher pattern electroretinography amplitude) than double null patients with similar degrees of RPE loss, whereas double null patients exhibited signs of extensive photoreceptor ,damage even in the areas with preserved RPE.

Conclusions: The prototypical STGD1 sequence of events of primary RPE and secondary photoreceptor damage is congruous with c.5714+5G>A, but not the double null genotype, which implies different and genotype-dependent disease mechanisms. We hypothesize that the relative photoreceptor sparing in c.5714+5G>A patients results from the remaining function of the ABCA4 transporter originating from the normally spliced product, possibly by decreasing the direct bisretinoid toxicity on photoreceptor membranes.


Conflict of interest statement

Disclosure: J. Sajovic, None; A. Meglič, None; Z. Corradi, None; M. Khan, None; A. Maver, None; M.J. Vidmar, None; M. Hawlina, None; F.P.M. Cremers, None; A. Fakin, None

Figures

Figure 1.
Figure 1.
Analyzed retinal area. Schematic representation of the area of the retina imaged using 30° FAF imaging (for assessing RPE damage) and SD-OCT (for assessing photoreceptor damage) (A) and stimulated when performing PERG (for assessing photoreceptor function) (B).
Figure 2.
Figure 2.
Gel image. PPCs enabled RNA analysis of the noncanonical splice site (NCSS) variant c.5714+5G>A. Control PPCs and PPCs from a patient with STGD1 were cultured without (–) or with (+) CHX that suppresses nonsense-mediated decay (NMD) owing to protein-truncating variants. RT-PCR using primers targeting exons 38 and 44 showed a 779-bp WT fragment, a 655-bp fragment corresponding with an exon 40 skipping, and a fragment of 525 bp corresponding with a combination of exon 39 and 40 skipping. The WT fragment band could be derived either from c.4539+1G>T allele, as NMD is incomplete, or from the correctly spliced product of the c.5714+5G>A allele. MQ, Milli-Q water; ∆, deletion.
Figure 3.
Figure 3.
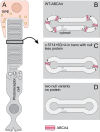
Schematic representation of the effect of the c.5714+5G>A allele. (A) RPE and photoreceptor cell with a black rectangle delineating an outer segment disc. (B) Normal number of ABCA4 transporters in a healthy person (C). Decreased number of ABCA4 transporters in a c.5714+5G>A patient. (D) Absence of ABCA4 transporters in a double null patient.
Figure 4.
Figure 4.
Outer nuclear tubulations. Tubulations in a c.5714+5G>A patient. Note the preserved RPE and photoreceptors layers (A), which transformed into photoreceptors grouping over the degenerating RPE in the period of 3 years (B). Scale bars, 200 µm.
Figure 5.
Figure 5.
Boxplot charts showing differences between the two patient groups in the age of onset (A), VA (B), ONL thickness (C), and DDAF area (D). Horizontal lines represent median values, boxes half of the data and whiskers the remaining data except in the case of the outliers (stars). The c.5714+5G>A patients had significantly later age of onset, significantly better VA, thicker ONL and smaller DDAF areas than double null patients. (D) Representative FAF images of two pairs of similarly-aged patients from the two groups, shown on the left and right sides with their approximate position in the boxplot marked with arrows. Scale bars, 200 µm.
Figure 6.
Figure 6.
Boxplot charts showing the amplitudes of different ERG parameters in the two patient groups (AF). Horizontal lines represent median values, boxes half of the data and whiskers the remaining data except in the case of the outliers (stars). Values were considered abnormal if they fell outside our laboratory normal range (marked with red dashed line). Note that, even though c.5714+5G>A patients were the same age or even older than double null patients, all their ERG responses were significantly better preserved, often within normal range.
Figure 7.
Figure 7.
Kaplan–Meier survival analysis showing the ratio of patients reaching legal blindness (≥1.0 logMAR).
Figure 8.
Figure 8.
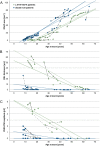
Longitudinal analysis of DDAF area (A), ONL thickness (B), and PERG P50 amplitude (C). Data points from individual patients are connected with dashed interpolation lines. The two solid fit lines are drawn using the data from exams around the last ERG testing. Dashed lines are drawn using the data from exams around the first ERG testing. The green represents the c.5714+5G>A patients and blue represents the double null patients. (A) Note a similar slope of DDAF enlargement, representing RPE loss, of the two groups, with an approximate delay of one decade in c.5714+5G>A patients (B, C). A greater time difference, of approximately four decades, was noted in parameters describing photoreceptors impairment.
Figure 9.
Figure 9.
Different ratios of RPE and photoreceptor impairment in c.5714+5G>A patients (marked with green) and double null patients (marked with blue). (A) Correlation between ONL thickness and DDAF area. (B) Correlation between PERG P50 amplitude and DDAF area. Longitudinal data from the same patients are noted with dashed lines. Regression lines are drawn based on the first examination. (CN) FAF, OCT scan through the fovea and PERG of representative patients with early and late stage of RPE atrophy. The individual patients are circled and marked with numbers 1 to 4 in (A) and (B). ONL is shown in orange on OCT images (D, G, J, M), and PERG P50 responses are shown in (E, H, K, N), whereas combined DDAF areas, shown in pink, are presented in (C, F, I, L). Note the relative preservation of ONL (A) and PERG P50 (B) of c.5714+5G>A patients across all DDAF sizes, most notable at the stage of minimal RPE atrophy, where double null patients already exhibited severe ONL and PERG P50 loss. In double null patients, a decreased ONL was observed even in the areas without notable RPE damage (RPE atrophy or extensive flecks) (F, G, L, M). Scale bars, 200 µm.
Figure 10.
Figure 10.
Microperimetry results superimposed over 55° FAF images in representative c.5714+5G>A patients (AC) and double null patients (DF). Fixation points, determining a preferred retinal locus, are marked with blue dots, and a retinal sensitivity map of 56 tested loci is projected around the fixation points. The sensitivity of tested loci is expressed as a color ranging from red (0 dB—poor sensitivity) to green (20 dB—good sensitivity). Patients with c.5714+5G>A fixated on the border of the central FAF lesion and demonstrated preserved photoreceptor function in those areas.

References

    1. Blacharski PA. Fundus flavimaculatus. In: Newsome DA, (ed). Retinal Dystrophies and Degenerations. New York: Raven Press; 1988: 135–159.
    1. Molday LL, Rabin AR, Molday RS.. ABCR expression in foveal cone photoreceptors and its role in Stargardt macular dystrophy. Nat Genet . 2000; 25(3): 257–258. - PubMed
    1. Illing M, Molday LL, Molday RS.. The 220-kDa rim protein of retinal rod outer segments is a member of the ABC transporter superfamily. J Biol Chem . 1997; 272(15): 10303–10310. - PubMed
    1. Sun H, Nathans J.. Stargardt's ABCR is localized to the disc membrane of retinal rod outer segments. Nat Genet . 1997; 17(1): 15–16. - PubMed
    1. Papermaster DS, Converse CA, Zorn M.. Biosynthetic and immunochemical characterization of large protein in frog and cattle rod outer segment membranes. Exp Eye Res . 1976; 23(2): 105–115. - PubMed

Publication types