

Network-Based Spreading of Gray Matter Changes Across Different Stages of Psychosis
- PMID: 37728918
- PMCID: PMC10512169
- DOI: 10.1001/jamapsychiatry.2023.3293
Network-Based Spreading of Gray Matter Changes Across Different Stages of Psychosis
Abstract
Importance: Psychotic illness is associated with anatomically distributed gray matter reductions that can worsen with illness progression, but the mechanisms underlying the specific spatial patterning of these changes is unknown.
Objective: To test the hypothesis that brain network architecture constrains cross-sectional and longitudinal gray matter alterations across different stages of psychotic illness and to identify whether certain brain regions act as putative epicenters from which volume loss spreads.
Design, settings, and participants: This case-control study included 534 individuals from 4 cohorts, spanning early and late stages of psychotic illness. Early-stage cohorts included patients with antipsychotic-naive first-episode psychosis (n = 59) and a group of patients receiving medications within 3 years of psychosis onset (n = 121). Late-stage cohorts comprised 2 independent samples of people with established schizophrenia (n = 136). Each patient group had a corresponding matched control group (n = 218). A sample of healthy adults (n = 356) was used to derive representative structural and functional brain networks for modeling of network-based spreading processes. Longitudinal illness-related and antipsychotic-related gray matter changes over 3 and 12 months were examined using a triple-blind randomized placebo-control magnetic resonance imaging study of the antipsychotic-naive patients. All data were collected between April 29, 2008, and January 15, 2020, and analyses were performed between March 1, 2021, and January 14, 2023.
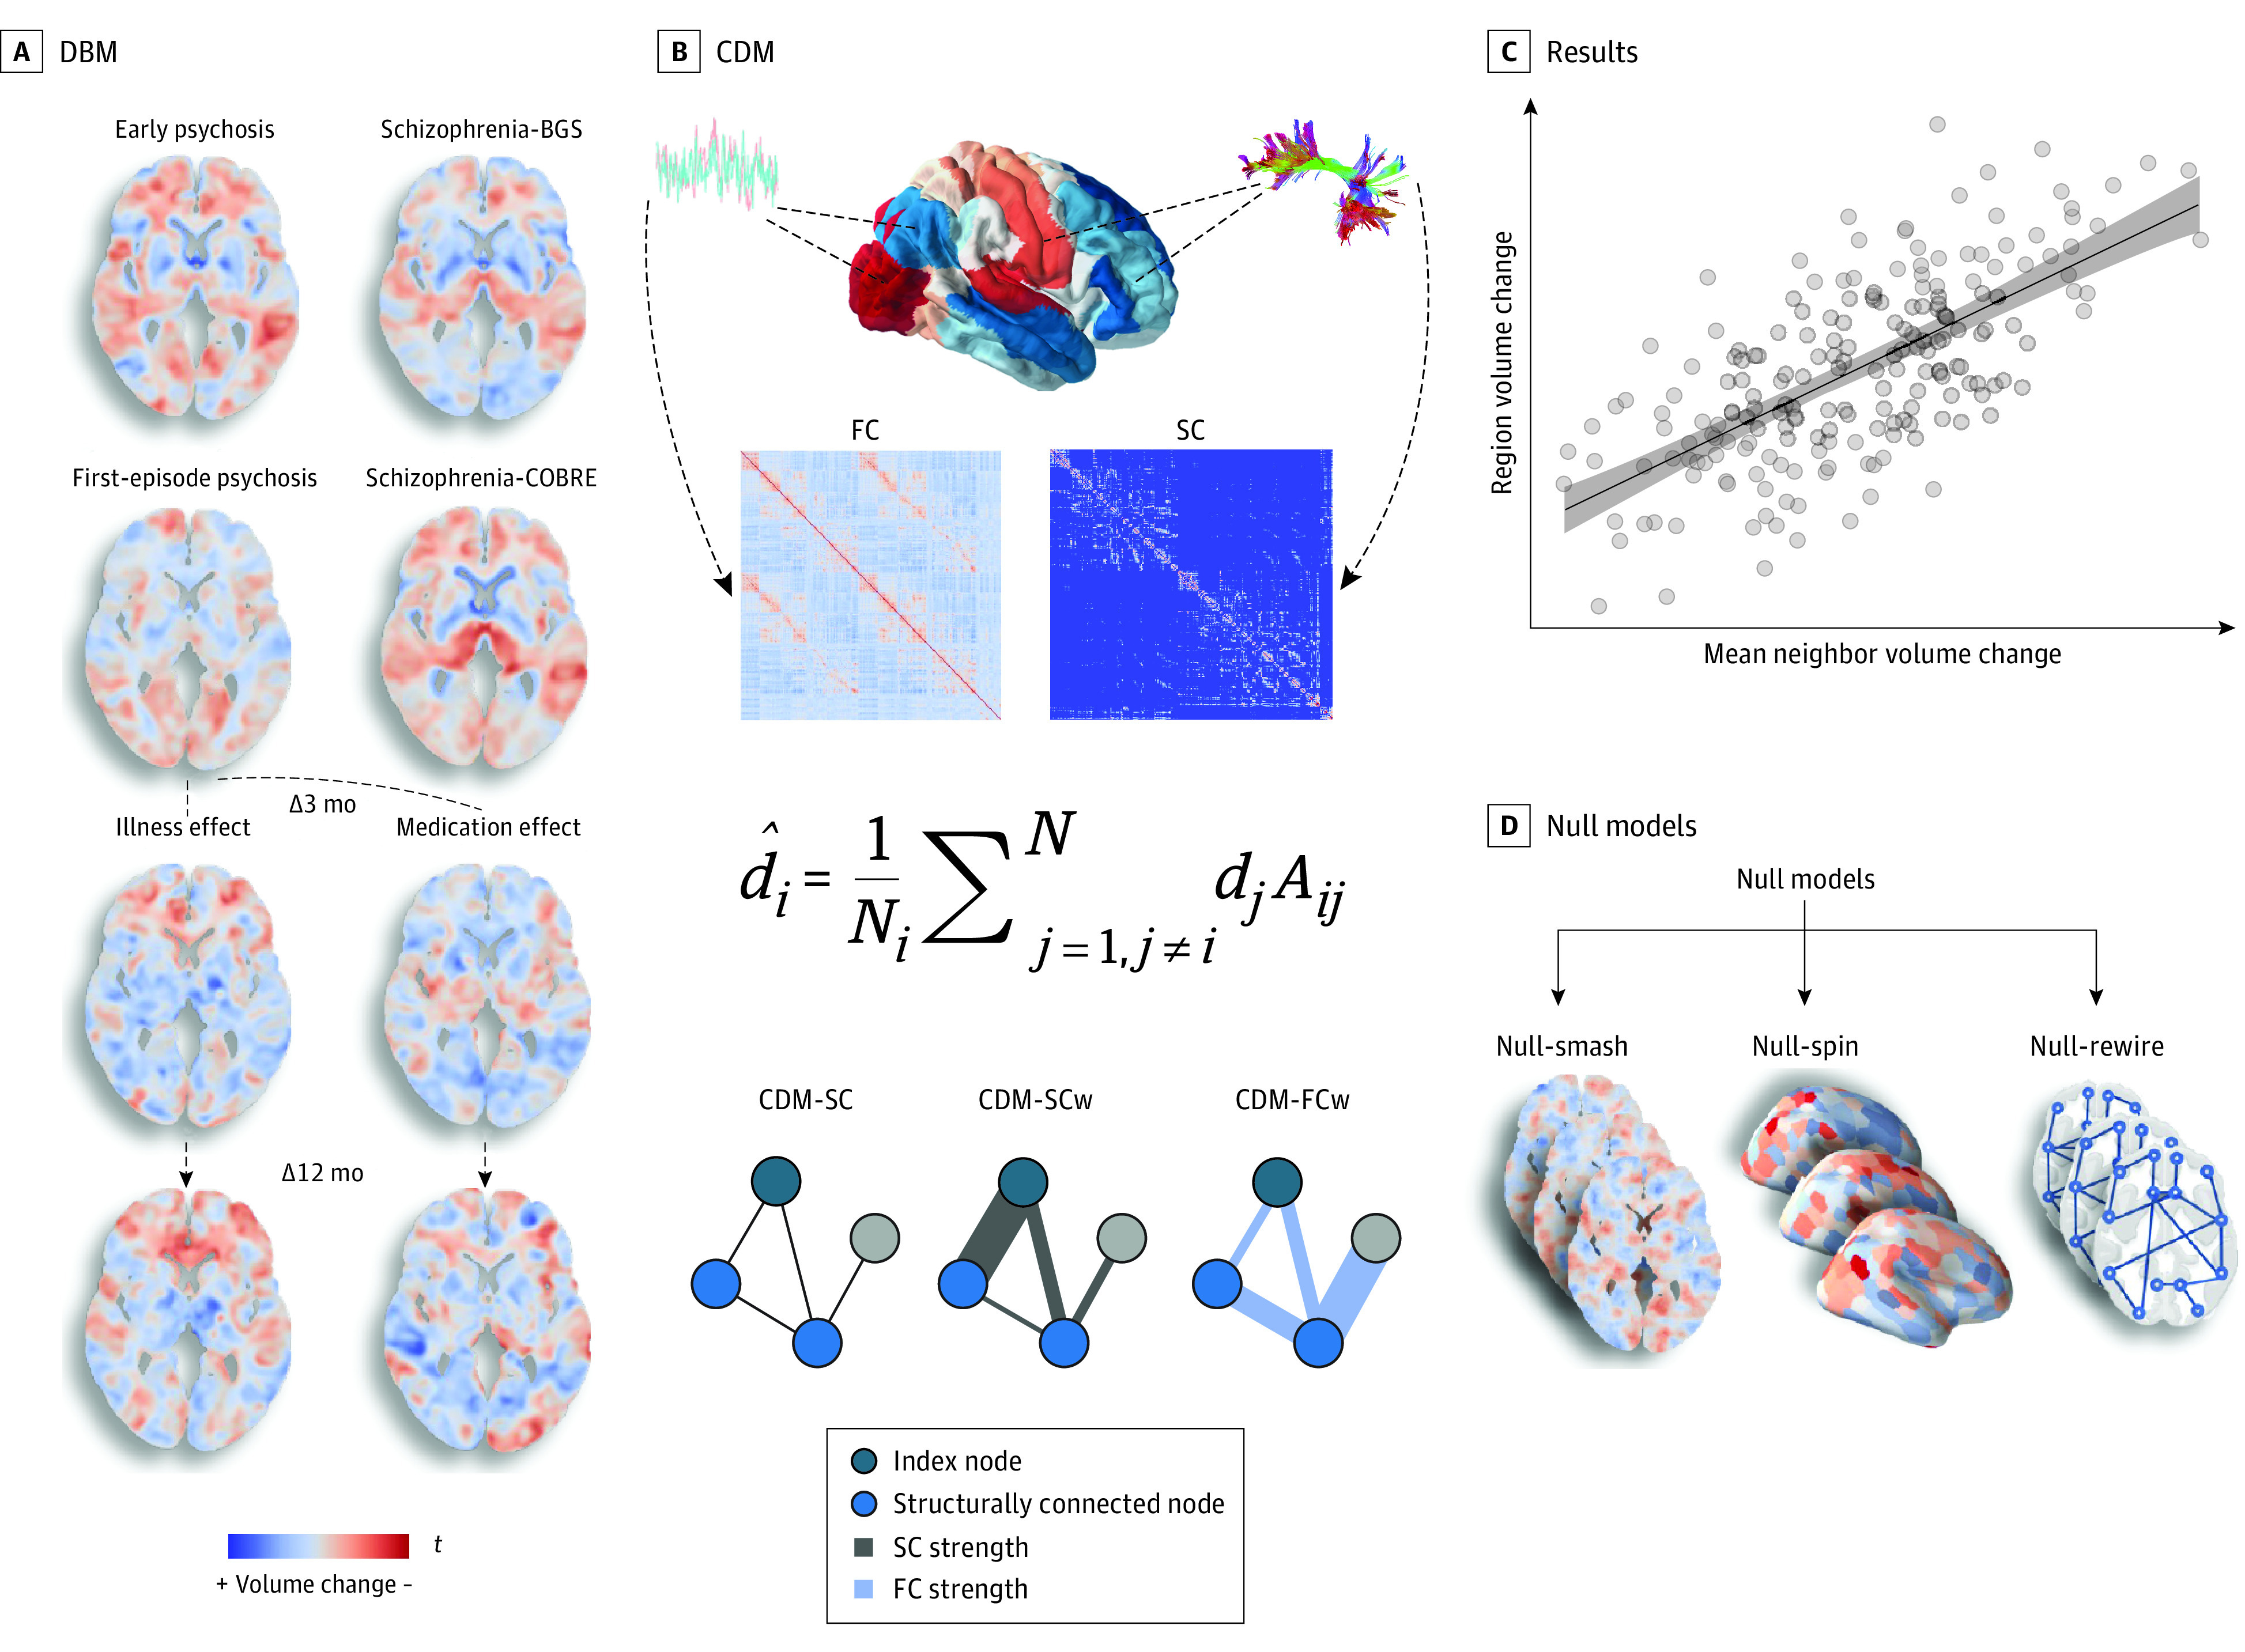
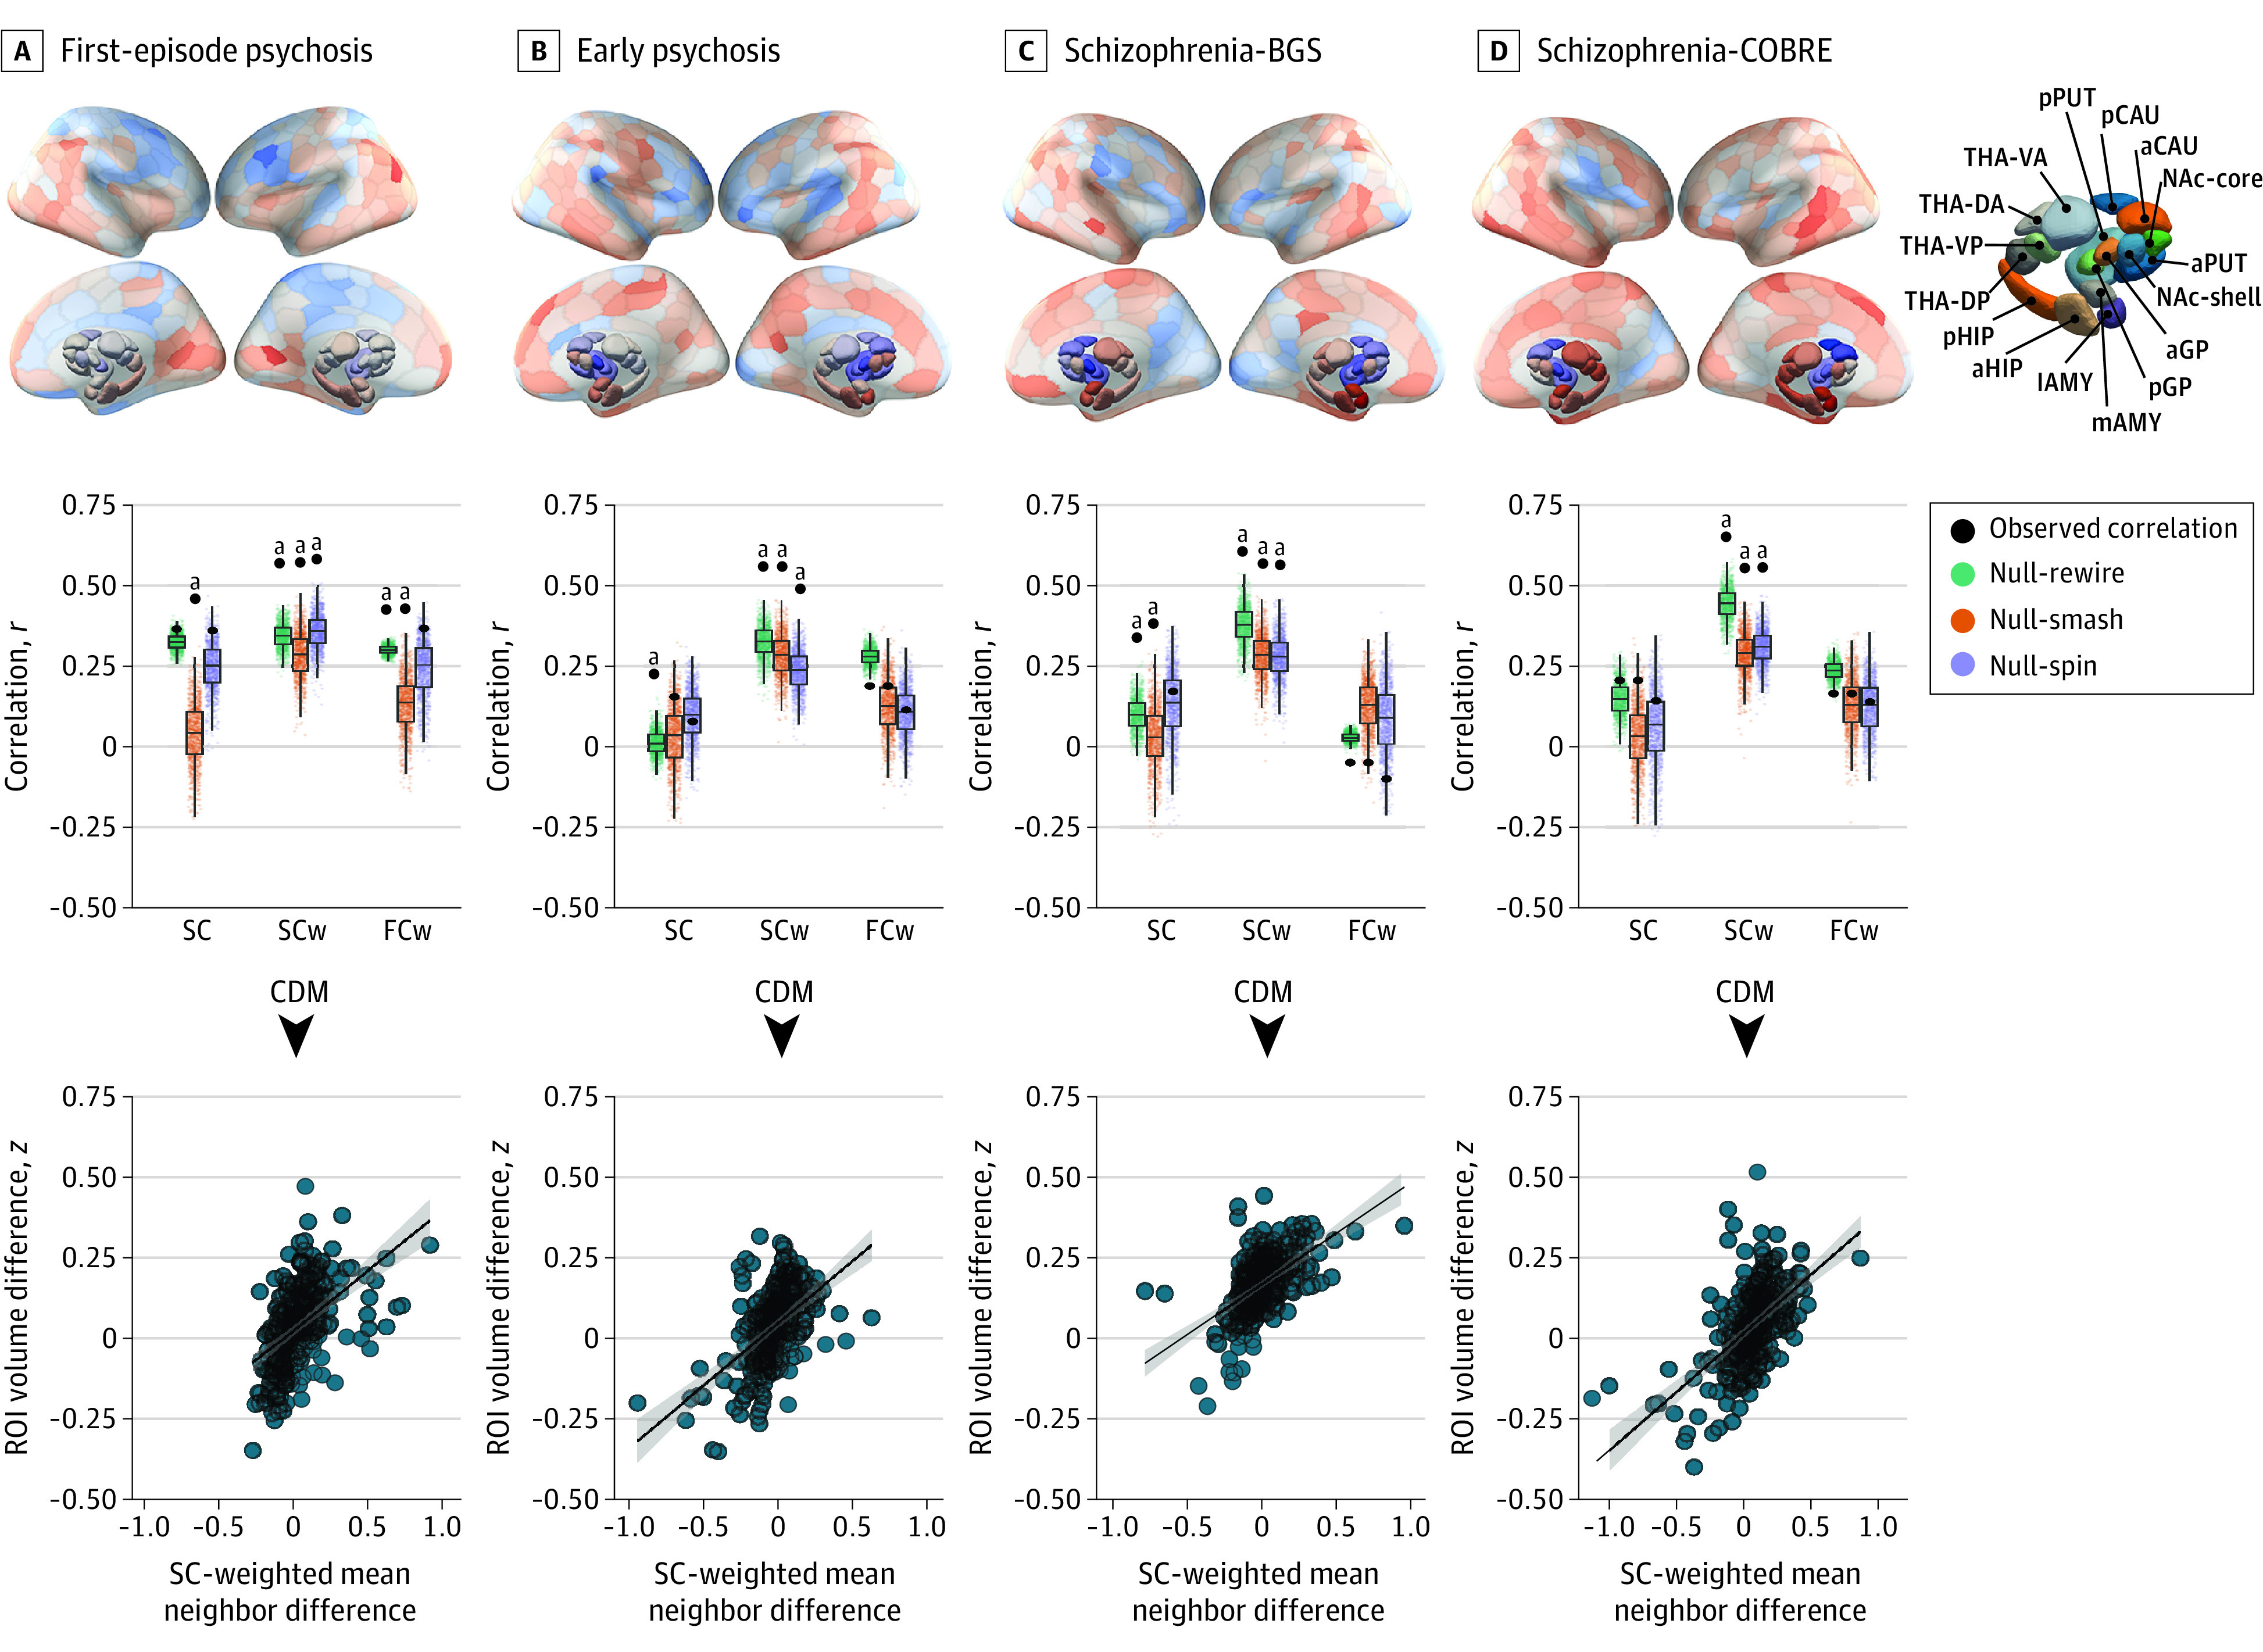
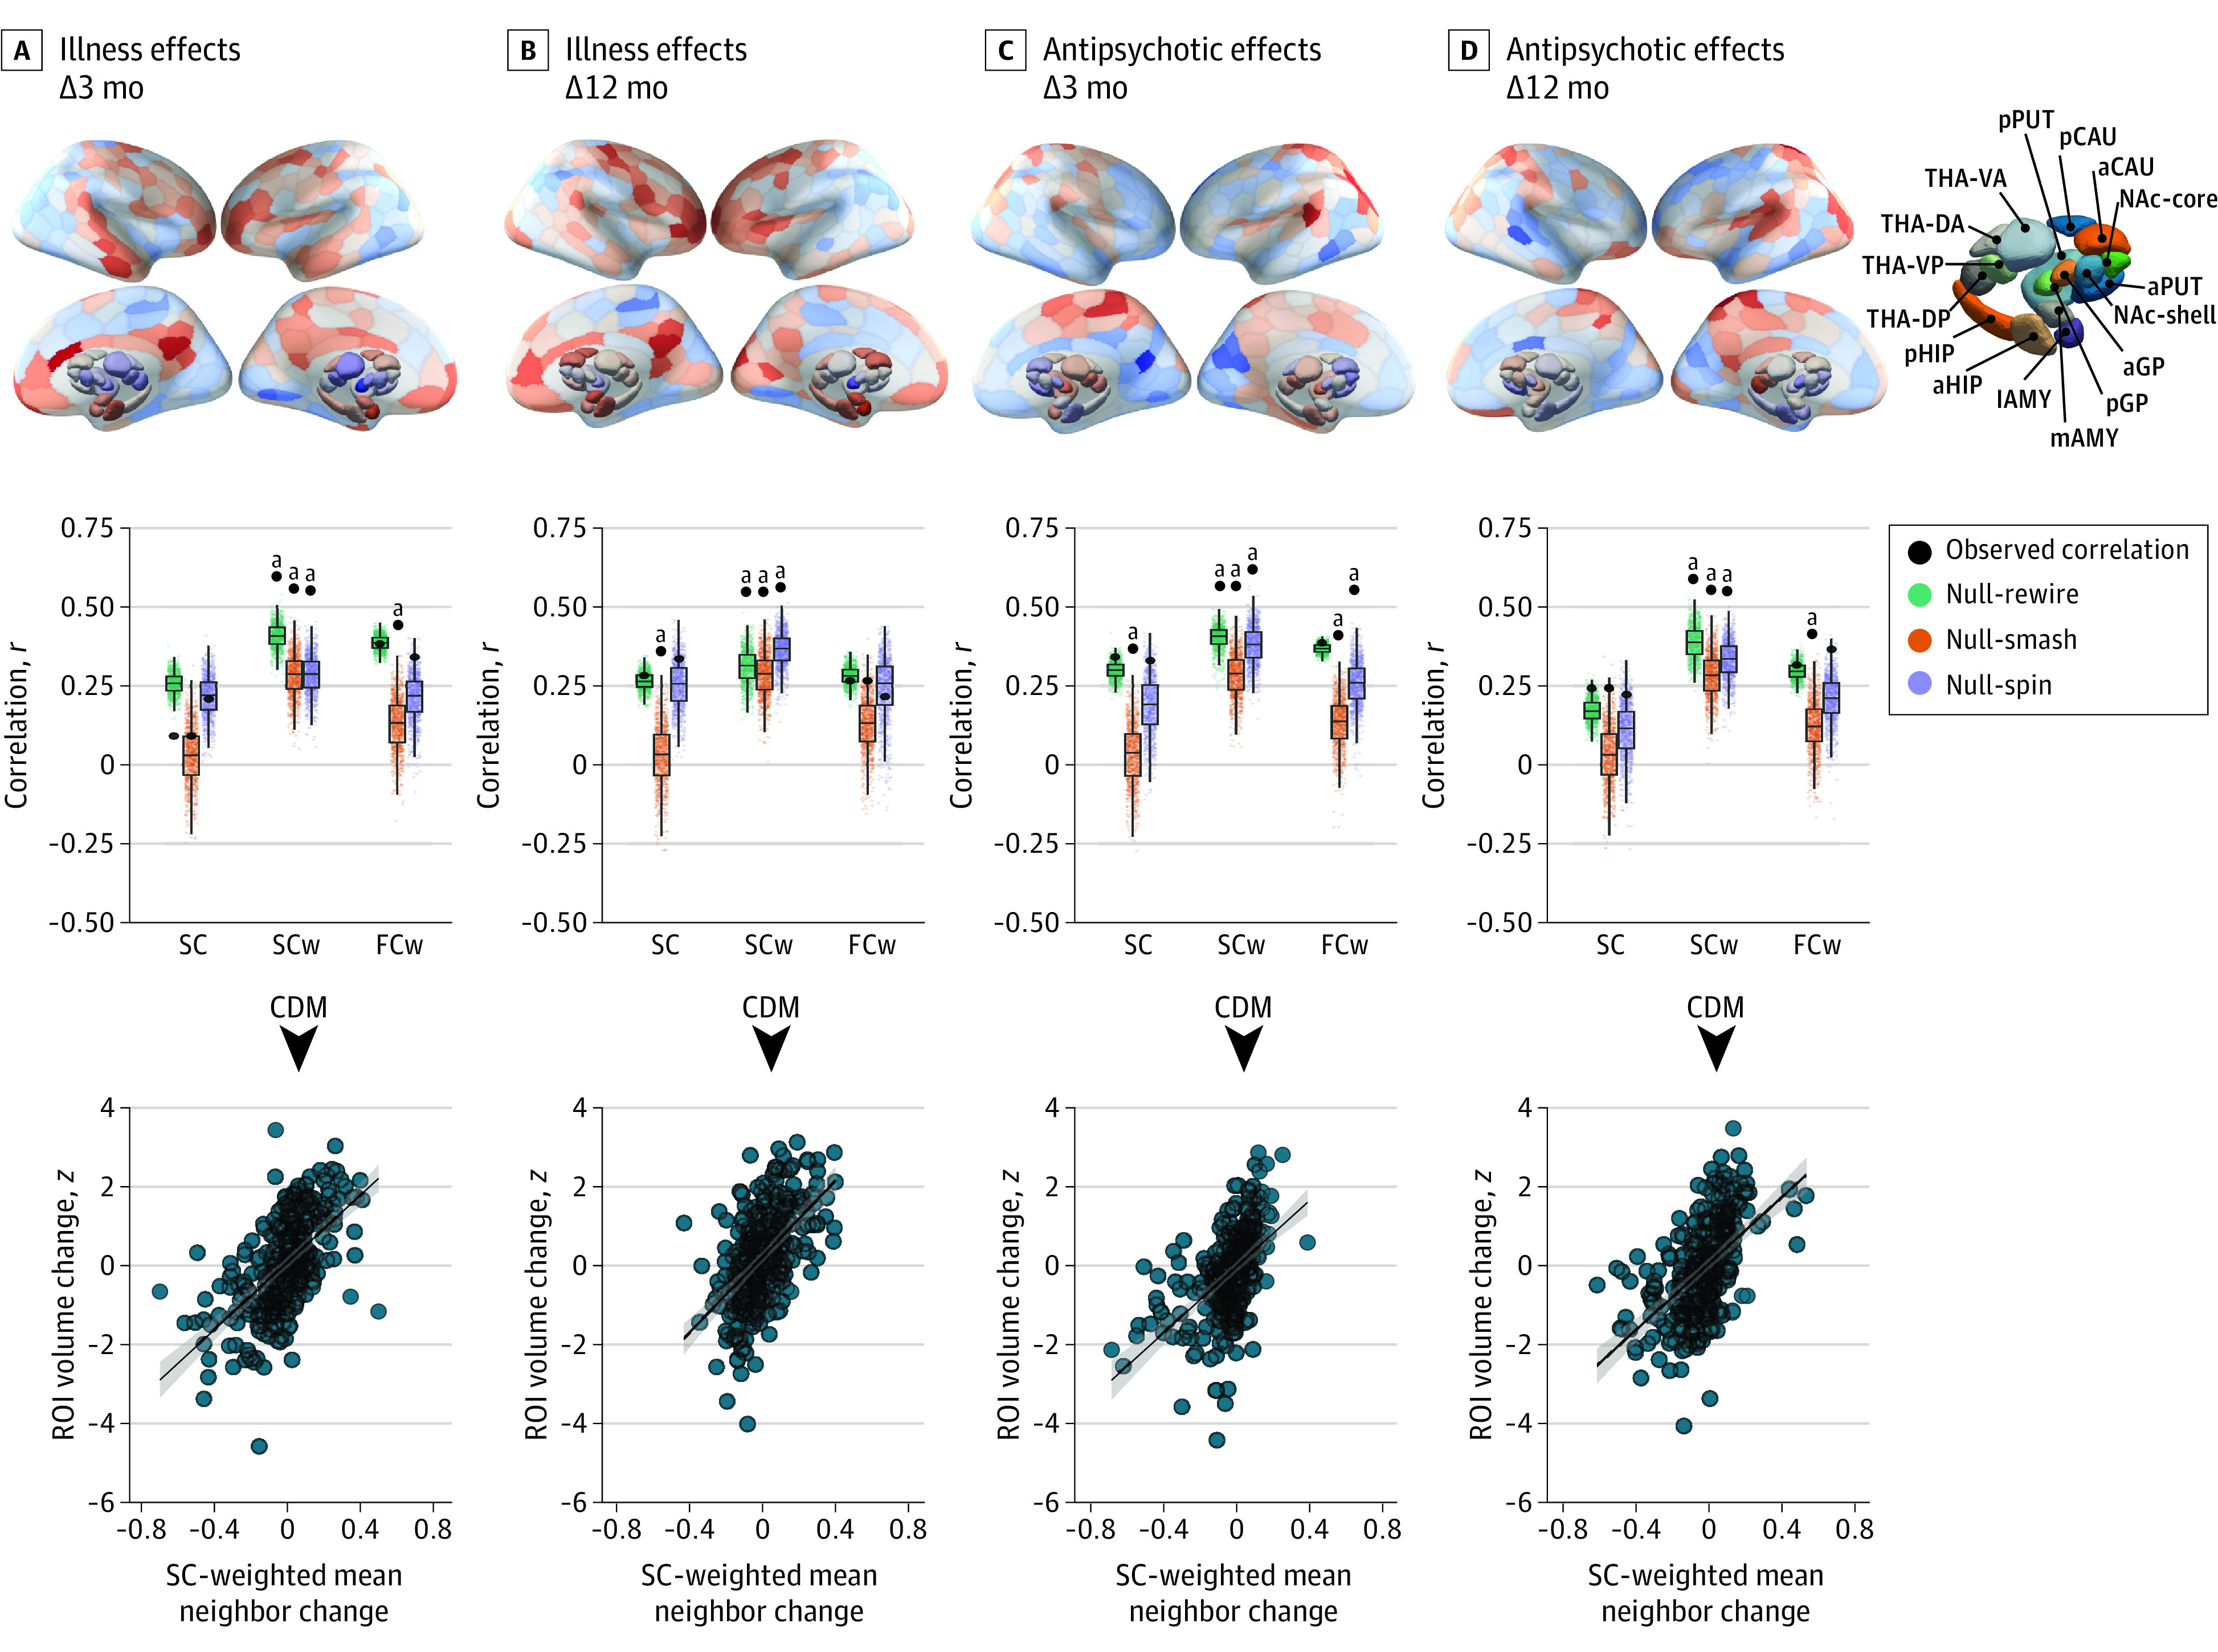
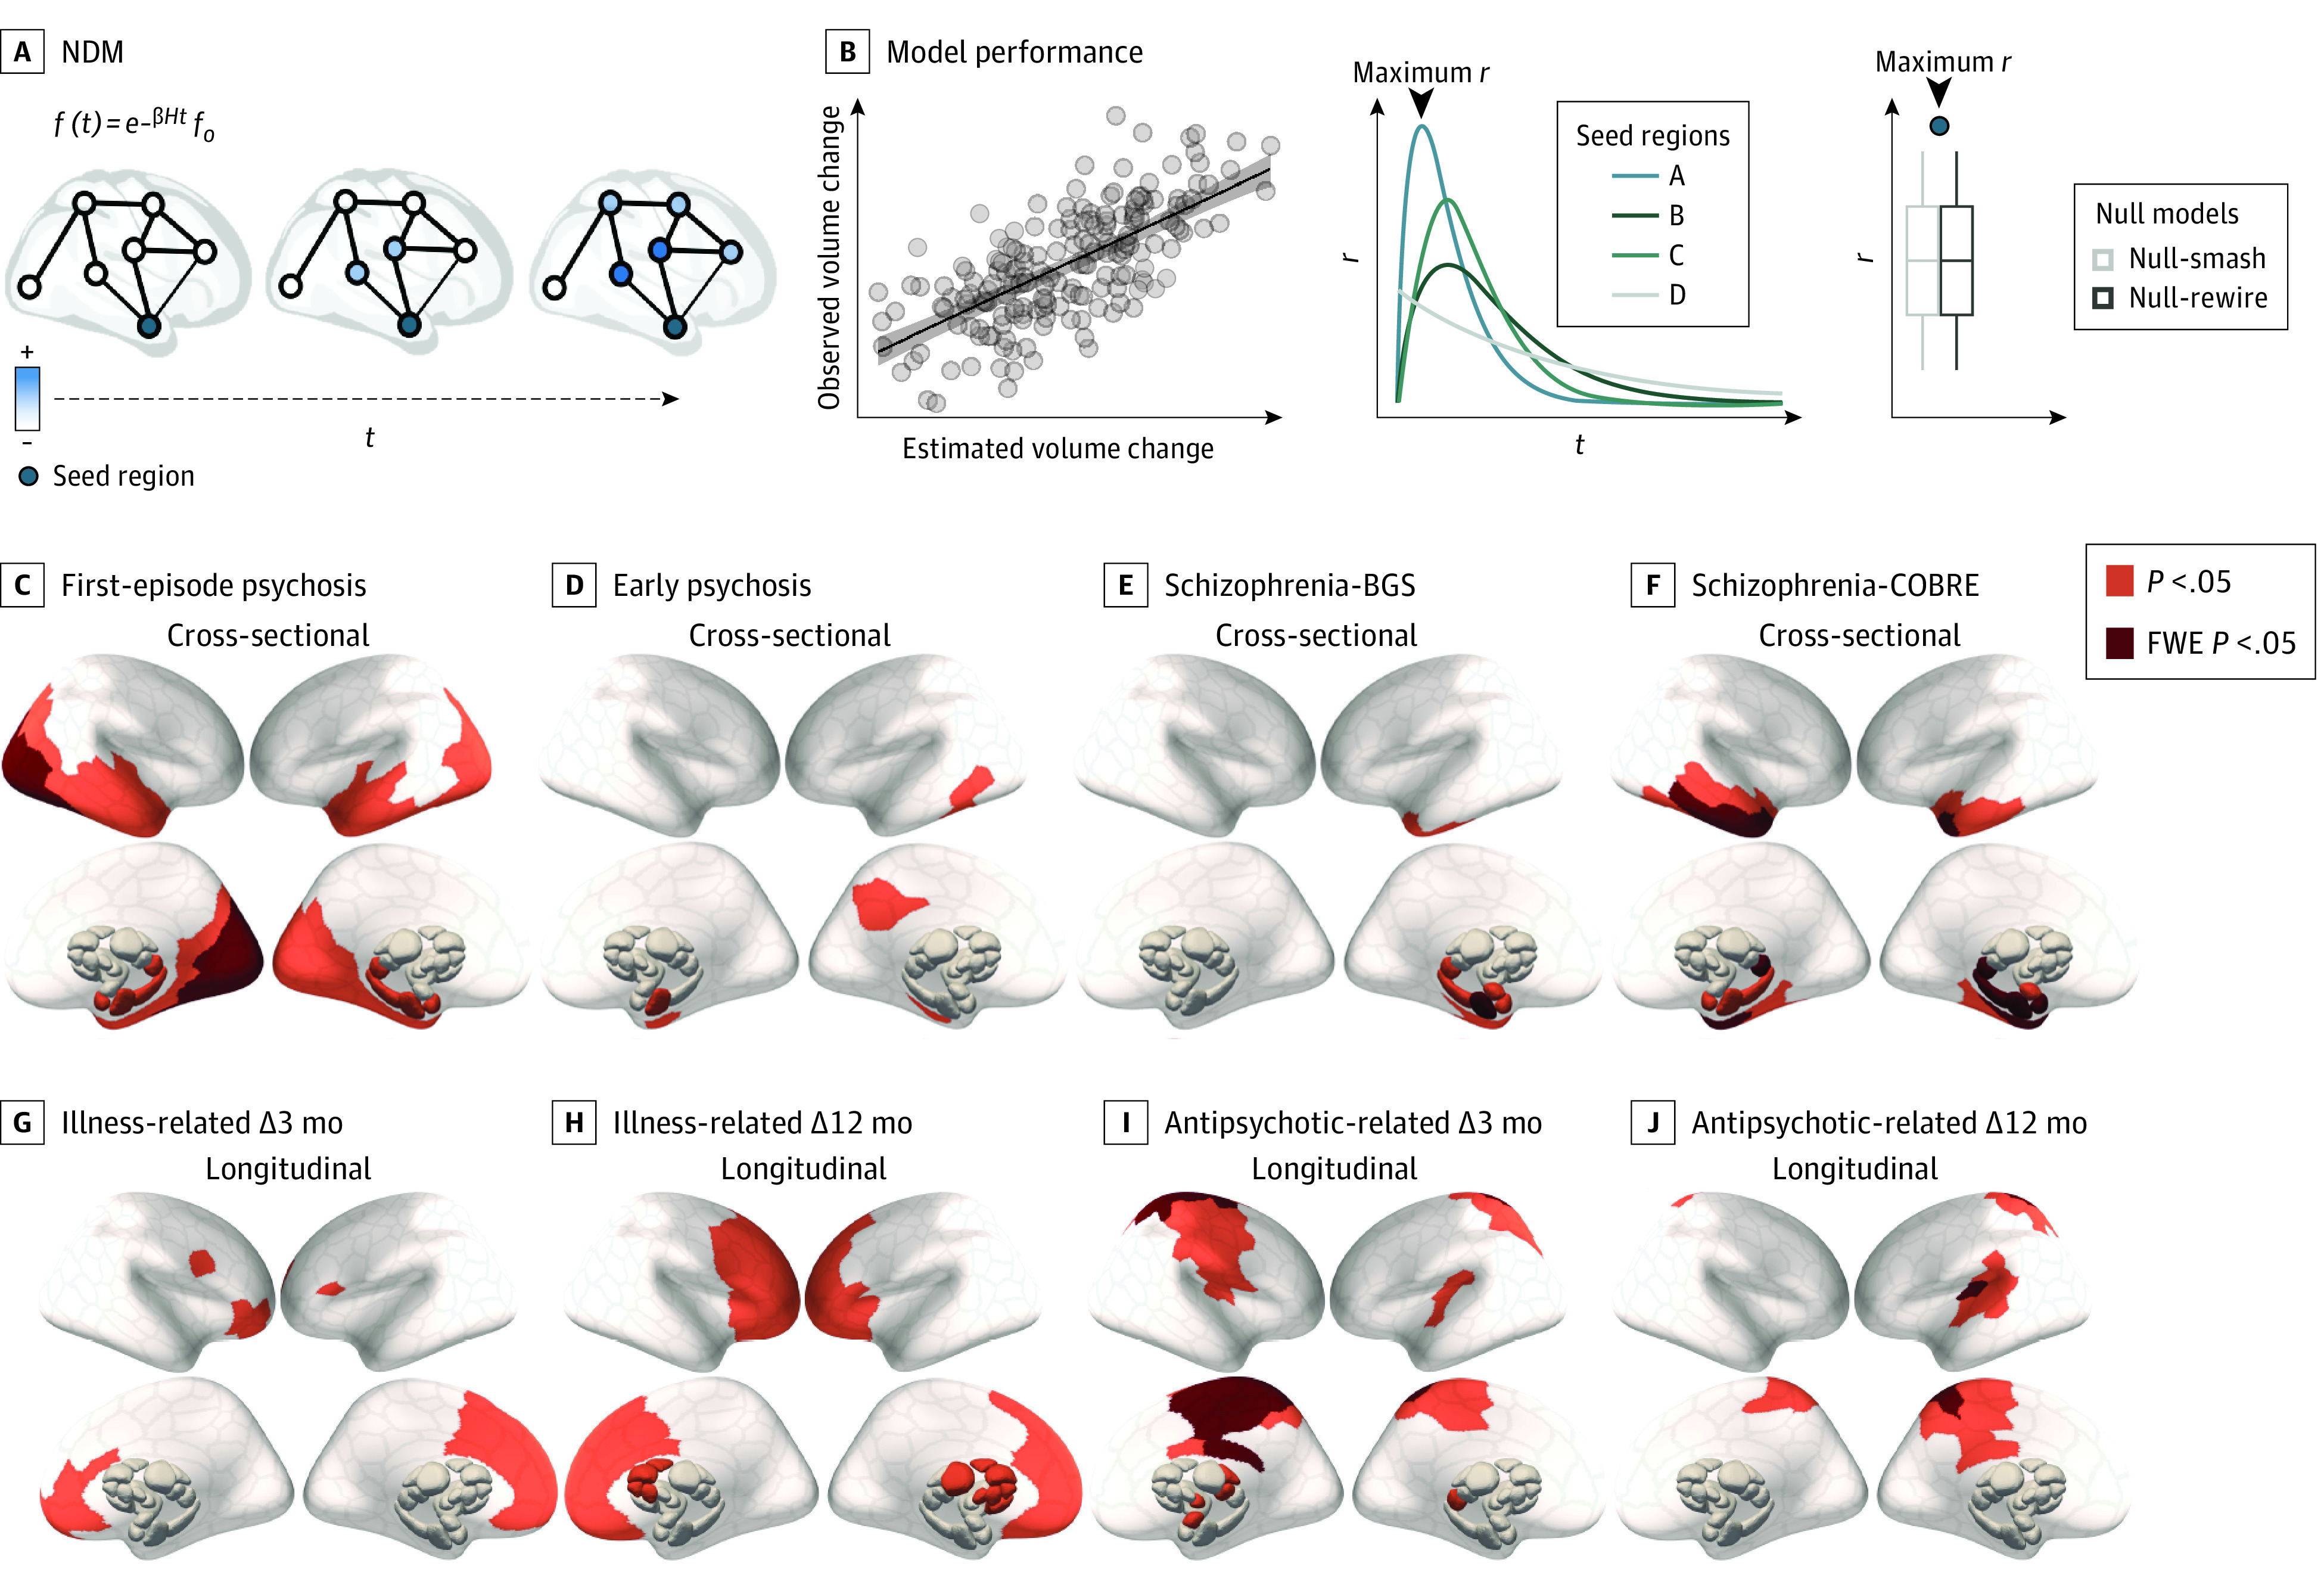
Main outcomes and measures: Coordinated deformation models were used to estimate the extent of gray matter volume (GMV) change in each of 332 parcellated areas by the volume changes observed in areas to which they were structurally or functionally coupled. To identify putative epicenters of volume loss, a network diffusion model was used to simulate the spread of pathology from different seed regions. Correlations between estimated and empirical spatial patterns of GMV alterations were used to quantify model performance.
Results: Of 534 included individuals, 354 (66.3%) were men, and the mean (SD) age was 28.4 (7.4) years. In both early and late stages of illness, spatial patterns of cross-sectional volume differences between patients and controls were more accurately estimated by coordinated deformation models constrained by structural, rather than functional, network architecture (r range, >0.46 to <0.57; P < .01). The same model also robustly estimated longitudinal volume changes related to illness (r ≥ 0.52; P < .001) and antipsychotic exposure (r ≥ 0.50; P < .004). Network diffusion modeling consistently identified, across all 4 data sets, the anterior hippocampus as a putative epicenter of pathological spread in psychosis. Epicenters of longitudinal GMV loss were apparent in posterior cortex early in the illness and shifted to the prefrontal cortex with illness progression.
Conclusion and relevance: These findings highlight a central role for white matter fibers as conduits for the spread of pathology across different stages of psychotic illness, mirroring findings reported in neurodegenerative conditions. The structural connectome thus represents a fundamental constraint on brain changes in psychosis, regardless of whether these changes are caused by illness or medication. Moreover, the anterior hippocampus represents a putative epicenter of early brain pathology from which dysfunction may spread to affect connected areas.
Conflict of interest statement
Figures
Similar articles
-
Functional Connectivity in Antipsychotic-Treated and Antipsychotic-Naive Patients With First-Episode Psychosis and Low Risk of Self-harm or Aggression: A Secondary Analysis of a Randomized Clinical Trial.JAMA Psychiatry. 2021 Sep 1;78(9):994-1004. doi: 10.1001/jamapsychiatry.2021.1422. JAMA Psychiatry. 2021. PMID: 34160595 Free PMC article. Clinical Trial.
-
Connectome architecture for gray matter atrophy and surgical outcomes in temporal lobe epilepsy.Epilepsia. 2025 Jun;66(6):2053-2065. doi: 10.1111/epi.18343. Epub 2025 Mar 8. Epilepsia. 2025. PMID: 40056026
-
Hippocampal and amygdala volumes according to psychosis stage and diagnosis: a magnetic resonance imaging study of chronic schizophrenia, first-episode psychosis, and ultra-high-risk individuals.Arch Gen Psychiatry. 2006 Feb;63(2):139-49. doi: 10.1001/archpsyc.63.2.139. Arch Gen Psychiatry. 2006. PMID: 16461856
-
Structural brain changes in schizophrenia at different stages of the illness: A selective review of longitudinal magnetic resonance imaging studies.Aust N Z J Psychiatry. 2017 May;51(5):500-508. doi: 10.1177/0004867417699473. Epub 2017 Mar 21. Aust N Z J Psychiatry. 2017. PMID: 28415873 Review.
-
Cortical and Subcortical Gray Matter Volume in Youths With Conduct Problems: A Meta-analysis.JAMA Psychiatry. 2016 Jan;73(1):64-72. doi: 10.1001/jamapsychiatry.2015.2423. JAMA Psychiatry. 2016. PMID: 26650724 Review.
Cited by
-
Elevated Extracellular Free Water in the Brain Predicts Clinical Improvement in First-Episode Psychosis.Biol Psychiatry Cogn Neurosci Neuroimaging. 2025 Jan;10(1):111-119. doi: 10.1016/j.bpsc.2024.09.014. Epub 2024 Oct 9. Biol Psychiatry Cogn Neurosci Neuroimaging. 2025. PMID: 39383994
-
Embracing variability in the search for biological mechanisms of psychiatric illness.Trends Cogn Sci. 2025 Jan;29(1):85-99. doi: 10.1016/j.tics.2024.09.010. Epub 2024 Nov 6. Trends Cogn Sci. 2025. PMID: 39510933 Review.
-
White matter integrity of default mode network after a 3-month aerobic dance program in patients with amnestic mild cognitive impairment: a secondary analysis of a randomized clinical trial.Quant Imaging Med Surg. 2025 Mar 3;15(3):2016-2028. doi: 10.21037/qims-24-1212. Epub 2025 Feb 26. Quant Imaging Med Surg. 2025. PMID: 40160635 Free PMC article.
-
Schizophrenia pathology reverse-translated into mouse shows hippocampal hyperactivity, psychosis behaviors and hyper-synchronous events.Mol Psychiatry. 2025 May;30(5):1746-1757. doi: 10.1038/s41380-024-02781-5. Epub 2024 Oct 16. Mol Psychiatry. 2025. PMID: 39407000 Free PMC article.
-
Brain network dynamics reflect psychiatric illness status and transdiagnostic symptom profiles across health and disease.bioRxiv [Preprint]. 2025 May 28:2025.05.23.655864. doi: 10.1101/2025.05.23.655864. bioRxiv. 2025. PMID: 40502066 Free PMC article. Preprint.
References
-
- van Erp TGM, Walton E, Hibar DP, et al. ; Karolinska Schizophrenia Project . Cortical brain abnormalities in 4474 individuals with schizophrenia and 5098 control subjects via the Enhancing Neuro Imaging Genetics Through Meta Analysis (ENIGMA) Consortium. Biol Psychiatry. 2018;84(9):644-654. doi:10.1016/j.biopsych.2018.04.023 - DOI - PMC - PubMed
Publication types
MeSH terms
Substances
LinkOut - more resources
Full Text Sources
Medical
Miscellaneous
