

Analyzing and Forecasting Pediatric Fever Clinic Visits in High Frequency Using Ensemble Time-Series Methods After the COVID-19 Pandemic in Hangzhou, China: Retrospective Study
- PMID: 37728972
- PMCID: PMC10551790
- DOI: 10.2196/45846
Analyzing and Forecasting Pediatric Fever Clinic Visits in High Frequency Using Ensemble Time-Series Methods After the COVID-19 Pandemic in Hangzhou, China: Retrospective Study
Abstract
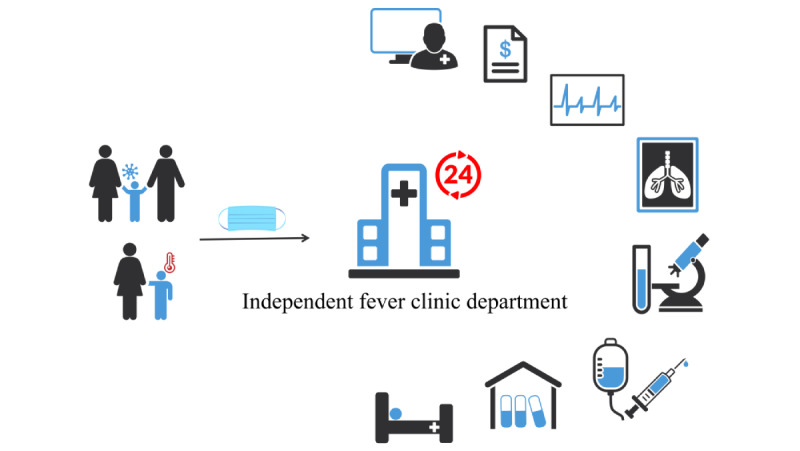
Background: The COVID-19 pandemic has significantly altered the global health and medical landscape. In response to the outbreak, Chinese hospitals have established 24-hour fever clinics to serve patients with COVID-19. The emergence of these clinics and the impact of successive epidemics have led to a surge in visits, placing pressure on hospital resource allocation and scheduling. Therefore, accurate prediction of outpatient visits is essential for informed decision-making in hospital management.
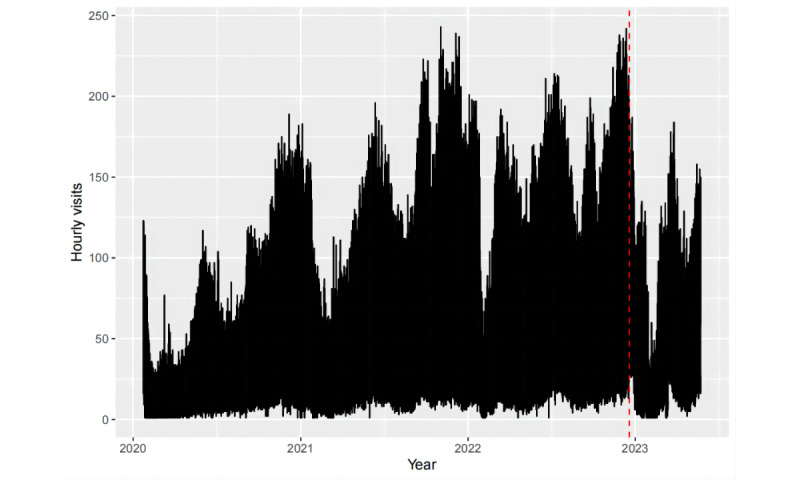
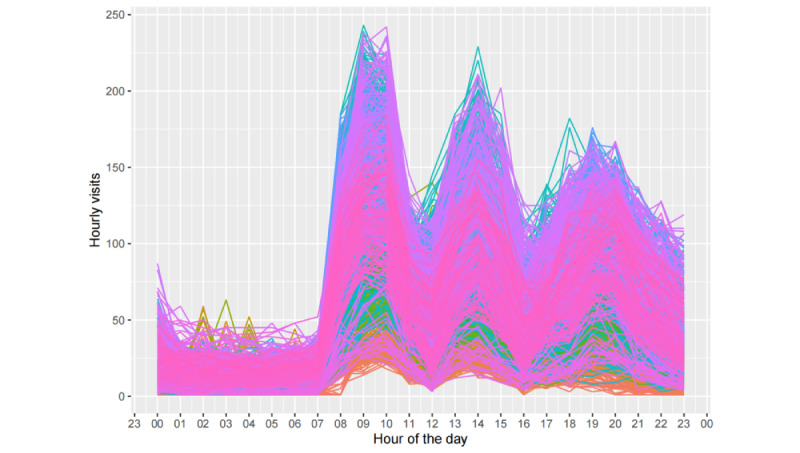
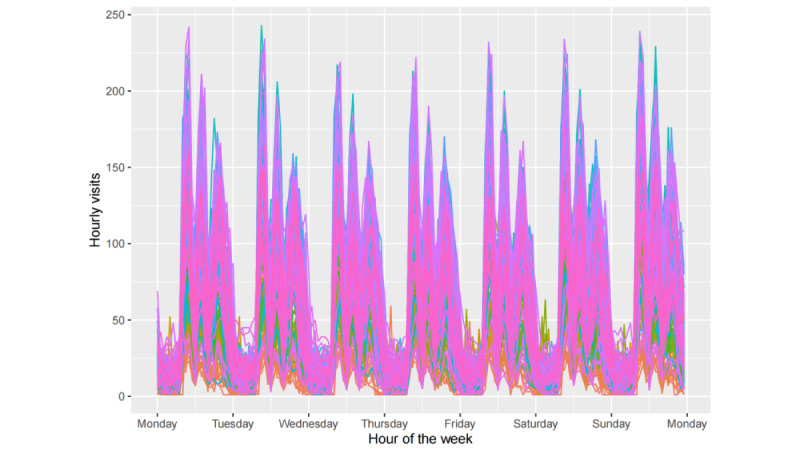
Objective: Hourly visits to fever clinics can be characterized as a long-sequence time series in high frequency, which also exhibits distinct patterns due to the particularity of pediatric treatment behavior in an epidemic context. This study aimed to build models to forecast fever clinic visit with outstanding prediction accuracy and robust generalization in forecast horizons. In addition, this study hopes to provide a research paradigm for time-series forecasting problems, which involves an exploratory analysis revealing data patterns before model development.
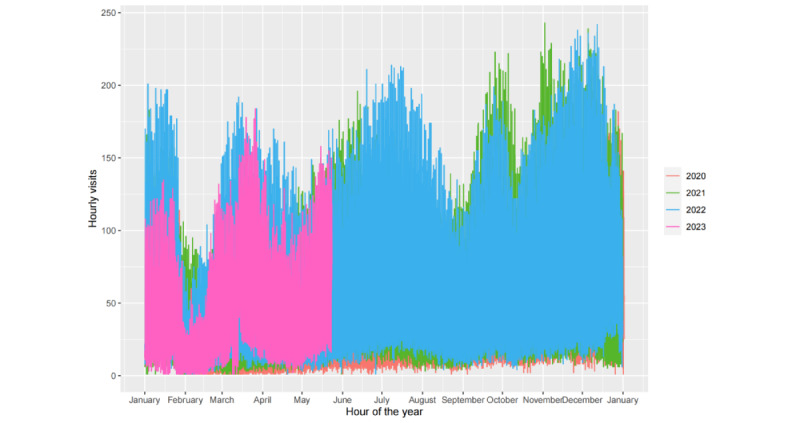
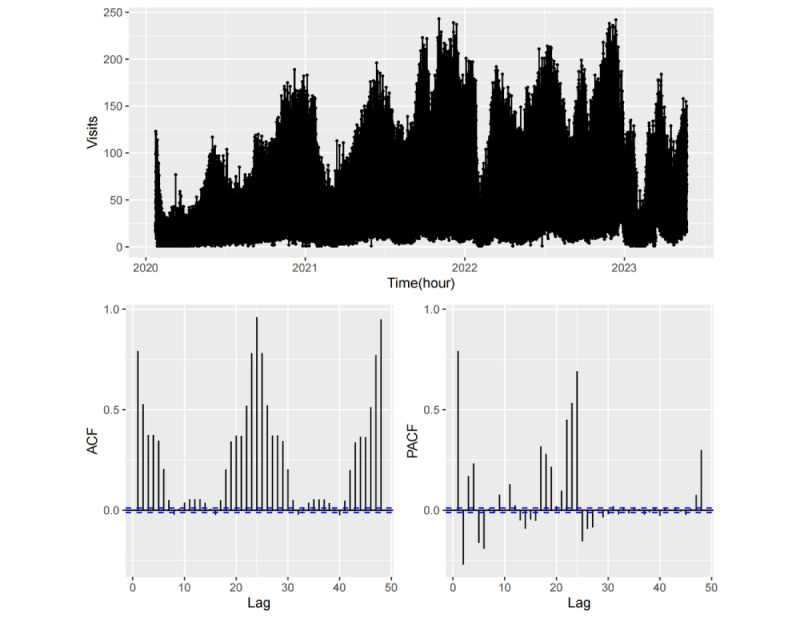
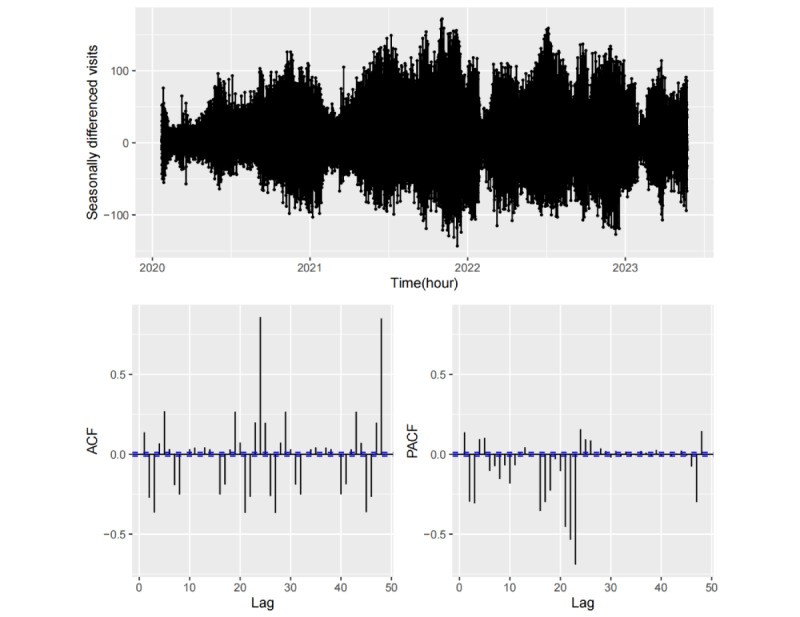
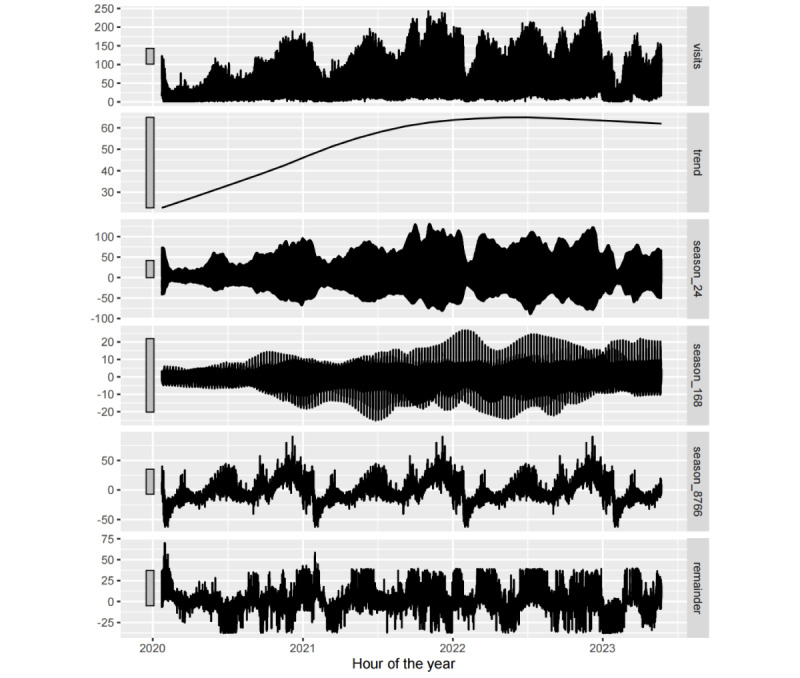
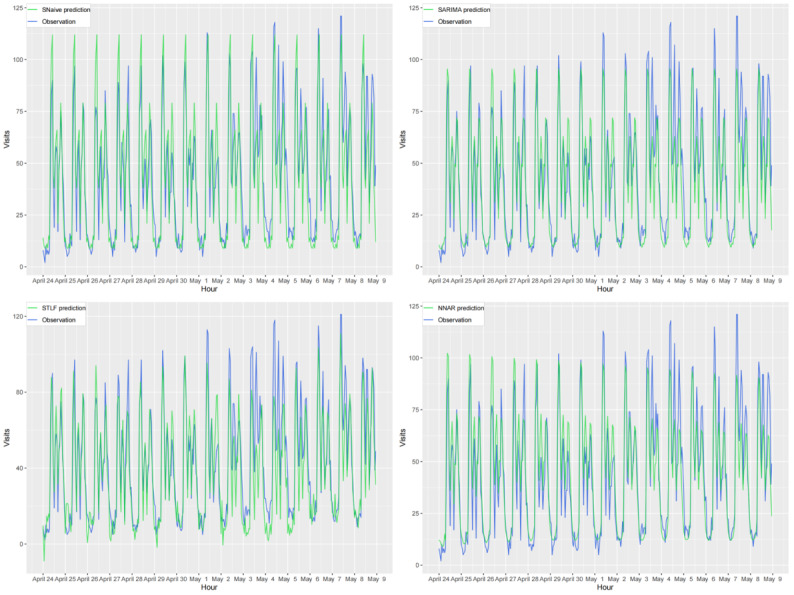
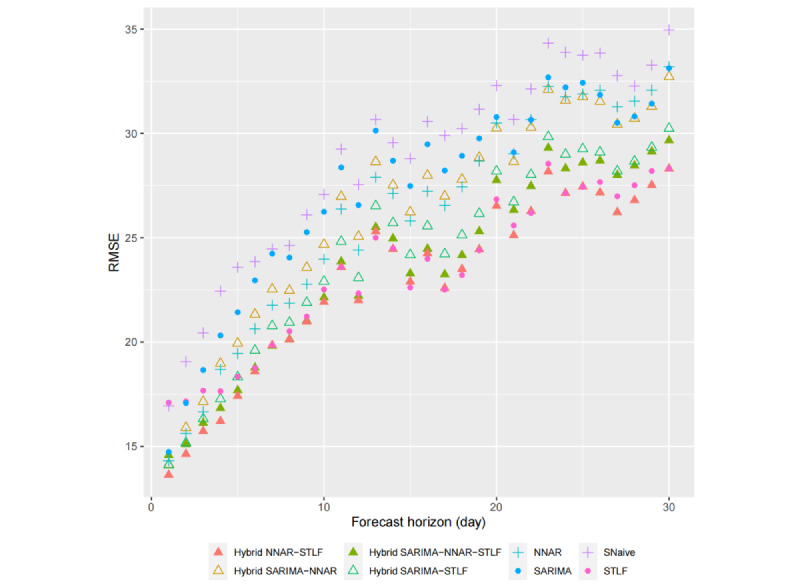
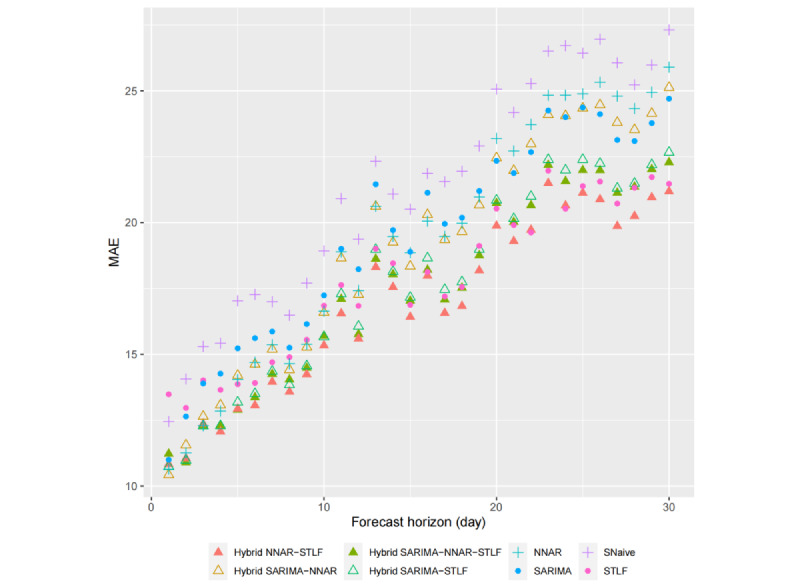
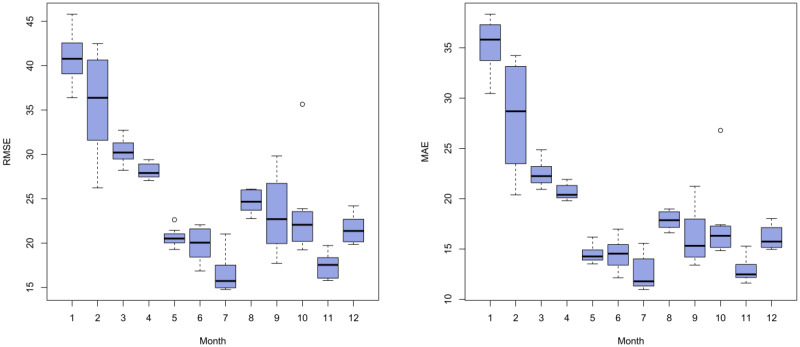
Methods: An exploratory analysis, including graphical analysis, autocorrelation analysis, and seasonal-trend decomposition, was conducted to reveal the seasonality and structural patterns of the retrospective fever clinic visit data. The data were found to exhibit multiseasonality and nonlinearity. On the basis of these results, an ensemble of time-series analysis methods, including individual models and their combinations, was validated on the data set. Root mean square error and mean absolute error were used as accuracy metrics, with the cross-validation of rolling forecasting origin conducted across different forecast horizons.
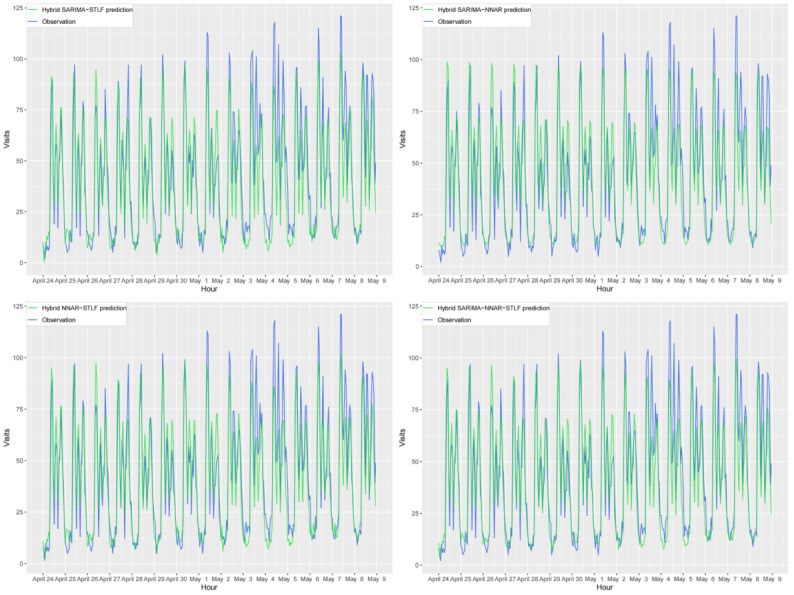
Results: Hybrid models generally outperformed individual models across most forecast horizons. A novel model combination, the hybrid neural network autoregressive (NNAR)-seasonal and trend decomposition using Loess forecasting (STLF), was identified as the optimal model for our forecasting task, with the best performance in all accuracy metrics (root mean square error=20.1, mean absolute error=14.3) for the 15-days-ahead forecasts and an overall advantage for forecast horizons that were 1 to 30 days ahead.
Conclusions: Although forecast accuracy tends to decline with an increasing forecast horizon, the hybrid NNAR-STLF model is applicable for short-, medium-, and long-term forecasts owing to its ability to fit multiseasonality (captured by the STLF component) and nonlinearity (captured by the NNAR component). The model identified in this study is also applicable to hospitals in other regions with similar epidemic outpatient configurations or forecasting tasks whose data conform to long-sequence time series in high frequency exhibiting multiseasonal and nonlinear patterns. However, as external variables and disruptive events were not accounted for, the model performance declined slightly following changes in the COVID-19 containment policy in China. Future work may seek to improve accuracy by incorporating external variables that characterize moving events or other factors as well as by adding data from different organizations to enhance algorithm generalization.
Keywords: COVID-19; hospital management; long sequence; outpatient visits; pediatric fever clinic; time-series forecasting; visits in high frequency.
©Wang Zhang, Zhu Zhu, Yonggen Zhao, Zheming Li, Lingdong Chen, Jian Huang, Jing Li, Gang Yu. Originally published in JMIR Medical Informatics (https://medinform.jmir.org), 20.09.2023.
Conflict of interest statement
Conflicts of Interest: None declared.
Figures

Similar articles
-
Predictive performance of multi-model ensemble forecasts of COVID-19 across European nations.Elife. 2023 Apr 21;12:e81916. doi: 10.7554/eLife.81916. Elife. 2023. PMID: 37083521 Free PMC article.
-
Comparative assessment of methods for short-term forecasts of COVID-19 hospital admissions in England at the local level.BMC Med. 2022 Feb 21;20(1):86. doi: 10.1186/s12916-022-02271-x. BMC Med. 2022. PMID: 35184736 Free PMC article.
-
Forecasting COVID-19 Hospital Census: A Multivariate Time-Series Model Based on Local Infection Incidence.JMIR Public Health Surveill. 2021 Aug 4;7(8):e28195. doi: 10.2196/28195. JMIR Public Health Surveill. 2021. PMID: 34346897 Free PMC article.
-
Forecasting COVID-19 pandemic: Unknown unknowns and predictive monitoring.Technol Forecast Soc Change. 2021 May;166:120602. doi: 10.1016/j.techfore.2021.120602. Epub 2021 Jan 19. Technol Forecast Soc Change. 2021. PMID: 33495665 Free PMC article. Review.
-
Towards energy efficiency: A comprehensive review of deep learning-based photovoltaic power forecasting strategies.Heliyon. 2024 Jun 27;10(13):e33419. doi: 10.1016/j.heliyon.2024.e33419. eCollection 2024 Jul 15. Heliyon. 2024. PMID: 39050417 Free PMC article. Review.
References
-
- Seo JY. Pediatric endocrinology of post-pandemic era. Chonnam Med J. 2021 May;57(2):103–7. doi: 10.4068/cmj.2021.57.2.103. https://europepmc.org/abstract/MED/34123737 - DOI - PMC - PubMed
-
- Wang J, Zong L, Zhang J, Sun H, Harold Walline J, Sun P, Xu S, Li Y, Wang C, Liu J, Li F, Xu J, Li Y, Yu X, Zhu H. Identifying the effects of an upgraded 'fever clinic' on COVID-19 control and the workload of emergency department: retrospective study in a tertiary hospital in China. BMJ Open. 2020 Aug 20;10(8):e039177. doi: 10.1136/bmjopen-2020-039177. https://bmjopen.bmj.com/lookup/pmidlookup?view=long&pmid=32819955 bmjopen-2020-039177 - DOI - PMC - PubMed
-
- Bai W, Sha S, Cheung T, Su Z, Jackson T, Xiang YT. Optimizing the dynamic zero-COVID policy in China. Int J Biol Sci. 2022 Aug 21;18(14):5314–6. doi: 10.7150/ijbs.75699. https://europepmc.org/abstract/MED/36147473 ijbsv18p5314 - DOI - PMC - PubMed
-
- Notice of the General Office of the National Health Commission on improving the prevention and control of infection in fever clinics and medical institutions. National Health Commission of the People's Republic of China. 2020. Jun 30, [2021-09-14]. http://www.nhc.gov.cn/xcs/zhengcwj/202006/4e456696ceef482996a5bd2c3fb4c3... .
-
- Poloniecki JD, Atkinson RW, de Leon AP, Anderson HR. Daily time series for cardiovascular hospital admissions and previous day's air pollution in London, UK. Occup Environ Med. 1997 Aug;54(8):535–40. doi: 10.1136/oem.54.8.535. https://oem.bmj.com/lookup/pmidlookup?view=long&pmid=9326156 - DOI - PMC - PubMed
LinkOut - more resources
Full Text Sources
