. 2023 Sep 26;120(39):e2310903120.
doi: 10.1073/pnas.2310903120. Epub 2023 Sep 20.

Shedding light on rechargeable Na/Cl2 battery

Affiliations

Shedding light on rechargeable Na/Cl2 battery

Guanzhou Zhu et al. Proc Natl Acad Sci U S A. .

Abstract

Advancing new ideas of rechargeable batteries represents an important path to meeting the ever-increasing energy storage needs. Recently, we showed rechargeable sodium/chlorine (Na/Cl2) (or lithium/chlorine Li/Cl2) batteries that used a Na (or Li) metal negative electrode, a microporous amorphous carbon nanosphere (aCNS) positive electrode, and an electrolyte containing dissolved aluminum chloride and fluoride additives in thionyl chloride [G. Zhu et al., Nature 596, 525-530 (2021) and G. Zhu et al., J. Am. Chem. Soc. 144, 22505-22513 (2022)]. The main battery redox reaction involved conversion between NaCl and Cl2 trapped in the carbon positive electrode, delivering a cyclable capacity of up to 1,200 mAh g-1 (based on positive electrode mass) at a ~3.5 V discharge voltage [G. Zhu et al., Nature 596, 525-530 (2021) and G. Zhu et al., J. Am. Chem. Soc. 144, 22505-22513 (2022)]. Here, we identified by X-ray photoelectron spectroscopy (XPS) that upon charging a Na/Cl2 battery, chlorination of carbon in the positive electrode occurred to form carbon-chlorine (C-Cl) accompanied by molecular Cl2 infiltrating the porous aCNS, consistent with Cl2 probed by mass spectrometry. Synchrotron X-ray diffraction observed the development of graphitic ordering in the initially amorphous aCNS under battery charging when the carbon matrix was oxidized/chlorinated and infiltrated with Cl2. The C-Cl, Cl2 species and graphitic ordering were reversible upon discharge, accompanied by NaCl formation. The results revealed redox conversion between NaCl and Cl2, reversible graphitic ordering/amorphourization of carbon through battery charge/discharge, and probed trapped Cl2 in porous carbon by XPS.

Keywords: battery; chemistry; energy storage; material sciences.


Conflict of interest statement

One of the reviewers, H.W., coauthored an award announcement with the corresponding author H.D. in 2019. The two groups have not had any collaborations in the past 10 y.

Figures

Fig. 1.
Fig. 1.
Schematic drawing of the Na/Cl2 battery, Raman spectrum of the as-made aCNS, and a typical Na/Cl2 battery cycling performance at 1,200 mAh g−1. (A) Schematic drawing of a Na/Cl2 battery. Scanning electron microscope imaging of aCNS revealed that aCNS was made by nanospheres with an average of ~60 nm in diameter. (B) Raman spectrum of the as-made aCNS, demonstrating amorphous nature with its broad D and G bands. (C) Cycling performance of a typical Na/Cl2 battery at 1,200 mAh g−1 with 100 mA g−1 current. The battery was stopped at cycle 11 in either charged or discharged state for spectroscopy studies. (D) Typical charge-discharge curve of a Na/Cl2 battery at 1,200 mAh g−1 with 100 mA g−1 current. The battery was stopped in either charged or discharged state for spectroscopy studies.
Fig. 2.
Fig. 2.
The formation and cleavage of C-Cl bonds in aCNS during Na/Cl2 battery charge and discharge, respectively. (A) Cl 2p XPS spectra of charged (before and after annealing in N2 at 600 °C) and discharged aCNS electrodes. All aCNS samples were washed using DIUF water. A clear Cl 2p peak at ~200 eV was observed in the charged aCNS (before N2 annealing, blue solid curve), indicating the presence of C-Cl bonds. This peak had its intensity decreased to a negligible intensity in discharged aCNS (red solid curve), corresponding to the cleavage of the C-Cl bonds. After annealing in N2 at 600 °C, the peak at ~200 eV disappeared (blue dotted curve), suggesting the thermal cleavage of C-Cl bonds during the annealing process. (B) C 1s XPS spectra of charged and discharged aCNS electrodes after washing with DIUF water. A peak at ~286.6 eV, attributed to C-Cl bonds, was present in the charged aCNS spectrum and disappeared in the discharged aCNS spectrum, indicating the formation and cleavage of C-Cl bonds during charging and discharging, respectively. All C 1s XPS fitting was done using the CasaXPS software with a line shape of GL (20) [A line shape constructed by a mixture of Gaussian (80%) and Lorentzian (20%)]. All peaks had their binding energy and FWHM restrained to vary by ± 0.1 eV. (C) AES/scanning electron microscope mappings of charged and discharged aCNS electrodes after washing with DIUF water. In charged aCNS, C and Cl signals overlapped with each other over aCNS (Top row), indicating the presence of C-Cl bonds. In discharged aCNS, only C signal was observed, and no significant Cl signal was detected (Bottom row), suggesting the reversible cleavage of the C-Cl bonds.
Fig. 3.
Fig. 3.
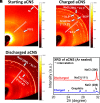
Two-dimensional XRD ring data and XRD spectra of as-made, charged, and discharged aCNS (without exposing to air or washing by DIUF water). (A) Two-dimensional XRD ring data of as-made aCNS. No obvious peaks were detected in the range from 20° to 30°, consistent with the amorphous nature of aCNS. The only two peaks present were due to PTFE binder and Ni substrate. The area enclosed by the two white lines indicated the area over which the spectrum presented in SI Appendix, Fig. S1A was averaged. (B) 2D-XRD ring data of charged aCNS. A lot of new peaks were observed in the range from ~20° to ~31°, corresponding to intercalated graphitic ordering and NaCl. The area enclosed by the two white lines indicated the area over which the spectra presented in D were averaged. (C) Two-dimensional XRD ring data of discharged aCNS. Much less peaks were observed in the range from ~20° to ~31°, with the intensity of the NaCl peak increased. The area enclosed by the two white lines indicated the area over which the spectra presented in D were averaged. (D) XRD spectra of charged and discharged aCNS electrodes, averaging over the area enclosed by the two white solid lines in B and C. The peaks labeled with “*” were attributed to intercalated graphitic ordering sites that were developed in charged aCNS. The XRD spectrum presented in this figure had its X-ray wavelength converted to that of copper K-α (1.5406 Å).
Fig. 4.
Fig. 4.
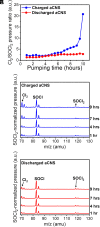
Mass-spectrometry studies of charged and discharged aCNS electrodes. (A) Detected pressure ratio between Cl2 (m/z = 70 amu) and SOCl2 (m/z = 118 amu) at different pumping times. This ratio increased as pumping time increased in charged aCNS electrode, suggesting that free Cl2 was gradually released from the electrode. This ratio remained roughly constant as pumping time increased in discharged aCNS electrode, suggesting that all the Cl2 signal detected was due to fragmentations of SOCl2. (B) Recorded SOCl2-normalized mass spectra (SOCl2 intensity = 1) of charged aCNS electrode at different pumping times. The pumping time was labeled next to each spectrum. The recorded Cl2 intensity clearly increased as pumping time increased, suggesting the releasing of free Cl2 from the electrode. (C) Recorded SOCl2-normalized mass spectra (SOCl2 intensity = 1) of discharged aCNS electrode at different pumping times. The pumping time was labeled next to each spectrum. The recorded Cl2 intensity remained roughly the same as pumping time increased, suggesting that Cl2 came from the fragmentations of SOCl2.
Fig. 5.
Fig. 5.
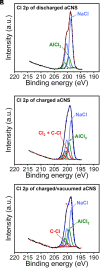
XPS studies of aCNS electrodes at different states during battery operation without exposing these electrodes to air or water. (A) Cl 2p XPS spectrum of aCNS electrode after the battery was fully discharged. The spectrum was well-fitted using only 2 sets of doublet, one for NaCl and one for AlCl3. (B) Cl 2p XPS spectrum of aCNS electrode after the battery was charged to 1,200 mAh g−1. In addition to the peaks due to NaCl and AlCl3, a new peak at ~200 eV, attributed to a mixture of Cl2 and C-Cl, was needed to fit the overall spectrum, suggesting that Cl2 was formed during battery charging. (C) Cl 2p XPS spectrum of aCNS electrode after the battery was charged to 1,200 mAh g−1 (same sample as B) but pumped under vacuum for 96 h. After pumping, in addition to the peaks due to NaCl and AlCl3, an obvious decrease in the intensity of the ~200 eV peak was observed (indicated by “*”), suggesting that most of the Cl2 was vacuumed away during the pumping period. The XPS fitting was done using the CasaXPS software with a Lorentzian asymmetric line shape. All the peaks used in fitting had their binding energy and FWHM restrained to vary by ±0.1 eV.

References

    1. Feng Y., et al. , Challenges and advances in wide-temperature rechargeable lithium batteries. Energy Environ. Sci. 15, 1711–1759 (2022).
    1. Goodenough J. B., Park K.-S., The Li-ion rechargeable battery: A perspective. J. Am. Chem. Soc. 135, 1167–1176 (2013). - PubMed
    1. Cohn A. P., Muralidharan N., Carter R., Share K., Pint C. L., Anode-free sodium battery through in situ plating of sodium metal. Nano Lett. 17, 1296–1301 (2017). - PubMed
    1. Liang P., et al. , A nonflammable high-voltage 4.7 V anode-free lithium battery. Adv. Mater. 34, e2207361 (2022). - PubMed
    1. Sun H., et al. , A safe and non-flammable sodium metal battery based on an ionic liquid electrolyte. Nat. Commun. 10, 3302 (2019). - PMC - PubMed

LinkOut - more resources