. 2023 Sep 20;18(9):e0291131.
doi: 10.1371/journal.pone.0291131. eCollection 2023.

Discovery of neutralizing SARS-CoV-2 antibodies enriched in a unique antigen specific B cell cluster

Affiliations

Discovery of neutralizing SARS-CoV-2 antibodies enriched in a unique antigen specific B cell cluster

Stine Sofie Frank Lende et al. PLoS One. .

Abstract

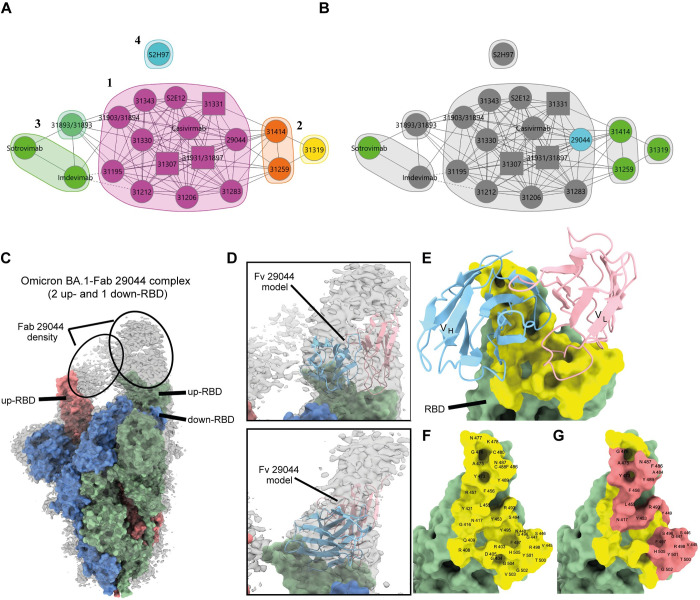
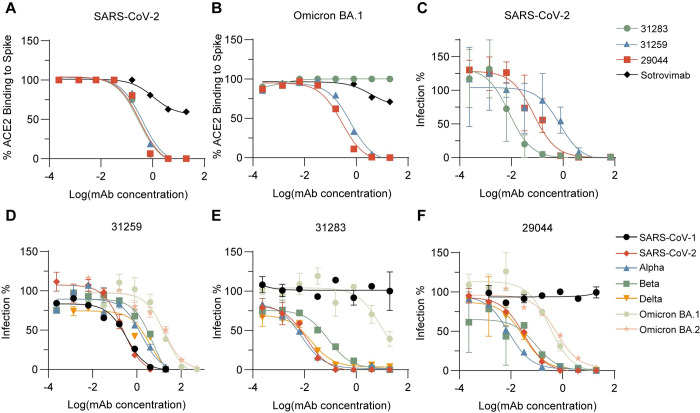
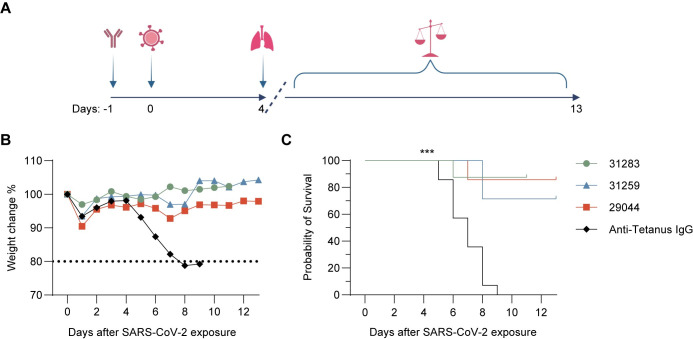
Despite development of effective SARS-CoV-2 vaccines, a sub-group of vaccine non-responders depends on therapeutic antibodies or small-molecule drugs in cases of severe disease. However, perpetual viral evolution has required continuous efficacy monitoring as well as exploration of new therapeutic antibodies, to circumvent resistance mutations arising in the viral population. We performed SARS-CoV-2-specific B cell sorting and subsequent single-cell sequencing on material from 15 SARS-CoV-2 convalescent participants. Through screening of 455 monoclonal antibodies for SARS-CoV-2 variant binding and virus neutralization, we identified a cluster of activated B cells highly enriched for SARS-CoV-2 neutralizing antibodies. Epitope binning and Cryo-EM structure analysis identified the majority of neutralizing antibodies having epitopes overlapping with the ACE2 receptor binding motif (class 1 binders). Extensive functional antibody characterization identified two potent neutralizing antibodies, one retaining SARS-CoV-1 neutralizing capability, while both bind major common variants of concern and display prophylactic efficacy in vivo. The transcriptomic signature of activated B cells harboring broadly binding neutralizing antibodies with therapeutic potential identified here, may be a guide in future efforts of rapid therapeutic antibody discovery.


Conflict of interest statement

The authors have declared that no competing interests exist.

Figures

Fig 1
Fig 1. Cohort selection and clinical characteristics.
50% Neutralization titer (NT50) values (plasma dilution factor) from 194 SARS-CoV-2 recovered participants calculated from SARS-CoV-2 pseudovirus neutralization curves are shown on y-axis. Participants are ordered along the x-axis from lowest (left) to highest (right) NT50 values within the cohort. The 15 participants chosen for B cell receptor characterization are highlighted.
Fig 2
Fig 2. Single-cell profiling of 7176 B cells from three donor groups by scRNA-seq and V(D)J-seq.
(A) UMAP projection and unsupervised clustering revealing 9 transcriptomic clusters annotated according to selected marker genes. (B) Somatic hyper-mutation percentage compared to inferred naïve germline stratified by isotype and transcriptomic cluster, highlighting one cluster of naïve B cells associated with particularly low mutation rate. The dotted line indicates the threshold used for the selection of mAbs for validation. The number of cells within each cluster or isotype is displayed below. (C) Fraction of cells with each isotype stratified by transcriptomic cluster highlighting the naïve cluster and three IgG-rich clusters. (D) mRNA expression levels given by the log of the normalized UMI counts of selected markers in each transcriptomic cluster. (E) Scaled average expression in each cluster indicating memory B cell, naïve B cell and activated B cell markers highlighting unique transcriptomic profiles of the clusters. The size of the dots indicates the percentage of cells expressing the given marker gene within the cluster.
Fig 3
Fig 3. Monoclonal antibody screening.
(A) Neutralization percentage of SARS-CoV-2 pseudovirus shown for each individual mAb supernatant analyzed at 20 μg/ml, shown on y-axis. MAbs are ordered along the x-axis from best (left) to poorest (right) neutralizers. n = 455. Screening was performed once in duplicate determinations. (B) Visualization of the expressed mAbs B cell cluster origin and distribution within all isolated B cells. Neutralizers shown in green (<80%-95%> neutralization, n = 9). Top neutralizers shown in red (<95% neutralization, n = 24). Non-neutralizers shown in blue (<80% neutralization). Background shown in grey (cells not expressed for screening).(C) Distribution of successful neutralizing mAbs, between clusters 6, 8 and remaining clusters (cluster 7 excluded). Hit rate cut-off for defining successful neutralizations was set at 80% pseudovirus neutralization. Hit rates were calculated within each cluster group. n = 455 (D) Predictive performance of Ag scores used for SARS-CoV-2 specific B cell sorting towards neutralization capability in cluster 8. n = 108. Red = SARS-CoV-2 D614G mutant trimer, Blue = SARS-CoV-2 RBD, Orange = SARS-CoV-1 RBD, Green = SARS-CoV-2 trimer. The p-value is based on a Kruskal-Wallis test of the receiver-operator characteristics curve.
Fig 4
Fig 4. In vitro analysis of lead mAbs binding.
(A) Ranking of purified mAbs from lowest IC50 pseudovirus neutralization value at the top (best neutralization) to highest IC50 at the bottom (poorest neutralization). Each antibody IC50 value obtained from triplicate point determinations of the dilution curve. Mesoscale binding values are shown for each mAb (supernatant) towards SARS-CoV-2 Spike, N-terminal domain (NTD) and receptor binding domain (RBD), as a heat-map. The binding determinations were performed once in duplicate. Colors indicate normalization from 0–100 within each column. (B) Mesoscale binding values for binding to the RBD of viral variants Alpha (N501Y, A570D), Beta (K417N, E484K, N501Y), Gamma (K417T, E484K, N501Y) and Delta (L452R), shown as fold change from SARS-CoV-2 RBD binding within each mAb individually. The binding determinations were performed once in duplicate. (C) Heat-map showing percentage ACE2 blocking for each mAb binding viral variant spike proteins (CoV-2, Alpha (B.1.1.7), Beta (B.1.351), Gamma (P.1), Delta (B.1.617.2) and Omicron BA.1(B.1.1.529). The ACE2 blocking analysis was performed in duplicate determinations of a dilution curve.
Fig 5
Fig 5. Characterization of mAb epitopes and cryo-EM structure of Omicron BA.1 spike trimer with Fab 29044.
(A) Epitope network plot colored by communities. Antibodies are represented as nodes and by number (Circles are mAbs tested in both orientations and squares are mAbs tested only in one direction). Pairwise blocking relationships are indicated by chords, and dashed lines are mAbs showing asymmetric blocking. A cut-off of 3.5 (S6B Fig) was used to define epitope communities. Community class III (Greens) and class II (Oranges) compete with community class I (magenta) but not with each other. (B) Epitope community plot highlighting mAbs retaining binding to Omicron B.1.1.529 and SARS-CoV-1 RBD colored in green. MAbs retaining binding to Omicron B.1.1.529 RBD is shown in light blue. (C) Surface representation of spike trimer overlayed with the cryo-EM density map (grey) is shown. Additional density observed for the Fab 29044 is circled and up- (red and green monomer) and down-RBD (blue monomer) are highlighted. (D) Zoomed in views showing model corresponding to variable region (Fv) of mAb 29044 (cartoon representation; VH, cyan; VL, pink) fitted into the overlayed Cryo-EM map (grey). (E) Close-up view of the complex depicting binding interface (yellow). (F) Labelled RBD residues (yellow) interfacing with 29044 Fv are shown. (G) Labelled ACE2 footprint (coral) on RBD in the background of 29044 Fv interface is shown.
Fig 6
Fig 6. Neutralization capacity and variant sensitivity of lead mAbs.
(A-B) ACE2-competition performed in duplicates at mAb 5-fold dilutions from 20μg/ml– 0.256ng/ml, towards SARS-CoV-2 Spike and Omicron BA.1 Spike proteins. Sotrovimab (black) shown as negative (non-ACE2-competitive) control. Three-parameter non-linear fit is plotted. (C) SARS-CoV-2 neutralization displayed as infection percentage at mAb 5-fold dilutions from 20μg/ml– 0.256ng/ml, towards full-length eGFP expressing SARS-CoV-2. Quantified as eGFP+ cells by flow cytometry. Error bars represent mean and range of triplicate determinations. Three-parameter non-linear fit is plotted. (D-F) Pseudovirus neutralization displayed as infection percentage at mAb 5-fold dilutions ranging from 517μg/ml– 0.256ng/ml, towards SARS-CoV-1 and selected SARS-CoV-2 variants of concern. Quantified as eGFP+ cells by flow cytometry. MAb identifier is shown as title on graph. Error bars represent mean and range of duplicate determinations. Three-parameter non-linear fit is plotted.
Fig 7
Fig 7. In vivo prophylaxis.
(A) Schematic timeline of in vivo experiment design. Created with BioRender.com. (B) Daily percent weight change in mice post SARS-CoV-2 exposure. Day 0 indicates day of viral exposure. Anti-Tetanus IgG (black) was dosed 400 ug/mouse, n = 14. mAb 31283 (green) was dosed 400 ug/mouse, n = 8. mAb 29044 (red) was dosed 400 ug/mouse, n = 7. mAb 31259 (blue) was dosed 2 mg/mouse, n = 6. (C) Probability of survival displayed for the treatment groups shown in b. P-values calculated individually for each mAb treatment group compared to the Anti-Tetanus IgG control group using Log-rank (Mantel-Cox) test; 31283 p = 0.0002; 31259 p = 0.0004; 29044 p = 0.0003.

Similar articles

Cited by

References

    1. Zheng C, Shao W, Chen X, Zhang B, Wang G, Zhang W. Real-world effectiveness of COVID-19 vaccines: a literature review and meta-analysis. International Journal of Infectious Diseases. 2022;114:252–60. doi: 10.1016/j.ijid.2021.11.009 - DOI - PMC - PubMed
    1. Wei J, Stoesser N, Matthews PC, Ayoubkhani D, Studley R, Bell I, et al.. Antibody responses to SARS-CoV-2 vaccines in 45,965 adults from the general population of the United Kingdom. Nature microbiology. 2021;6(9):1140–9. Epub 2021/07/23. doi: 10.1038/s41564-021-00947-3 ; PubMed Central PMCID: PMC8294260 remaining authors declare no competing interests. - DOI - PMC - PubMed
    1. Søgaard OS, Reekie J, Johansen IS, Nielsen H, Benfield T, Wiese L, et al.. Characteristics associated with serological COVID-19 vaccine response and durability in an older population with significant comorbidity: the Danish Nationwide ENFORCE Study. Clinical microbiology and infection: the official publication of the European Society of Clinical Microbiology and Infectious Diseases. 2022;28(8):1126–33. Epub 2022/03/15. doi: 10.1016/j.cmi.2022.03.003 ; PubMed Central PMCID: PMC8913025. - DOI - PMC - PubMed
    1. Müller L, Andrée M, Moskorz W, Drexler I, Walotka L, Grothmann R, et al.. Age-dependent Immune Response to the Biontech/Pfizer BNT162b2 Coronavirus Disease 2019 Vaccination. Clinical infectious diseases: an official publication of the Infectious Diseases Society of America. 2021;73(11):2065–72. Epub 2021/04/28. doi: 10.1093/cid/ciab381 ; PubMed Central PMCID: PMC8135422. - DOI - PMC - PubMed
    1. Lee ARYB Wong SY, Chai LYA Lee SC, Lee MX Muthiah MD, et al.. Efficacy of covid-19 vaccines in immunocompromised patients: systematic review and meta-analysis. 2022;376:e068632. doi: 10.1136/bmj-2021-068632 - DOI - PMC - PubMed

Publication types

Supplementary concepts