

Fatty Acid Oxidation Mediated by Malonyl-CoA Decarboxylase Represses Renal Cell Carcinoma Progression
- PMID: 37729394
- PMCID: PMC10690093
- DOI: 10.1158/0008-5472.CAN-23-0969
Fatty Acid Oxidation Mediated by Malonyl-CoA Decarboxylase Represses Renal Cell Carcinoma Progression
Abstract
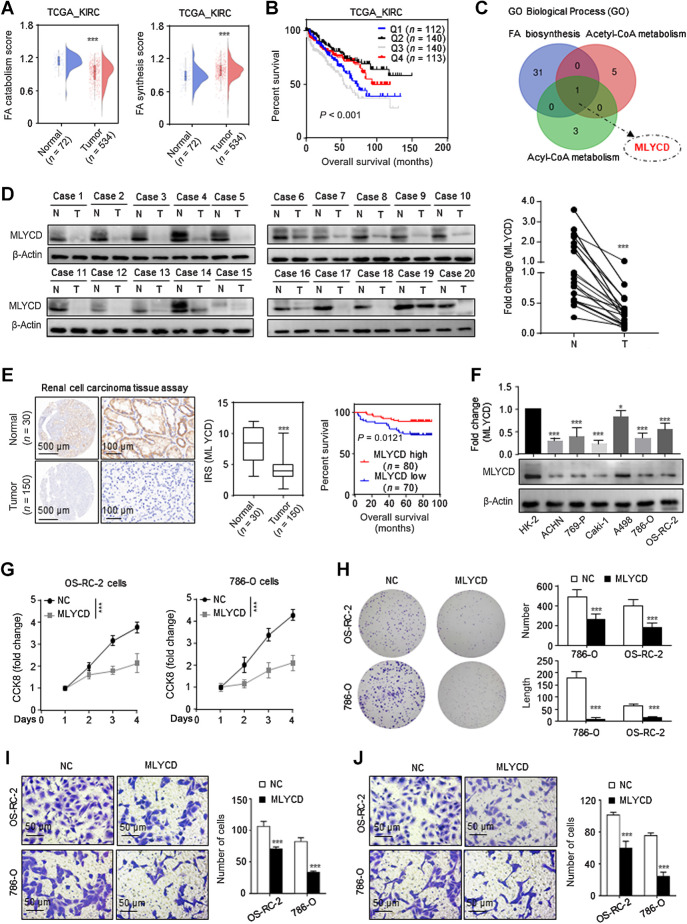
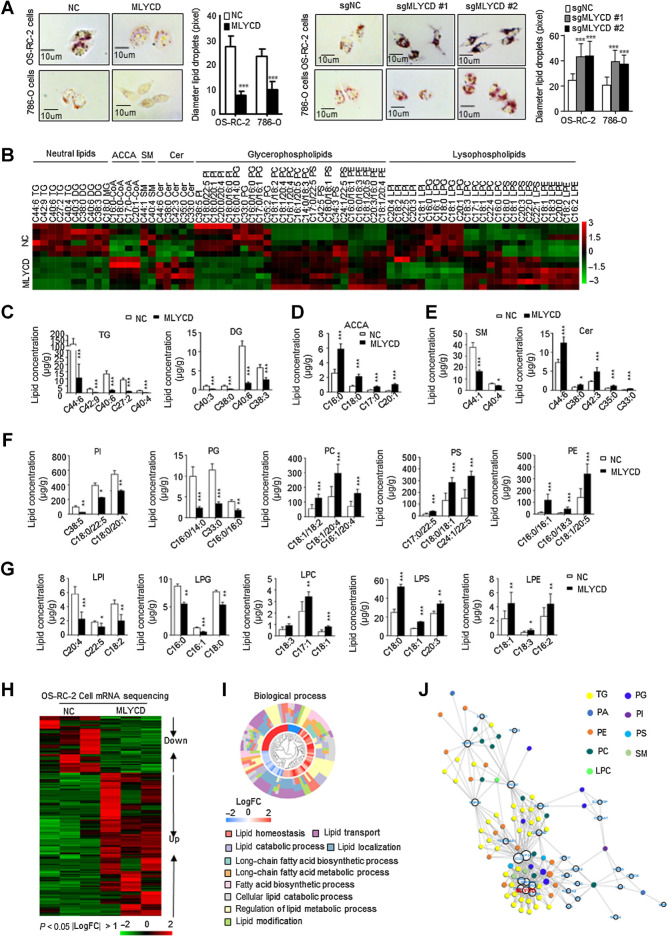
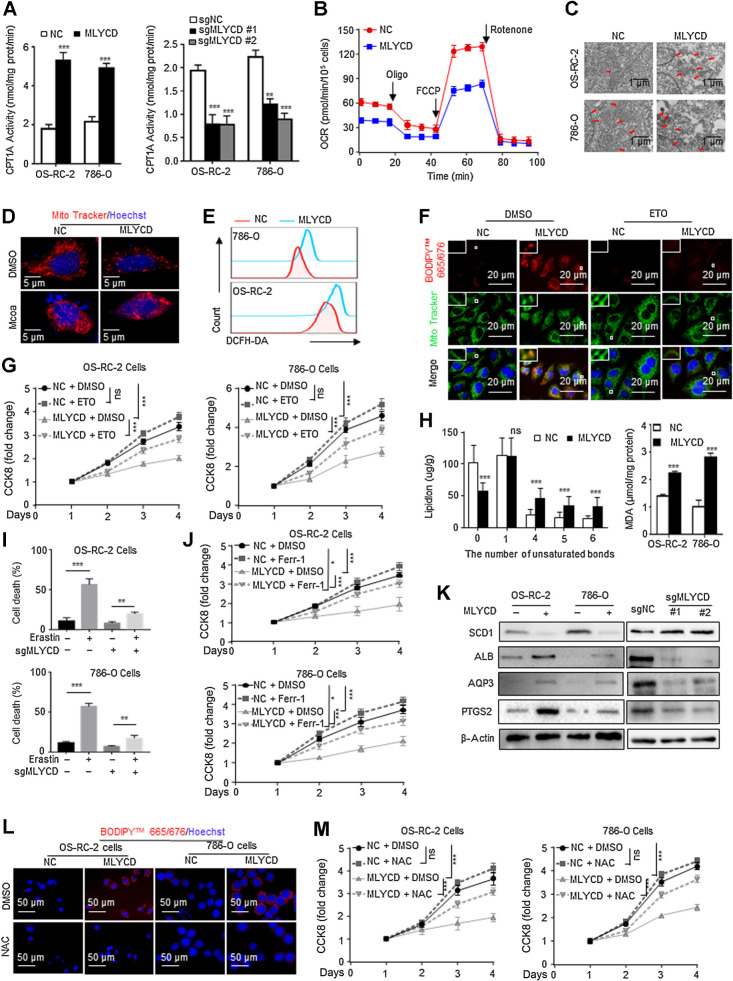
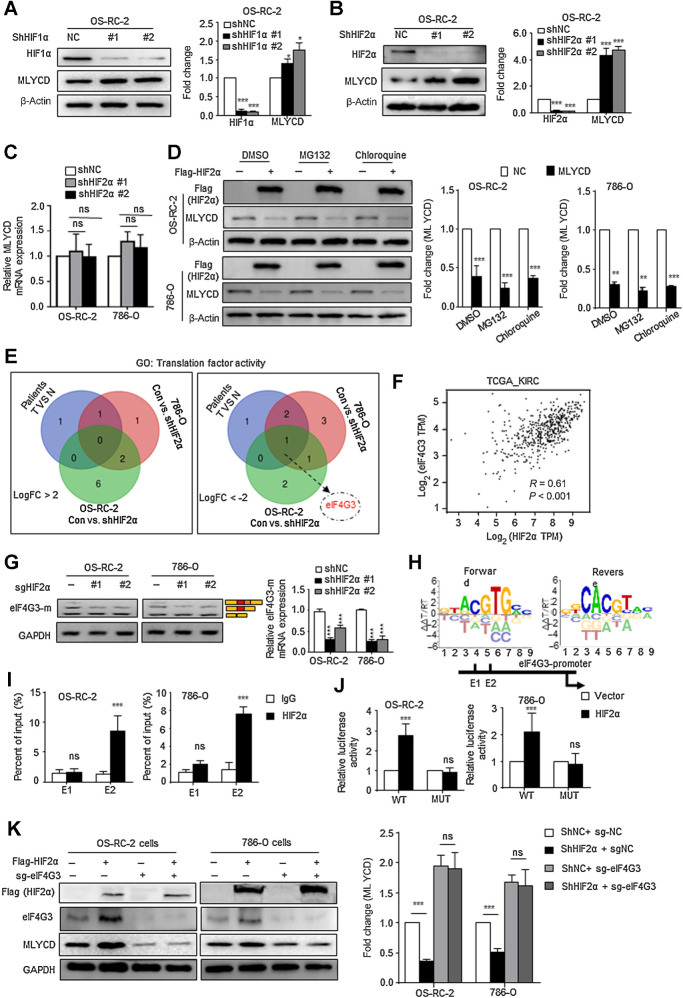
Fatty acid metabolism reprogramming is a prominent feature of clear cell renal cell carcinoma (ccRCC). Increased lipid storage supports ccRCC progression, highlighting the importance of understanding the molecular mechanisms driving altered fatty acid synthesis in tumors. Here, we identified that malonyl-CoA decarboxylase (MLYCD), a key regulator of fatty acid anabolism, was downregulated in ccRCC, and low expression correlated with poor prognosis in patients. Restoring MLYCD expression in ccRCC cells decreased the content of malonyl CoA, which blocked de novo fatty acid synthesis and promoted fatty acid translocation into mitochondria for oxidation. Inhibition of lipid droplet accumulation induced by MLYCD-mediated fatty acid oxidation disrupted endoplasmic reticulum and mitochondrial homeostasis, increased reactive oxygen species levels, and induced ferroptosis. Moreover, overexpressing MLYCD reduced tumor growth and reversed resistance to sunitinib in vitro and in vivo. Mechanistically, HIF2α inhibited MLYCD translation by upregulating expression of eIF4G3 microexons. Together, this study demonstrates that fatty acid catabolism mediated by MLYCD disrupts lipid homeostasis to repress ccRCC progression. Activating MLYCD-mediated fatty acid metabolism could be a promising therapeutic strategy for treating ccRCC.
Significance: MLYCD deficiency facilitates fatty acid synthesis and lipid droplet accumulation to drive progression of renal cell carcinoma, indicating inducing MYLCD as a potential approach to reprogram fatty acid metabolism in kidney cancer.
©2023 The Authors; Published by the American Association for Cancer Research.
Figures
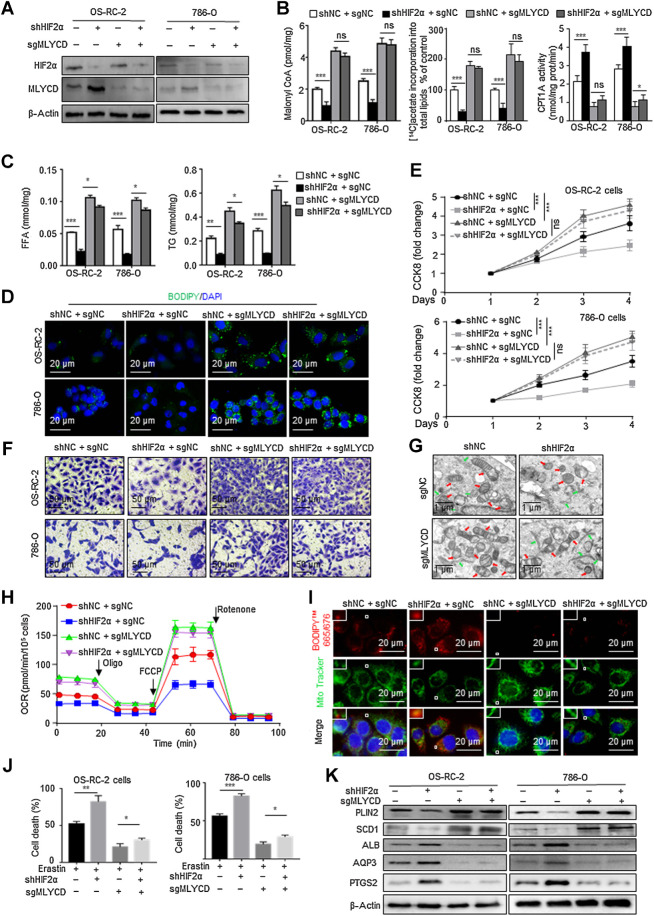
![Figure 3. MLYCD inhibited de novo FA synthesis by reducing malonyl-CoA content, ultimately induced cell death via increasing ER stress. A, Schematic illustration of the key role of MLYCD in FA anabolism. B and C, Levels of malonyl CoA, FFA, and TGs in OS-RC-2 and 786-O cells with/without overexpression (B) or knockout expression (C) of MLYCD. D and E, Level of de novo FA synthesis in different RCC cells was measured by [14C] acetate incorporation into lipids. F, Representative fluorescence imaging of LDs stained with BODIPY 493/503 (green) and nuclei stained with DAPI (blue) in OS-RC-2 and 786-O cells with/without MLYCD overexpression and/or malonyl CoA (10 μmol/L) for 24 hours. G, CCK-8 assay for assessing the cell proliferation of 786-O cells with/without MLYCD overexpression and/or malonyl-CoA (10 μmol/L). H, Representative fluorescence imaging of ER tracker (red) staining to assess the ER stress expansion in OS-RC-2 and 786-O cells with/without MLYCD overexpression. Nuclei were stained with DAPI (blue). I, Representative imaging of Western blot analysis for detecting the expression of ER stress markers in OS-RC-2 and 786-O cells with/without MLYCD overexpression. J, CCK-8 assay for assessing the cell proliferation of OS-RC-2 and 786-O cells with/without MLYCD overexpression (B) and/or 4-PBA (10 μmol/L). ns, not significant; *, P < 0.05; **, P < 0.01; ***, P < 0.001.](https://cdn.ncbi.nlm.nih.gov/pmc/blobs/06fa/10690093/8239260e94f2/3920fig3.jpg)
Similar articles
-
STAT2/SLC27A3/PINK1-Mediated Mitophagy Remodeling Lipid Metabolism Contributes to Pazopanib Resistance in Clear Cell Renal Cell Carcinoma.Research (Wash D C). 2024 Nov 26;7:0539. doi: 10.34133/research.0539. eCollection 2024. Research (Wash D C). 2024. PMID: 39600540 Free PMC article.
-
The Role of HADHB in Mitochondrial Fatty Acid Metabolism During Initiation of Metastasis in ccRCC.Mol Carcinog. 2025 May;64(5):923-935. doi: 10.1002/mc.23898. Epub 2025 Feb 24. Mol Carcinog. 2025. PMID: 39991877
-
AUP1 regulates lipid metabolism and induces lipid accumulation to accelerate the progression of renal clear cell carcinoma.Cancer Sci. 2022 Aug;113(8):2600-2615. doi: 10.1111/cas.15445. Epub 2022 Jun 27. Cancer Sci. 2022. PMID: 35633317 Free PMC article.
-
Fatty acid metabolism reprogramming in ccRCC: mechanisms and potential targets.Nat Rev Urol. 2023 Jan;20(1):48-60. doi: 10.1038/s41585-022-00654-6. Epub 2022 Oct 3. Nat Rev Urol. 2023. PMID: 36192502 Free PMC article. Review.
-
Malonyl CoA control of fatty acid oxidation in the ischemic heart.J Mol Cell Cardiol. 2002 Sep;34(9):1099-109. doi: 10.1006/jmcc.2002.2060. J Mol Cell Cardiol. 2002. PMID: 12392882 Review.
Cited by
-
STX17-DT facilitates axitinib resistance in renal cell carcinoma by inhibiting mitochondrial ROS accumulation and ferroptosis.Cell Death Dis. 2025 Feb 23;16(1):125. doi: 10.1038/s41419-025-07456-9. Cell Death Dis. 2025. PMID: 39988631 Free PMC article.
-
Metabolism-regulated ferroptosis in cancer progression and therapy.Cell Death Dis. 2024 Mar 8;15(3):196. doi: 10.1038/s41419-024-06584-y. Cell Death Dis. 2024. PMID: 38459004 Free PMC article. Review.
-
Molecular Targets and Small Molecules Modulating Acetyl Coenzyme A in Physiology and Diseases.ACS Pharmacol Transl Sci. 2024 Dec 18;8(1):36-46. doi: 10.1021/acsptsci.4c00476. eCollection 2025 Jan 10. ACS Pharmacol Transl Sci. 2024. PMID: 39816789 Review.
-
Blood metabolites, mitochondrial biofunction, and cervical cancer: a bidirectional Mendelian randomization study.BMC Womens Health. 2025 Jul 23;25(1):363. doi: 10.1186/s12905-025-03909-7. BMC Womens Health. 2025. PMID: 40702481 Free PMC article.
-
GPD1L as a potential biomarker associated with Treg cell infiltration and lipid metabolism in clear cell renal cell carcinoma.J Transl Med. 2025 Aug 6;23(1):872. doi: 10.1186/s12967-025-06882-9. J Transl Med. 2025. PMID: 40770345 Free PMC article.
References
Publication types
MeSH terms
Substances
Grants and funding
- NO. 82203099/National Natural Science Foundation of China (NSFC)
- NO. 82173294/National Natural Science Foundation of China (NSFC)
- NO. 82103000/National Natural Science Foundation of China (NSFC)
- NO. LHGJ20220335/the Joint Construction Project between Medical Science and Technology Research Project of Henan Province
- NO.QNCXTD2023023/Funding for Scientific Research and Innovation Team of The First Affiliated Hospital of Zhengzhou University
LinkOut - more resources
Full Text Sources
Medical
