. 2023 Sep 22;9(38):eadf3497.
doi: 10.1126/sciadv.adf3497. Epub 2023 Sep 20.

A cell size threshold triggers commitment to stomatal fate in Arabidopsis

Affiliations

A cell size threshold triggers commitment to stomatal fate in Arabidopsis

Yan Gong et al. Sci Adv. .

Abstract

How flexible developmental programs integrate information from internal and external factors to modulate stem cell behavior is a fundamental question in developmental biology. Cells of the Arabidopsis stomatal lineage modify the balance of stem cell proliferation and differentiation to adjust the size and cell type composition of mature leaves. Here, we report that meristemoids, one type of stomatal lineage stem cell, trigger the transition from asymmetric self-renewing divisions to commitment and terminal differentiation by crossing a critical cell size threshold. Through computational simulation, we demonstrate that this cell size-mediated transition allows robust, yet flexible termination of stem cell proliferation, and we observe adjustments in the number of divisions before the differentiation threshold under several genetic manipulations. We experimentally evaluate several mechanisms for cell size sensing, and our data suggest that this stomatal lineage transition is dependent on a nuclear factor that is sensitive to DNA content.


Figures
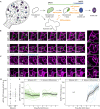
Fig. 1.
Fig. 1.. Transitions from self-renewal to differentiation in stomatal lineage meristemoids are not predicted by the expression of the transcription factors SPCH or MUTE.
(A) Cartoon of stomatal lineage cells and lineage trajectory (right) and their spatial arrangements (left). Protodermal precursor cells undergo asymmetric “entry” divisions producing a meristemoid (green) and a stomatal lineage ground cell (SLGC; white) daughter. Meristemoids undergo additional “amplifying” asymmetric cell divisions (ACDs) before becoming guard mother cells (GMCs; blue). GMCs divide once, symmetrically into a pair of guard cells (GCs; purple). SLGCs typically become pavement cells. (B and C) Time-lapse analysis of the dynamics of pSPCH::SPCH-YFP [(B) green] and pMUTE::MUTE-YFP [(C) blue] reporters during ACDs in 3-dpg cotyledons followed by lineage tracing. SPEECHLESS (SPCH) and MUTE reporters were imaged every 40 min for 16 hours, returned to ½ Murashige and Skoog plates, and reimaged to capture the division and fates of the meristemoid daughters from ACDs. Two examples are shown for each reporter where the daughter meristemoid either undergoes another ACD or becomes a GMC which later divides into GCs. 00:00 (hours:minutes) marks cell plate formation. Cell outlines are visualized by plasma membrane reporter pATML1::RCI2A-mCherry (magenta). Arrowheads and asterisks indicate asymmetric meristemoid and symmetric GMC divisions, respectively. (D) Quantification of SPCH-YFP reporter levels at birth for meristemoids that will either undergo additional ACDs or differentiate and become stomata. (E and F) Quantification of SPCH-YFP reporter (E) or MUTE-YFP reporter (F) levels and dynamics in cells with either behavior. Trends with 95% confidence intervals are shown as black lines with gray bands. Sample sizes: (D and E) >16 cells per genotype, (F) 5 cells. Scale bar, 10 μm. a.u. arbitrary units; n.d. not detected.
Fig. 2.
Fig. 2.. The M-GMC transition of the stomatal lineage is correlated with small meristemoid cell size at birth.
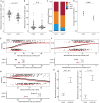
(A) Confocal images of meristemoids at birth and the subsequent division behaviors of these meristemoids captured by lineage tracing in 3-dpg cotyledons. Meristemoids are divided into two groups based on their subsequent division behaviors: those that undergo additional ACDs or those that differentiate and become stomata. Three examples are shown for each group. Cell outlines are visualized by plasma membrane reporter pATML1::RCI2A-mCherry (magenta). The cell polarity reporter pBRXL2::BRXL2-YFP (green) was included to define cell division type. 00:00 (hours:minutes) marks cell plate formation. Arrowheads and asterisks indicate ACDs of meristemoids and GMC divisions, respectively. (B) Comparison of areal cell size at birth between meristemoids that acquire different fates. (C) Logistic regression of meristemoid behaviors based on their cell size at birth. The cell size of each meristemoid is shown as a single dot and the computed regression model is shown in dark red. The predicted transition zone where the meristemoid is predicted to have a 10 to 90% probability of undergoing another ACD is shown in a gray box. The P value in (B) is calculated by the Mann-Whitney test, and the P value in (C) is calculated by the glm.fit function with a binomial model in R (60). Sample sizes: (B and C) 50 cells per behavior. Scale bar, 10 μm.
Fig. 3.
Fig. 3.. Cell size–guided M-GMC transition is sufficient to explain the self-renewal and differentiation behavior of meristemoids in silico.
(A) Workflow of the meristemoid division tree model (left) and its key parameters (I to IV, right). A total of 10,000 meristemoid sizes are randomly drawn from a gamma distribution (I). These meristemoids divide asymmetrically, with size asymmetry drawn from a beta distribution (II). The newly formed meristemoid daughter is passed on to a cell size–guided differentiation model (III), where it differentiates with some probability based on the current size, while the SLGC is discarded. Differentiated meristemoids leave the model; the rest grow with a 3% growth rate (per hour) and a cell cycle length drawn from a gamma distribution (IV). After growth, these meristemoids are looped back to divide asymmetrically and pass through the rest of the model until all differentiate. (I) Histogram of measured starting meristemoid cell sizes (gray, n = 132 cells) and fitted distribution (orange). (II) Histogram of measured ACD size asymmetry (gray) and fitted distribution (orange). (III) Dot plot of measured meristemoid cell sizes at birth separated by their fates (gray) and fitted distribution (orange). (IV) Histogram of measured cell cycle lengths (gray) and fitted distribution (orange). (B and C) Outputs of the meristemoid division tree model. (B) Computed meristemoid cell sizes at ACDs before differentiation. (C) Comparison of empirical and simulated meristemoid division-differentiation behaviors. Empirical data are taken from lineage tracing experiments where behaviors of cells in the abaxial cotyledon of corresponding genotypes are tracked from 3 to 5 dpg (8). Smoothed conditional means are shown as lines. All P values are calculated by the Mann-Whitney test. Sample sizes: (A-I) 132 cells, (A-II) 98 cells, (A-III) 98 cells, (A-IV) 112 cells, (B) 913 cells, (C) >193 cells per replicate per genotype.
Fig. 4.
Fig. 4.. Alteration of the meristemoid size and ACD asymmetry affects a number of successive meristemoid ACDs but not the cell size of the M-GMC transition.
(A to C) Comparison of cell size for leaf epidermal cells in wild-type Col-0, tetraploid Col-0 (Col-0 4N), and the ctr1 mutant at different stages of development. (A) False-colored confocal images of the abaxial epidermis of 0-dpg cotyledons from different genetic backgrounds. mPS-PI staining images of half of the cotyledons were segmented and false-colored based on cell size in MorphoGraphX (55). (B) Cell size distribution of epidermal cells in Col-0, Col-0 4N, and ctr1 cotyledons at 0 dpg. (C) Cell size distribution of meristemoids in Col-0, Col-0 4N, and ctr1 cotyledons at 4 dpg. Meristemoids were selected from confocal images of 4-dpg cotyledons (labeled with the plasma membrane reporter pATML1::RCI2A-mCherry) with their cell size (surface area) measured in Fiji (53). (D and E) Division-differentiation behavior of meristemoid population from 3 to 5dpg, shown as the distribution (D) or as its mean, counting differentiation as zero (E). Data of Col-0 are adapted from (8). (F) Comparison of cell size at birth between meristemoids that acquire different fates in Col-0, Col-0 4N, ctr1, and myoxi-i lines. (G) Comparison of transition sizes computed from the data in (F). The Col-0 data are taken from Fig. 2B. All P values are calculated by the Mann-Whitney test. Sample sizes: (B) >500 cells per genotype, (C) >50 cells per genotype, (D and E) >636 cells per genotype, (F) >50 cells per genotype. Scale bar, 10 μm.
Fig. 5.
Fig. 5.. Cell size is sensed via chromatin content in the nucleoplasm.
(A and B) Comparisons of nuclear area (A) and cell area (B) for wild-type Col-0 and crwn1 plants. (C and D) Comparison of a number of amplifying divisions for Col-0 and crwn1 plants, as the distribution (C) or its mean (D). (E to G) Logistic regressions of cell area (E), nuclear area (F), or N:C ratio (G) against meristemoid behavior, showing that relative to Col-0 meristemoids, crwn1 meristemoids transition to differentiation at the same nuclear size, but a different overall cell size and N:C ratio. Below each logistic, transition size estimates are compared. (H) Cell and nuclear areas of diploid and tetraploid meristemoids at transition showing that chromatin content influences both transition sizes. All P values are calculated by the Mann-Whitney test, except in (E) to (H), where t tests were performed on the estimates of transition sizes (see Materials and Methods). Sample sizes: (A) >77 cells per genotype, (B) >79 cells per genotype, (C and D) 600 cells per genotype, (E to G) >200 cells per genotype, (H) ≥100 cells per genotype.

Similar articles

Cited by

References

    1. L. E. O'Brien, S. S. Soliman, X. Li, D. Bilder, Altered modes of stem cell division drive adaptive intestinal growth. Cell 147, 603–614 (2011). - PMC - PubMed
    1. W. Liu, Y. Wen, P. Bi, X. Lai, X. S. Liu, X. Liu, S. Kuang, Hypoxia promotes satellite cell self-renewal and enhances the efficiency of myoblast transplantation. Development 139, 2857–2865 (2012). - PMC - PubMed
    1. N. Motohashi, A. Asakura, Muscle satellite cell heterogeneity and self-renewal. Front. Cell Dev. Biol. 2, 1 (2014). - PMC - PubMed
    1. L. R. Lee, D. C. Bergmann, The plant stomatal lineage at a glance. J. Cell Sci. 132, jcs228551 (2019). - PMC - PubMed
    1. O. S. Lau, Z. Song, Z. Zhou, K. A. Davies, J. Chang, X. Yang, S. Wang, D. Lucyshyn, I. H. Z. Tay, P. A. Wigge, D. C. Bergmann, Direct control of SPEECHLESS by PIF4 in the high-temperature response of stomatal development. Curr. Biol. 28, 1273–1280.e3 (2018). - PMC - PubMed