. 2023 Sep 19;4(9):101189.
doi: 10.1016/j.xcrm.2023.101189.

Spatially aware deep learning reveals tumor heterogeneity patterns that encode distinct kidney cancer states

Affiliations

Spatially aware deep learning reveals tumor heterogeneity patterns that encode distinct kidney cancer states

Jackson Nyman et al. Cell Rep Med. .

Abstract

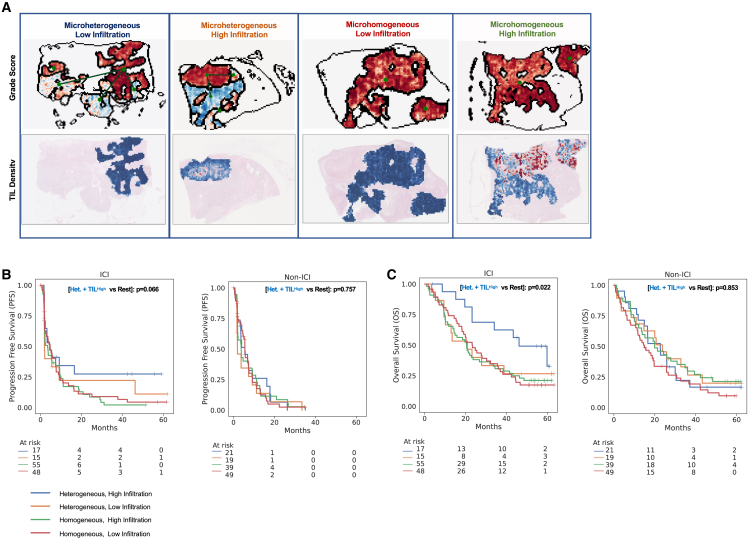
Clear cell renal cell carcinoma (ccRCC) is molecularly heterogeneous, immune infiltrated, and selectively sensitive to immune checkpoint inhibition (ICI). However, the joint tumor-immune states that mediate ICI response remain elusive. We develop spatially aware deep-learning models of tumor and immune features to learn representations of ccRCC tumors using diagnostic whole-slide images (WSIs) in untreated and treated contexts (n = 1,102 patients). We identify patterns of grade heterogeneity in WSIs not achievable through human pathologist analysis, and these graph-based "microheterogeneity" structures associate with PBRM1 loss of function and with patient outcomes. Joint analysis of tumor phenotypes and immune infiltration identifies a subpopulation of highly infiltrated, microheterogeneous tumors responsive to ICI. In paired multiplex immunofluorescence images of ccRCC, microheterogeneity associates with greater PD1 activation in CD8+ lymphocytes and increased tumor-immune interactions. Our work reveals spatially interacting tumor-immune structures underlying ccRCC biology that may also inform selective response to ICI.

Keywords: AI; artificial intelligence; computational histopathology; computer vision; deep learning; immunotherapy; kidney cancer; precision medicine; tumor heterogeneity.


Conflict of interest statement

Declaration of interests T.K.C. reports institutional and personal paid and unpaid support for research, advisory boards, consultancy, and honoraria from Alkermes, AstraZeneca, Aravive, Aveo, Bayer, Bristol Myers-Squibb, Calithera, Circle Pharma, Deciphera Pharmaceuticals, Eisai, EMD Serono, Exelixis, GlaxoSmithKline, Gilead, IQVA, Infinity, Ipsen, Jansen, Kanaph, Lilly, Merck, Nikang, Nuscan, Novartis, Oncohost, Pfizer, Roche, Sanofi/Aventis, Scholar Rock, Surface Oncology, Takeda, Tempest, UpToDate, and CME events (Peerview, OncLive, MJH, CCO, and others), outside the submitted work; institutional patents filed on molecular alterations and immunotherapy response/toxicity and ctDNA; and equity in Tempest, Pionyr, Osel, Precede Bio, CureResponse, and InnDura. T.K.C. serves on the committees of NCCN, GU Steering Committee, and ASCO/ESMO. Medical writing and editorial assistance support may have been funded by communications companies in part. T.K.C. does not report any speaker’s bureau. T.K.C. has mentored several non-US citizens on research projects with potential funding (in part) from non-US sources/foreign components. The institution (Dana-Farber Cancer Institute) may have received additional independent funding of drug companies and/or royalties potentially involved in research around the subject matter. E.M.V.A. reports advisory/consulting with Tango Therapeutics, Genome Medical, Invitae, Monte Rosa, Enara Bio, Manifold Bio, Riva Therapeutics, Serinus Bio, and Janssen; research support from Novartis and BMS; equity in Tango Therapeutics, Genome Medical, Syapse, Manifold Bio, Monte Rosa, Enara Bio, Riva Therapeutics, and Serinus Bio; institutional patents filed on chromatin mutations and immunotherapy response and on methods for clinical interpretation; and intermittent legal consulting on patents for Foaley & Hoag. D.A.B. reports personal fees from LM Education and Exchange, Adnovate Strategies, MDedge, Cancer Network, Cancer Expert Now, OncLive, Catenion, and AVEO and grants and personal fees from Exelixis outside the submitted work. C.L. reports research funding from Genentech/imCORE. Z.B. reports research funding from Bristol-Myers Squibb and Genentech/imCORE and honoraria from UpToDate. S.S. reports grants from Exelixis, grants from Bristol-Myers Squibb, personal fees from Merck, grants and personal fees from AstraZeneca, personal fees from CRISPR Therapeutics, personal fees from NCI, and personal fees from AACR as well as a patent for Biogenex with royalties paid. K.B. has consulted for Related Sciences (RS) outside of the scope of this work. S.R. receives research funding from Bristol-Myers Squibb and KITE/Gilead and is a member of the SAB for Immunitas Therapeutics.

Figures

None
Graphical abstract
Figure 1
Figure 1
A spatially aware deep-learning framework for studying ccRCC (A) Our approach builds a series of biologically relevant prediction models to provide both high-resolution and readily human-understandable representations of ccRCC slide images. The first two models identify tumor tissue and grade phenotype within predicted tumor regions, each using a fine-tuned ResNet-50 convolutional neural network (CNN). A third model identifies tumor-infiltrating lymphocytes (TILs) using a fine-tuned HoVerNet CNN. Local predictions are grouped via watershed segmentation and assembled into graph representations for slide-level description of patients. Computationally inferred patient representations capture both clinically relevant and biologically informative characteristics of ccRCC. (B) Area under ROC curves for the task of distinguishing G2 from G4 in held-out test cohorts. TPR, true positive rate; FPR, false positive rate. (C) Comparison of assigned pathologist grade and grade score on held-out test cohorts (TCGA-KIRC, CM-025) in-house training set used for tumor- and grade-classifier development (DFCI-PROFILE). (D) Kaplan-Meier curves for progression-free interval (PFI) in TCGA-KIRC based on tercile bins of computationally inferred continuous grade score (left) and assigned pathologist grade (right). ∗: p 0.05, ∗∗: p 0.001, ∗∗∗: p 0.0001, ∗∗∗∗: p 0.00001.
Figure 2
Figure 2
Computationally inferred phenotypic variation in ccRCC (A) Representative example of proximally occurring grade microheterogeneity (dashed line indicates interface of region contact). (B) Representative example of distally occurring grade microheterogeneity. (C–E) Summary statistics surrounding microheterogeneity in the TCGA-KIRC and CM-025 cohorts. (C) Number of patients with/without microheterogeneity. (D) Frequency of microheterogeneity by assigned pathologist grade (where available). (E) Distribution of continuous heterogeneity score (f-weighted) in non-homogeneous cases, which describes the extent of microheterogeneity in a given slide.
Figure 3
Figure 3
Linkage between microheterogeneiety and whole-tumor variation (A) Schematic for creating a multi-regional weighted microheterogeneity analysis using computer vision models. (B) Example data collections from four patients, showing RAG plots for the scanned slide of each tissue block. (C) Case-wise frequency of microheterogeneity vs. the maximum observed f-weighted heterogeneity score, which describes the largest extent of heterogeneity observed in a patient. Statistics are aggregated within a given patient’s set of scanned tissue blocks (1 slide per block). (D) Case-wise frequency of microheterogeneity vs. standard deviation of grade score predictions within the same case. Statistics are aggregated within a given patient’s set of scanned tissue blocks (1 slide per block). Pearson’s Rho p values were calculated via exact distribution.
Figure 4
Figure 4
Inferred patterns of grade microheterogeneity associate with improved survival in the CM-025 cohort but only for ICI-treated patients (A) Kaplan-Meier curves for overall survival (OS) and progression-free survival (PFS) in the CM-025 cohort based on the presence of microheterogeneity. Significance values were calculated via log-rank test. (B) Kaplan-Meier curves for OS and PFS in the CM-025 cohort based on the presence of microheterogeneity, stratifying further based on relative grade score within a grade microheterogeneity category. Significance values were calculated via (pairwise) log-rank test.
Figure 5
Figure 5
Combining computationally inferred tumor and immune states identifies a further subset of responders to ICI in the CM-025 trial (A) Representative examples of four classes of patients identified using computational inference, based on the presence of grade microheterogeneity, and the relative abundance of TILs in high-grade tumor regions (TIL density). Top row: representative RAG plots based on grade score (blue: lower score, red: higher score). Bottom row: representative inferred TIL densities (blue: lower infiltration, red: higher infiltration; uncolored: lower-grade regions not considered for TIL density evaluation). (B and C) Kaplan-Meier curves for PFS and OS in both arms of the CM-025 trial based on the groups demonstrated in (A). Significance values were calculated via log-rank test between “microheterogeneous and high infiltration” patients and all remaining patients within a trial arm.
Figure 6
Figure 6
Exploration of microheterogeneity implications in paired multiplexed imaging data (A and B) Representative examples of a microhomogeneous case (A) and a microheterogeneous case (B). H&E Rag: slide-level representation of H&E-inferred tumor and grade properties. mIF local motifs indicates the primary cell type and context present within overlapping 200 pixel windows. mIF immune hotspot: representative example of an area of high tumor-immune interaction density. Cell graph: visualization of tumor and CD8+ cells and their interaction context; edges are drawn between interacting tumor and CD8+ cells (nearest neighbors in a Delaunay triangulation). (C) Comparison of the frequency of tumor-immune interaction within CD8+ cells (left) and tumor cells (right) vs. H&E-inferred microheterogeneity status (TI, “tumor-immune” interaction context). (D) Comparison of the frequency of PD1-high within CD8+ cells that interact with tumor cells vs. H&E-inferred microheterogeneity status. Significance was calculated via Wilcoxon rank-sum test. ∗: p 0.05, ∗∗: p 0.001, ∗∗∗: p 0.0001, ∗∗∗∗: p 0.00001.

Update of

References

    1. Hsieh J.J., Purdue M.P., Signoretti S., Swanton C., Albiges L., Schmidinger M., Heng D.Y., Larkin J., Ficarra V. Renal cell carcinoma. Nat. Rev. Dis. Prim. 2017;3:17009. doi: 10.1038/nrdp.2017.9. - DOI - PMC - PubMed
    1. Gerlinger M., Rowan A.J., Horswell S., Math M., Larkin J., Endesfelder D., Gronroos E., Martinez P., Matthews N., Stewart A., et al. Intratumor heterogeneity and branched evolution revealed by multiregion sequencing. N. Engl. J. Med. 2012;366:883–892. doi: 10.1056/NEJMoa1113205. - DOI - PMC - PubMed
    1. Turajlic S., Xu H., Litchfield K., Rowan A., Chambers T., Lopez J.I., Nicol D., O'Brien T., Larkin J., Horswell S., et al. Tracking Cancer Evolution Reveals Constrained Routes to Metastases: TRACERx Renal. Cell. 2018;173:581–594.e12. doi: 10.1016/j.cell.2018.03.057. - DOI - PMC - PubMed
    1. Mitchell T.J., Turajlic S., Rowan A., Nicol D., Farmery J.H.R., O'Brien T., Martincorena I., Tarpey P., Angelopoulos N., Yates L.R., et al. Timing the Landmark Events in the Evolution of Clear Cell Renal Cell Cancer: TRACERx Renal. Cell. 2018;173:611–623.e17. doi: 10.1016/j.cell.2018.02.020. - DOI - PMC - PubMed
    1. Turajlic S., Xu H., Litchfield K., Rowan A., Horswell S., Chambers T., O'Brien T., Lopez J.I., Watkins T.B.K., Nicol D., et al. Deterministic Evolutionary Trajectories Influence Primary Tumor Growth: TRACERx Renal. Cell. 2018;173:595–610.e11. doi: 10.1016/j.cell.2018.03.043. - DOI - PMC - PubMed

Publication types