. 2023 Sep 19;4(9):101188.
doi: 10.1016/j.xcrm.2023.101188.

Adenosine A2A receptor is a tumor suppressor of NASH-associated hepatocellular carcinoma

Affiliations

Adenosine A2A receptor is a tumor suppressor of NASH-associated hepatocellular carcinoma

Bertrand Allard et al. Cell Rep Med. .

Abstract

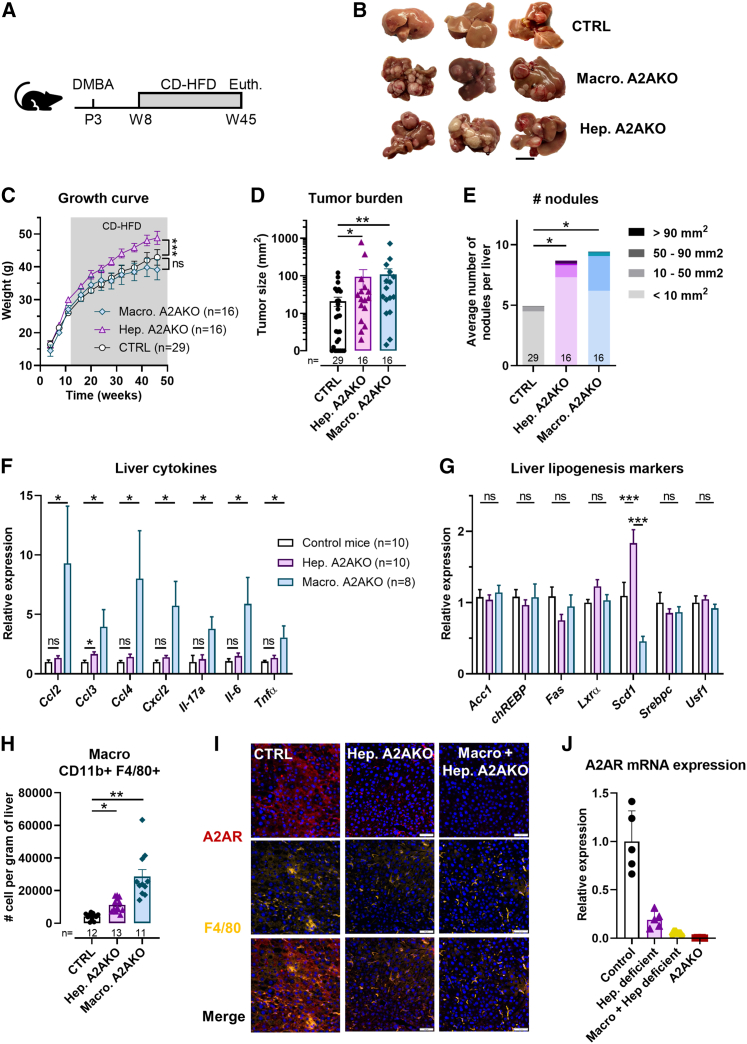
Inhibition of adenosine A2A receptor (A2AR) is a promising approach for cancer immunotherapy currently evaluated in several clinical trials. We here report that anti-obesogenic and anti-inflammatory functions of A2AR, however, significantly restrain hepatocellular carcinoma (HCC) development. Adora2a deletion in mice triggers obesity, non-alcoholic steatohepatitis (NASH), and systemic inflammation, leading to spontaneous HCC and promoting dimethylbenzyl-anthracene (DMBA)- or diethylnitrosamine (DEN)-induced HCC. Conditional Adora2a deletion reveals critical roles of myeloid and hepatocyte-derived A2AR signaling in restraining HCC by limiting hepatic inflammation and steatosis. Remarkably, the impact of A2AR pharmacological blockade on HCC development is dependent on pre-existing NASH. In support of our animal studies, low ADORA2A gene expression in human HCC is associated with cirrhosis, hepatic inflammation, and poor survival. Together, our study uncovers a previously unappreciated tumor-suppressive function for A2AR in the liver and suggests caution in the use of A2AR antagonists in patients with NASH and NASH-associated HCC.

Keywords: A2A receptor; HCC; NAFLD; NASH; adenosine; cancer; immuno-oncology; inflammation.


Conflict of interest statement

Declaration of interests J.S. is a paid consultant, SAB member, and owns stocks in Surface Oncology and received sponsored research grants from Surface Oncology.

Figures

None
Graphical abstract
Figure 1
Figure 1
Development of spontaneous and carcinogen-induced HCC is enhanced in A2AR-deficient mice (A) Experimental setting: WT and A2AR-deficient males were aged to 80 weeks old. Representative pictures of spontaneous HCC observed in WT and A2AR-deficient males are shown. Scale bar represents 2 cm. (B) HCC incidence (observation of macroscopic lesions) in 80-week-old WT and A2AKO males. (C) Hematoxylin and eosin staining of cancerous livers collected from A2AKO mice depicting the different stages of HCC: top panel, stages 1 and 2, and bottom panel, stages 3 and 4; scale bar represents 50 μm. An asterisk (∗) indicates trabeculae that are present in stage II–IV mouse liver tumors. (D) Experimental setting: WT and A2AR-deficient pups were treated with DMBA, 3 to 4 days after birth, and aged until 40 weeks old. (E and F) Liver tumor burden (total tumor area and nodule number) in 40-week-old mice. (G) Experimental setting: WT and A2AR-deficient males were treated with DEN (intraperitoneal [i.p.] 50 mg/kg) at 3 weeks old and aged until 52 weeks old. (H and I) Liver tumor burden (total tumor area and nodule number) in 52-week-old mice. (J) Experimental setting: WT and A2AR-deficient males were treated with DEN (i.p. 50 mg/kg) at 3 weeks old and fed with CD-HFD until 46 weeks old. (K and L) Liver tumor burden (total tumor area and nodule number) in 46-week-old mice. For each experiment, representative pictures of cancerous livers observed in WT and A2AR-deficient males are shown. Results are representative of 1 biological replicate for each HCC model, and sample size is indicated for each panel. Data are presented as means ± SEM. Statistical tests: Mann-Whitney except for (B) (chi-squared test).
Figure 2
Figure 2
Loss of A2AR signaling triggers spontaneous obesity, NASH, and systemic inflammation (A) Weight gain of WT, A2A−/, and A2A+/ mice (males) was monitored weekly starting from week 4 to 32 weeks old. (B) Body composition of 24-week-old WT and A2AKO males. (C) Representative picture of 32-week-old WT and A2AKO mice showing fat accumulation in A2AKO animals. (D) Liver weights of 32-week-old WT and A2AKO males. (E) Hematoxylin and eosin (H&E) staining of livers collected from 32-week-old WT and A2AKO males. Scale bars represent 1 mm (left panels) and 100 μm (right panels). (F) NASH scores of WT and A2AKO livers. (G, H, J, and K) Real-time PCR showing comparative expression of pro-inflammatory cytokines (G), macrophage markers (H), fibrosis markers (J), and lipogenesis markers (K) in WT and A2AKO livers collected from 32-week-old males. (I) WT and A2AKO liver sections were stained with anti-F4/80 antibody to evaluate macrophage density. Representative pictures are shown with F4/80 staining in yellow and DAPI counterstain in blue. Scale bar represents 50 μm. (L) Blood concentration of inflammatory markers in WT and A2AKO mice at 30 weeks of age. Results are representative of 1 biological replicate, and sample size is indicated for each panel. Data are presented as means ± SEM. Statistical tests: Student’s t test or multiple t tests with Benjamin-Hochberg multiple comparison correction.
Figure 3
Figure 3
Myeloid- and hepatocyte-specific deletions of A2AR signaling promotes DMBA-induced HCC development (A) Experimental setting: lyzM-Cre+/− A2ARflox/flox pups (myeloid-specific deficiency) or LyzM-Cre−/− A2ARflox/flox pups were treated with DMBA and switched to CD-HFD from 8 to 45 weeks old. Some LyzM-Cre−/− A2ARflox/flox pups were injected with AAV8-TBG-Cre viruses to generate hepatocyte-specific A2AR-deficient mice. (B) Representative pictures comparing livers of 42-week-old mice with myeloid-specific or hepatocyte-specific deficiency in A2AR signaling. (C–E) Growth curve (C), total liver tumor burden (D), and average number of liver nodules (E) of CD-HFD-fed mice with or without myeloid- or hepatocyte-specific deficiency in A2AR signaling. (F and G) Real-time PCR showing comparative expression of pro-inflammatory cytokines genes (F) or lipogenesis markers (G) in the liver of mice with or without myeloid- or hepatocyte-specific deficiency in A2AR signaling. (H) Abundance of liver-derived CD11b+ F4/80+ macrophages in mice with myeloid- or hepatocyte-specific deficiency in A2AR signaling was analyzed by flow cytometry. (I) Formalin-fixed, paraffin-embedded (FFPE) liver sections from A2AR-proficient (control) mice or mice bearing specific A2AR deficiency on hepatocytes (Hep. deficient) or on hepatocyte and macrophage (macro + hep. deficient) were stained for A2AR (top panels) and F4/80 (middle panels). Bottom panels display merged pictures showing A2AR and F4/80 co-staining. Scale bar represents 50 μm. (J) Measurement of liver A2AR mRNA expression by real-time quantitative PCR (1 biological replicate, n = 5). Results are representative of 1 biological replicate, and sample size is indicated for each panel. Data are presented as means ± SEM. Statistical tests: Student’s t test (C), multiple t tests with Benjamin-Hochberg multiple comparison correction (F–H), or Kruskal-Wallis with Dunn’s correction (D and E).
Figure 4
Figure 4
Exacerbated development of HCC in A2AR-deficient mice is TNF-α, IL-1β, and IL-17A dependent (A) Experimental setting: WT and A2AKO pups were treated with DMBA. At week 20, A2AKO mice were split into 5 groups receiving isotype control antibody or neutralizing monoclonal antibody (mAb) against TNF-α, IL-1β, IL-17A, and IL-6. Mice were sacrificed at 40 weeks old to evaluate tumor burden. (B) Representative pictures showing livers of 40-week-old A2AR-deficient mice treated with isotype control or anti-cytokine neutralizing mAbs. (C) Mice weights at 40 weeks old. (D) Total liver tumor burden. (E) Tumor incidence. (F) Number of macroscopic nodules. Results are representative of 1 biological replicate, and sample size is indicated for each panel. Data are presented as means ± SEM. Statistical tests: multiple t tests with Benjamin-Hochberg multiple comparison correction (C), Kruskal-Wallis with Dunn’s correction (D and F), or chi-squared test (E).
Figure 5
Figure 5
Pharmacological blockade of A2AR signaling promotes HFD-induced obesity and myeloid-derived liver inflammation (A) Growth curve. WT male mice were fed with a CD-HFD and treated daily with KW6002 (10 mg/kg p.o.), CGS21680 (0.5 mg/kg i.p.), or vehicle for a total of 8 weeks. Mice weight was monitored every week. (B) After 8 weeks of treatment, fat mass was measured using an EchoMRI. (C) Growth curve of male C57BL/6 mice fed with a CD-HFD and treated daily with NIR178 (10 mg/kg p.o.) or vehicle. (D) Fat mass measurement after 8 weeks of treatment with NIR178 using an EchoMRI. (E–L) Livers of CD-HFD-fed mice treated with KW6002, CGS21608, or vehicle were collected, and immune infiltrate was analyzed by flow cytometry: (E) CD11b+ myeloid cells, (F) CD11b+ F4/80+ macrophages, (G) CD11b+ Ly6G-Ly6Clow monocytes, (H) CD11b+ Ly6G- Ly6Chigh inflammatory monocytes, (I) CD11b+ Ly6G+ neutrophils, (J) TCRb+ CD4+ T cells, (K) TCRb+ CD8+ T cells, and (L) TCRb+ CD11b+ NKT cells. (M and N) Real-time PCR showing mRNA level of liver-derived cytokines and lipogenesis markers from treated mice. Results are representative of 1 biological replicate, and sample size is indicated for each panel. Data are presented as means ± SEM. Statistical tests: Student’s t test (C and D) or multiple t tests with Benjamin-Hochberg correction (A, B, and E–N).
Figure 6
Figure 6
Diet-induced steatohepatitis impairs the anti-HCC activity of A2AR inhibition (A) Experimental design of the hydrodynamic tail-vein HCC model. (B) Representative pictures of livers collected on mice treated with KW6002 or vehicle subjected to regular chow diet or CD-HFD feeding. (C) Tumor incidence as determined by visualization of macroscopic nodule on livers. (D) Total tumor burden on livers. (E) Liver-to-body weight ratio as a surrogate of total tumor burden. (F) Experimental design: male WT or A2AKO animals were exposed to DEN (50 mg/kg i.p.) at 3 weeks old and fed with a CD-HFD until sacrifice. From weeks 16 to 32, mice were treated daily with KW6002 (10 mg/kg p.o.) or vehicle as indicated. (G) Growth curve of the different group of mice. (H) Total liver tumor burden at sacrifice. (I) Number and size of macroscopic HCC nodules. Results are representative of 1 biological replicate, and sample size is indicated for each panel. Data are presented as means ± SEM. Statistical tests: chi-squared test (C), Mann-Whitney (D, E, H, and I), or Student’s t tests (D).
Figure 7
Figure 7
Reduced ADORA2A expression is associated with poor prognosis in patients with HCC (A) Comparative expression of ADORA2A (RNA sequencing [RNA-seq] data: UCSC Xena platform) in healthy liver (GTEX) and HCC (TCGA LIHC cohort). The blue box shows the bottom 20% of patients with HCC that have low expression of ADORA2A. (B) Forest plot displaying log hazard ratios (logHRs) for ADORA2A association with OS, using a univariate cox proportional hazards regression model. Patients were stratified into “high” and “low” subgroups using the bottom quintile of ADORA2A expression. Statistical significance was set at a false discovery rate (FDR) of 0.05 (dotted horizontal line). Horizontal bars represent the 95% confidence intervals of logHRs. The blue diamond represents the overall effect of ADORA2A expression in patients with HCC. The Z score of the overall effect corresponds to the logHR/standard error of the meta-analysis. (C–F, H, and I) Kaplan-Meier curves showing the prognostic impact of ADORA2A expression in the TCGA HCC cohort, incorporating all patients (C) or patients with alcohol-related HCC (D), virus-related HCC (E), or HCC with no history of primary risk factors (F). In (H) and (I), the prognostic impact of ADORA2A expression was evaluated according to fibrosis severity. Patients were split into ADORA2A-low and -high groups using the bottom quintile of its expression. (G and J) Bar graph comparing fibrosis (G) or inflammation (J) severity in patients with HCC from the TCGA cohort when stratified according to ADORA2A expression; ADORA2A-low and -high patients correspond to the 100 lowest and highest expressors, respectively. (K) Diagnosis slide from an ADORA2A-low HCC patient (TCGA-LIHC) showing bridging fibrosis with the formation of cirrhotic liver nodule. At higher magnification, the picture shows macrovesicular steatosis (∗), ballooned hepatocytes (yellow arrowheads), inflammatory cell foci (red arrowheads), and fibrosis (blue arrowheads). Scale bar represents 100 μm. Statistical tests: Student’s t test (A), log-rank rank (C–F, H, and I), or chi-squared test (G and J).

References

    1. Allard B., Allard D., Buisseret L., Stagg J. The adenosine pathway in immuno-oncology. Nat. Rev. Clin. Oncol. 2020;17:611–629. doi: 10.1038/s41571-020-0382-2. - DOI - PubMed
    1. Fredholm B.B. Adenosine, an endogenous distress signal, modulates tissue damage and repair. Cell Death Differ. 2007;14:1315–1323. doi: 10.1038/sj.cdd.4402132. - DOI - PubMed
    1. Ohta A., Sitkovsky M. Role of G-protein-coupled adenosine receptors in downregulation of inflammation and protection from tissue damage. Nature. 2001;414:916–920. doi: 10.1038/414916a. - DOI - PubMed
    1. Ohta A., Gorelik E., Prasad S.J., Ronchese F., Lukashev D., Wong M.K.K., Huang X., Caldwell S., Liu K., Smith P., et al. A2A adenosine receptor protects tumors from antitumor T cells. Proc. Natl. Acad. Sci. USA. 2006;103:13132–13137. doi: 10.1073/pnas.0605251103. - DOI - PMC - PubMed
    1. Beavis P.A., Divisekera U., Paget C., Chow M.T., John L.B., Devaud C., Dwyer K., Stagg J., Smyth M.J., Darcy P.K. Blockade of A2A receptors potently suppresses the metastasis of CD73+ tumors. Proc. Natl. Acad. Sci. USA. 2013;110:14711–14716. doi: 10.1073/pnas.1308209110. - DOI - PMC - PubMed

Publication types

Substances

Grants and funding