. 2023 Oct 12;186(21):4676-4693.e29.
doi: 10.1016/j.cell.2023.08.027. Epub 2023 Sep 19.

Stepwise emergence of the neuronal gene expression program in early animal evolution

Affiliations

Stepwise emergence of the neuronal gene expression program in early animal evolution

Sebastián R Najle et al. Cell. .

Abstract

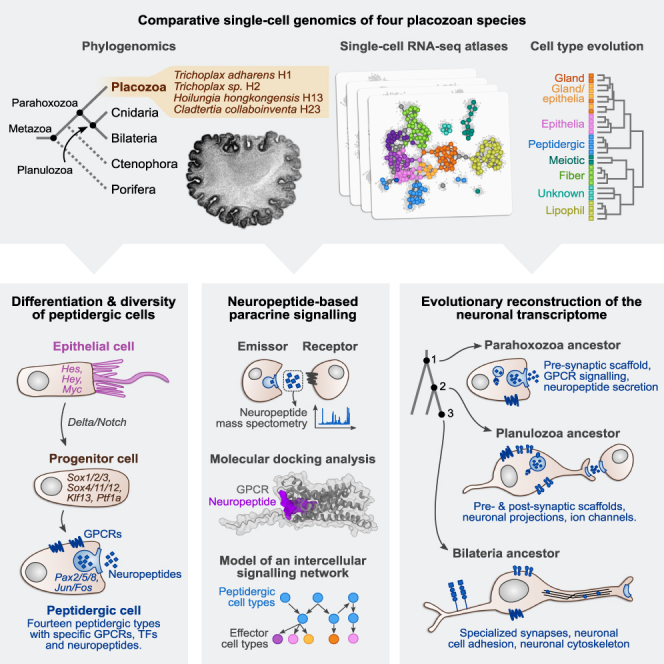
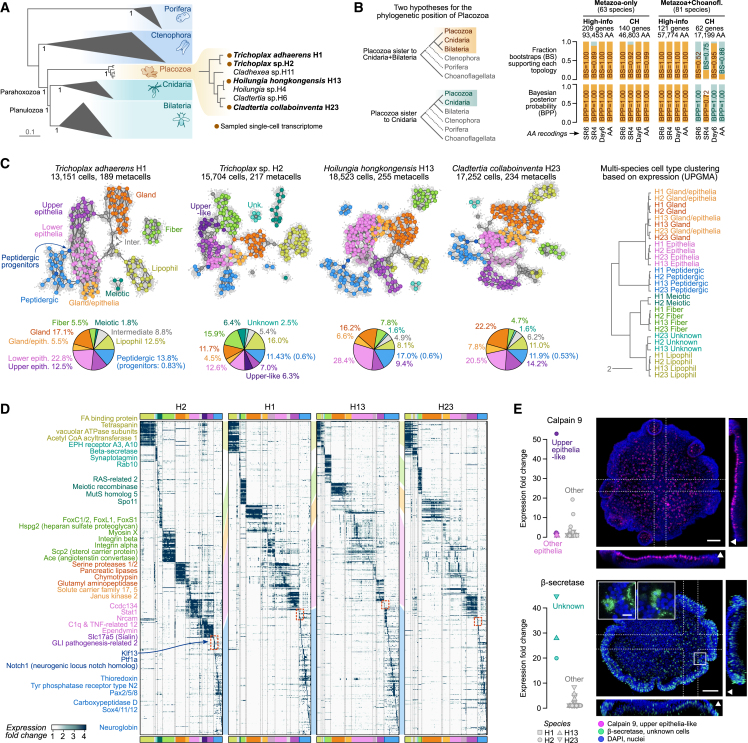
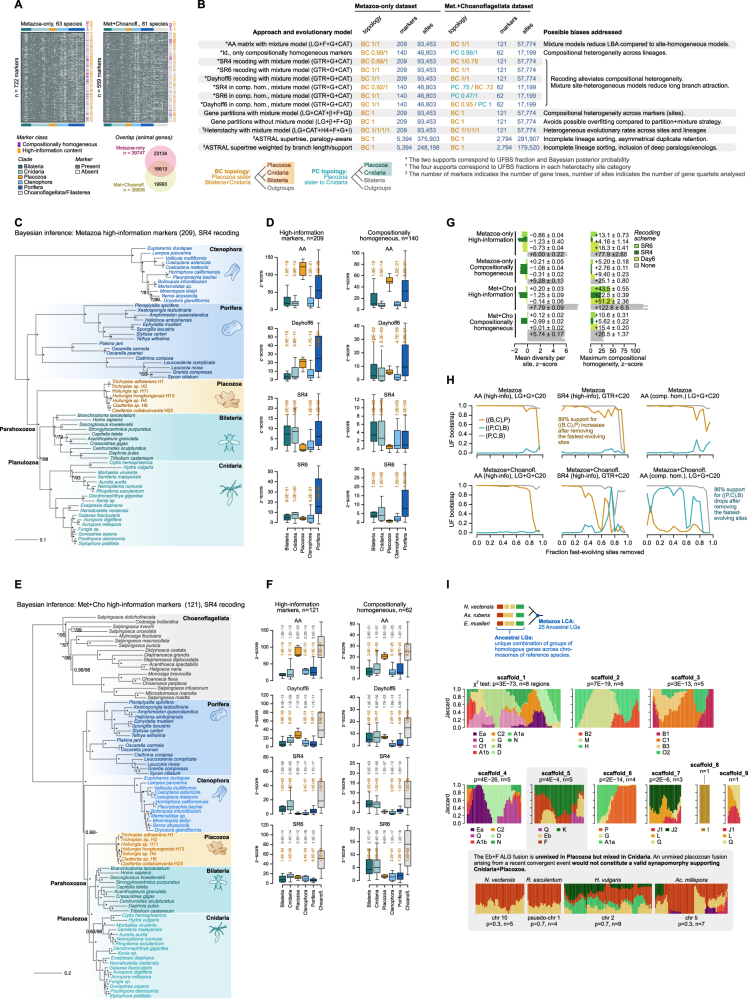
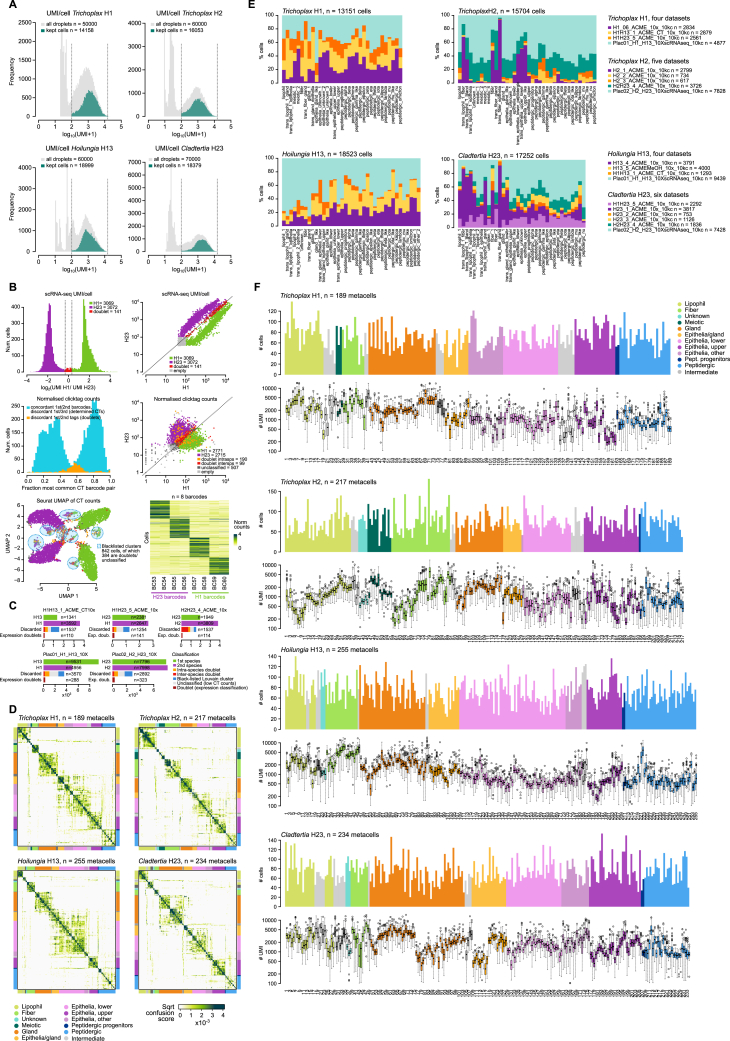
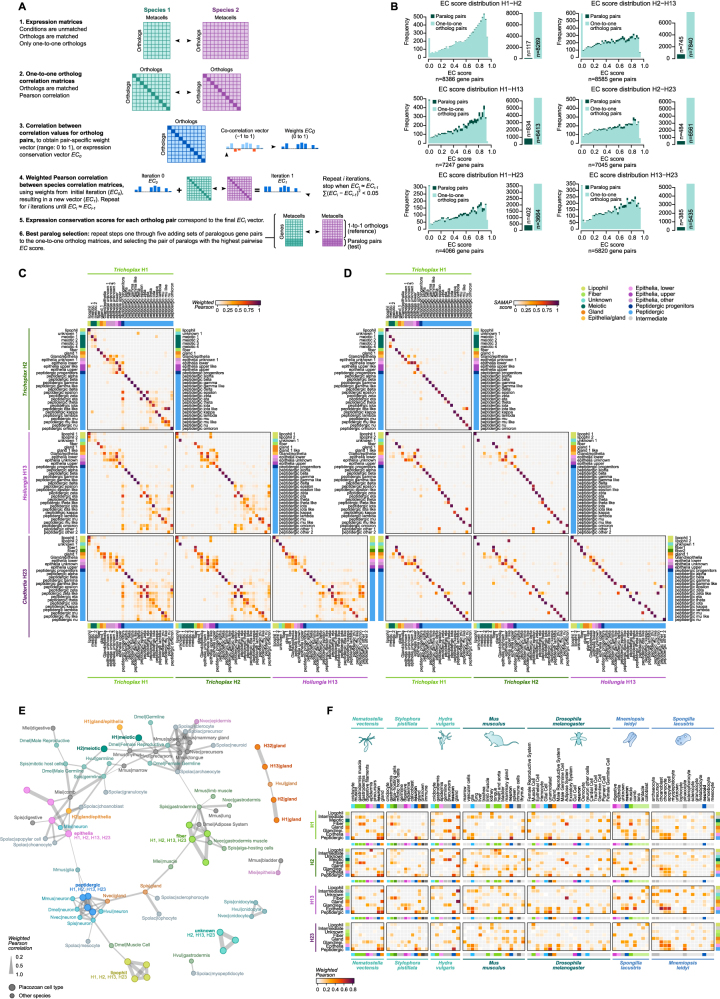
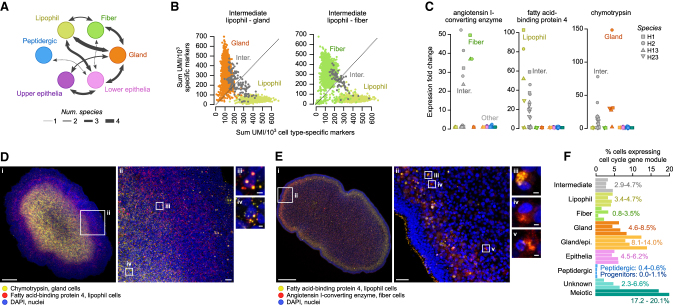
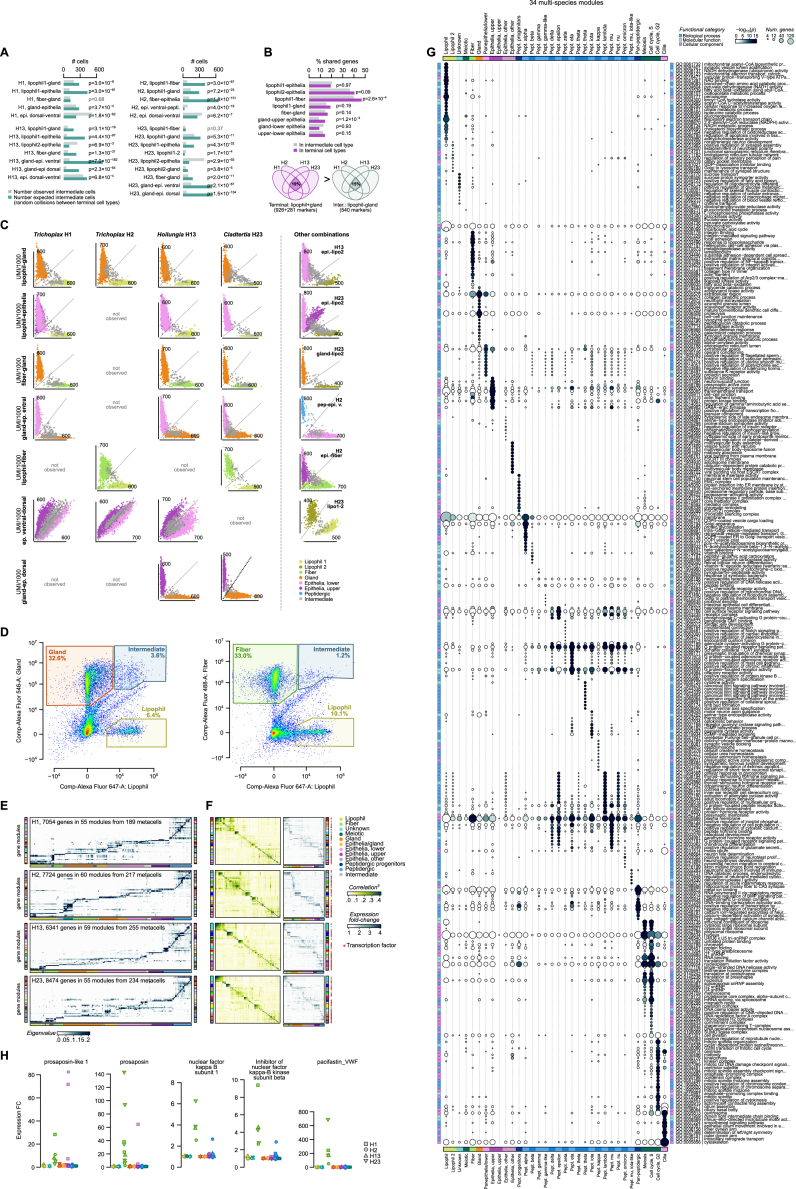
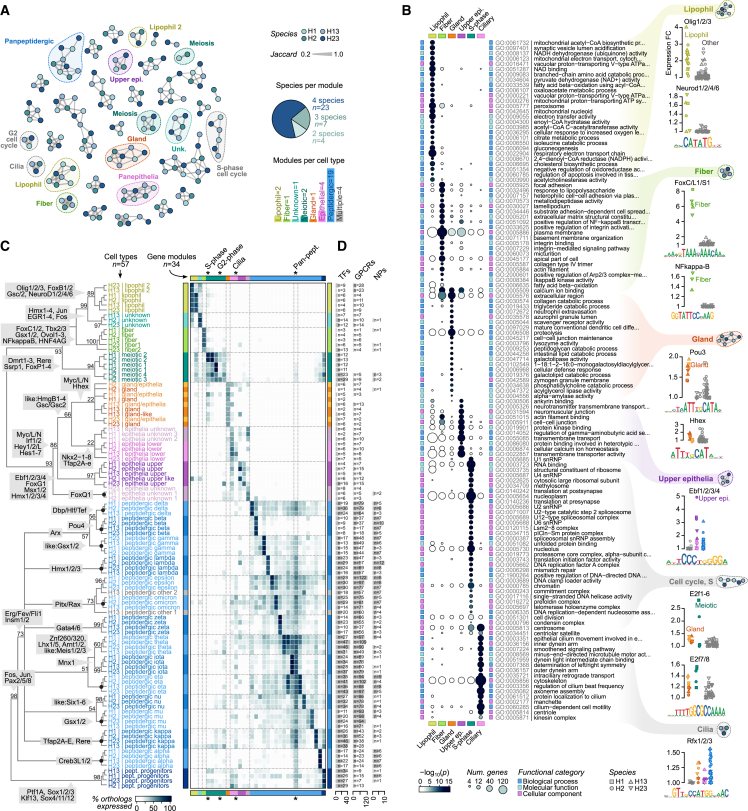
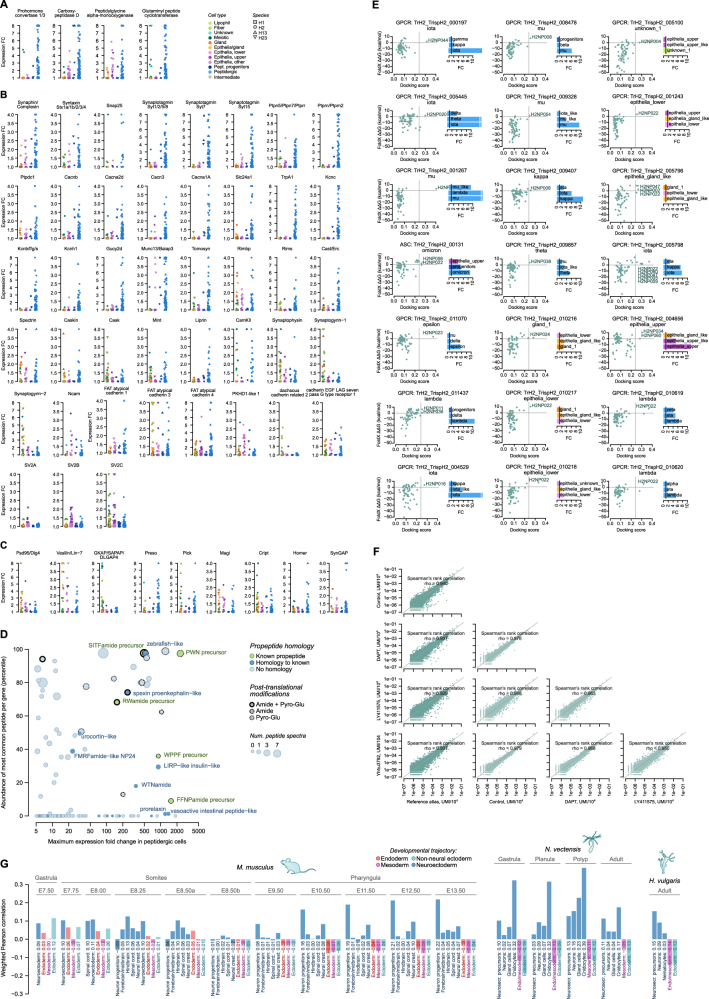
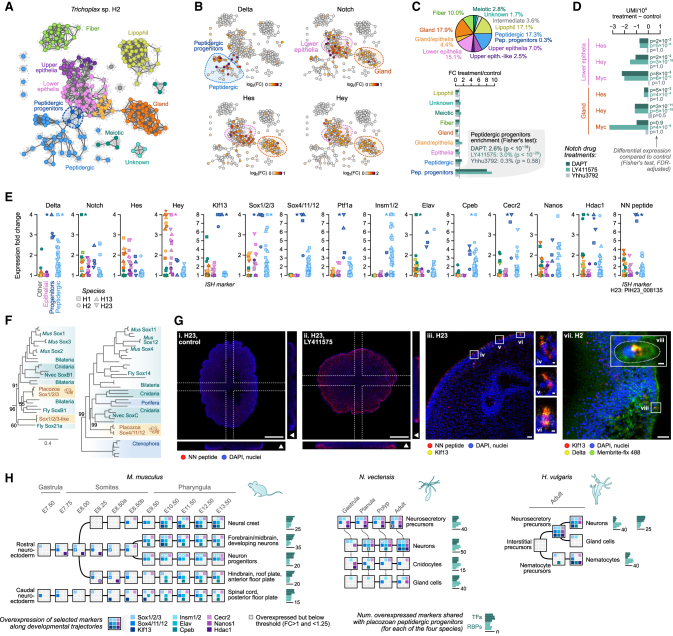
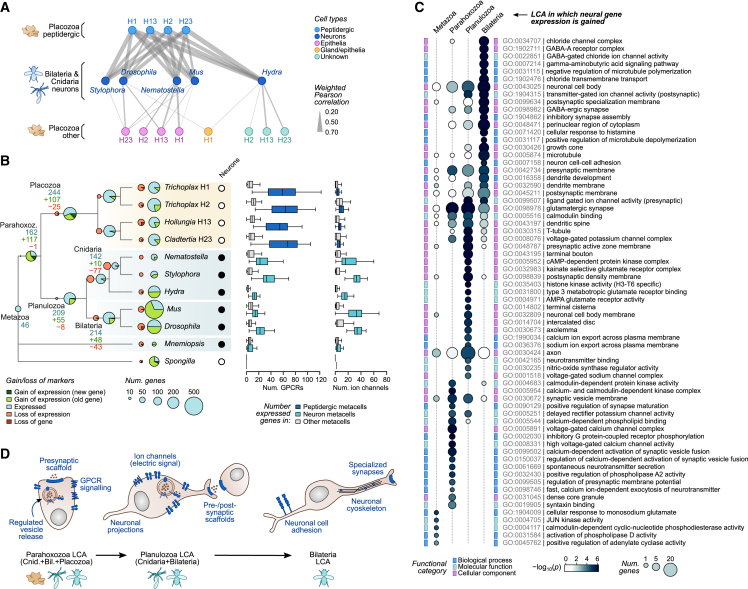
The assembly of the neuronal and other major cell type programs occurred early in animal evolution. We can reconstruct this process by studying non-bilaterians like placozoans. These small disc-shaped animals not only have nine morphologically described cell types and no neurons but also show coordinated behaviors triggered by peptide-secreting cells. We investigated possible neuronal affinities of these peptidergic cells using phylogenetics, chromatin profiling, and comparative single-cell genomics in four placozoans. We found conserved cell type expression programs across placozoans, including populations of transdifferentiating and cycling cells, suggestive of active cell type homeostasis. We also uncovered fourteen peptidergic cell types expressing neuronal-associated components like the pre-synaptic scaffold that derive from progenitor cells with neurogenesis signatures. In contrast, earlier-branching animals like sponges and ctenophores lacked this conserved expression. Our findings indicate that key neuronal developmental and effector gene modules evolved before the advent of cnidarian/bilaterian neurons in the context of paracrine cell signaling.

Keywords: Notch signaling; biodiversity; cell differentiation; chromatin biology; comparative genomics; developmental biology; evolution; neuroscience; phylogenetics; single-cell transcriptomics.


Conflict of interest statement

Declaration of interests The authors declare no competing interests.

Figures

None
Graphical abstract
Figure 1
Figure 1
A multi-species placozoan whole-body cell atlas (A) Consensus phylogenetic tree obtained with Bayesian inference under the CAT + GTR + Г4 mixture model on the Metazoa-only 209-markers concatenated aminoacid matrix recoded into 4 categories (SR4). Bayesian posterior probabilities are indicated as supports in key nodes. The cladogram to the right depicts the phylogenetic relationships among placozoans, highlighting the four species here studied. (B) Summary of the statistical support for alternative phylogenetic positions of Placozoa in the different datasets analyzed: (1) only metazoans (63 species) versus metazoans and choanoflagellates as outgroup (81 species); (2) high-information markers (filtered for tree-likeness score with MARE −d 2 parameter) markers filtered for compositional homogeneity (denoted as CH; markers failing the compositional heterogeneity based on simulated alignments using the LG + Γ4 model in p4, at p > 0.01); and (3) original aminoacid multiple sequence alignments versus recoded alignments with three different schemes (SR4, SR6, and Dayhoff6). (C) 2D projection of metacells for each species sampled in this study and pie charts indicating the relative proportion of cells in each broad cell type category, based on a force-directed layout of the metacell co-clustering graph (see STAR Methods). Right, a broad cell type clustering tree of all four species obtained using the UPGMA average algorithm on Log-Det distance matrices, based on binary ortholog activity in each cell type (fold change ≥ 2). (D) Normalized expression of top variable genes (rows, fold change ≥ 2 with a maximum of 15 genes per metacell) across metacells (columns). Broad cell types are color-coded in the x axis and red squares highlight the peptidergic progenitor metacells. (E) Fluorescent HCR-ISH of Trichoplax sp. H2 specimens showing the expression of an upper epithelia-like marker (calpain-9, top) and the expression of a marker gene for the unknown cell type (β-secretase, bottom). Images correspond to the maximum projection of 183 and 70 optical sections, respectively. The dotted lines indicate the sections used for the extended orthogonal views (45 slices). Arrowheads in the orthogonal views indicate the upper part of the animals. Insets in the bottom image show the detail of cells localized in the rim of the animal. Cells highlighted in the insets were imaged at higher magnification in the portions indicated with a square. Expression of the marker genes is shown to the left of each panel. Scale bars are 50 μm for the general views and 5 μm for the insets. See also Figures S1, S2, and S3.
Figure S1
Figure S1
Additional phylogenomic analyses, related to Figure 1 (A) Occupancy matrices for the Metazoa-only (top) and Metazoa + Choanoflagellata datasets (bottom), indicating whether an individual marker (rows) is present or absent in a given species (columns). For each marker, we indicate whether it has been included in the compositionally homogeneous and high-information content subsets. The Venn diagram (bottom) indicates the number of overlapping and exclusive animal genes in both datasets. (B) Summary table of all phylogenetic analyses performed in this study, specifying the topology supported in each analysis (BC, Placozoa sister to Cnidaria and Bilateria; PC, Placozoa sister to Cnidaria) and their statistical support (for ML analyses, fraction of ultrafast bootstrap supports; for Bayesian analyses, Bayesian posterior probabilities or BPP; for super-tree analyses, ASTRAL posterior probabilities). (C) Consensus phylogenetic tree obtained with Bayesian inference under the CAT + GTR + Г4 mixture model on the Metazoa-only concatenated matrix of high-information content markers (n = 209) recoded into 4 categories (SR4). At each node, we indicate Bayesian posterior probabilities and ultrafast bootstrap supports from a ML analysis (C60 + GTR + Г4 mixture model) on the same dataset, with an asterisk denoting full support (100%). (D) Boxplots representing Z score values of across-taxa compositional homogeneity tests for individual species, grouped into different clades and under different recoding strategies. We evaluated whether placozoans had higher Z score values than other clades with one-sided Wilcoxon tests (p values for each clade above their corresponding boxplots, in orange). (E) Bayesian inference tree obtained using CAT + GTR + Г4 mixture model on the Metazoa + Choanoflagellata concatenated matrix of high-information content markers (n = 121), recoded into 4 categories (SR4). Bayesian posterior probabilities or ultrafast bootstrap supports are indicated at each node, with an asterisk denoting full support (1.0% or 100%, respectively). (F) Same as (C) for the dataset including choanoflagellates as outgroup. Notice in all cases that choanoflagellate Z score values are higher than those of other clades, indicating that choanoflagellate empirical aminoacid frequencies strongly deviated from the null posterior predictive distribution. (G) PhyloBayes posterior predictive tests for model adequacy. Left, barplots representing mean Z score values of per-site aminoacid diversity tests (PhyloBayes-MPI readpb_mpi—div option) for each of the separate chain run. Right, barplots representing mean Z score values of across-taxa compositional homogeneity tests (PhyloBayes-MPI readpb_mpi—comp option) for each of the separate chain run. Numbers indicate mean ± standard deviation of all chains for each dataset. In all cases, the defined burn-ins are the same as for the consensus summary trees (the last 2,000 generations of each chain are employed). (H) Effect of fast-site removal on the support of two phylogenetic hypotheses for Placozoan evolution (sister to Cnidaria and sister to Cnidaria + Bilateria), using the Metazoa and Metazoa + Choanoflagellata datasets. In each case, we removed fast-evolving sites from the high-information markers and reconstructed ML phylogenies with the C20 mixture model. Fast-evolving sites were determined based on their evolutionary rates in the original dataset (per-site rates from IQ-TREE). In all cases, we also display the support for a control, non-controversial node (monophyly of Placozoa, Bilateria and Cnidaria). (I) Ancestral metazoan linkage group signatures along the 9 longest T. adhaerens assembly scaffolds (the placozoan with a most-contiguous genome assembly). Using three non-placozoan species with chormosome-scale assemblies as reference (the cnidarian N. vectensis, the bilaterian Asteria rubens and the sponge Ephydatia muelleri), we identified ancestral linkage groups (ALGs) as unique combinations of co-ocurring gene homologs using the same approach as Simakov et al. Then, we scored the presence of homologs from each ALG along running windows (200 homologous genes, with a 10% steps) in the T. adhaerens scaffolds. We find that T. adhaerens scaffold 5 contains a partially unmixed fusion of ALGs Eb, F, K, and Q, whereas Eb and F ALGs are fully mixed in cnidarians (N. vectensis, Rhopilema esculentum, H. vulgaris, and Acropora millepora), according to χ-square tests of homolog counts for these two ALGs along n non-overlapping windows per chromosome.
Figure S2
Figure S2
scRNA-seq summary statistics, related to Figure 1 (A) Distribution of total RNA molecules per cell in each placozoan sampled. (B) Clicktag (CT) sample demultiplexing statistics for an example experiment mixing T. adhaerens H1 and C. collaboinventa H23. Top left: distribution of relative sizes (in UMI/cell) of each cell when their transcriptome is mapped to each of the multiplexed species (T. adhaerens H1 and C. collaboinventa H23). Top right: UMIs/cell of each cell, classified according to whether its UMI counts are higher in one species or the other, intermediate (doublets), or non-cells (empty droplets). Middle left: fraction of normalized CT counts associated with the most common pair of CT barcodes for each cell, classifying cells in two categories: (1) determined cells, where the first and second most abundant CT barcodes are concordant (from the same sample in the experimental design) but the first and third ones are discordant (from different samples), which represent bona fide cells from a single species; or (2) whether the first and second most abundant CTs are discordant (from different samples), which represent possible doublets. Middle right: distribution of CT counts/cell, classified according to whether its CT counts are concordant for one species or the other (determined cells in the left histogram), intra-species doublets (the discordant first and second barcodes come from different samples of the same species), inter-species doublets (the discordant first and second barcodes come from samples of different species), or unclassified (low CT counts). Bottom left: single-cell uniform manifold approximation and projection (UMAP) projection based on normalized CT counts. We removed cells belonging to Louvain clusters with a high fraction of cells classified as doublets in either the cross-species UMI- or CT-based doublet detection procedures (clusters highlighted in blue). Bottom right, heatmap showing the normalized CT counts per single cell (each sample was labeled with two different barcodes, e.g., BC53 + BC54). (C) Summary of the doublet calls for the five CT datasets. Notice the consistency between cross-species UMI- and CT-based doublet calls (which in addition allow us to identify intra-species doublets). (D) Metacell confusion matrices that represent metacell pairwise similarities derived from the K-nn graph connectivity between all cells in each pair of metacells. Colors indicate the broad cell type classification of metacells. (E) Cell type sample composition. (F) Metacell summary statistics. Barplots indicate the number of cells per metacell. Boxplots indicate the number of transcripts/UMIs per single cell grouped into metacells. Colors indicate the broad cell type classification of metacells.
Figure S3
Figure S3
Cell type comparisons across Placozoa, related to Figures 1 and 7 (A) Schematic representation of the main steps in the ICC algorithm applied to metacells. (B) Distribution of ICC-derived expression conservation (EC) scores for each pair of species and for paralog versus ortholog gene pairs. (C) Heatmaps indicating the EC-weighted Pearson correlation between cell types across placozoans. (D) Same as (C) but showing SAMap scores. (E) Force-directed network of cell type similarity across species, using the weighted Fruchterman-Reingold algorithm. Nodes represent cell types (larger nodes correspond to placozoans, smaller ones correspond to other species), and edges represent pairwise similarities as weighted Pearson correlation coefficients. For each cell type, only the top edges are shown (standardized quantile scores above 0.99). Placozoan nodes are color-coded by cell type. Other metazoan nodes are custom color-coded based on similarity to placozoan cell types. (F) Heatmaps representing the transcriptomic similarity between pairs of cell types of the four placozoan species (rows) compared to seven species from other lineages (columns; including three cnidarians, two bilaterians, one sponge, and one ctenophore). Heatmap color reflects the Pearson correlation score between the expression of genes in each cell type (weighting each gene pair with their expression conservation score in that pair of species, using the ICC procedure).
Figure 2
Figure 2
Intermediate cell states in Placozoa (A) Summary of observed intermediate cells between broad cell types. Arrow thickness indicates the number of placozoan species in which we observed the intermediate state. (B) Classification of single cells according to the expression of lipophil-specific gene markers (x axis) and gland- or fiber-specific gene markers (y axis), measured as the fraction of the total UMIs in those cells corresponding to each gene marker list (see all intermediate single-cell profiles in Figure S4C). (C) Expression of fiber (angiotensin I-converting enzyme), lipophil (fatty acid-binding protein 4) and gland (chymotrypsin) gene markers used for HCR-ISH analysis across the four placozoan species. (D) Fluorescent HCR-ISH of Trichoplax sp. H2 showing the expression of lipophil (fatty acid-binding protein 4, red) and gland-specific (chymotrypsin, yellow) markers. Images correspond to the maximum projection of 21 (Di) and 55 (Dii) optical sections. Image (Dii) was acquired at higher magnification in the portion indicated with a square in image (Di). Images (Diii) and (Div) show the detail of two cells co-expressing both lipophil and gland-specific markers. Scale bars are 100 μm for the general view (Di), 10 μm for the intermediate view (Dii), and 1 μm for the high magnification images (Diii and Div). (E) Same as (D) for the expression of lipophil (fatty acid-binding protein 4, yellow) and fiber-specific (angiotensin I-converting enzyme, red) markers. Images correspond to the maximum projection of 56 (Ei) and 50 (Eii) optical sections. Images (Eiii), (Eiv), and (Ev) show the detail of three cells co-expressing both lipophil and fiber-specific markers. Scale bars are the same as in (D). (F) Percentage of cells in each major cell type inferred to be in active cell cycle, based on the high expression of S-phase or G2-phase cell cycle gene modules (see Figure 3). See also Figure S4.
Figure S4
Figure S4
Characterization of intermediate metacells and gene modules, related to Figures 2 and 3 (A) Barplots representing the number of cells classified in each intermediate category (gray) compared with the number of cells doublets in each category (green) that would be expected given the relative frequency of the terminal cell types in each case. We used two-tailed exact binomial tests to determine whether the observed number of intermediate cells significantly differed from the expectation (p values next to each set of bars). (B) Top, barplots representing the number of genes shared in intermediate metacells between the placozoan species where each cell type is found (gray) compared with the number of genes shared by the respective terminal cell types (green). We used one-tailed exact binomial tests to determine whether the number of genes shared across species was higher for terminal than for intermediate cell types (p values shown for each cell type). Notice that in most cases the difference is small and non-significant, indicating that the genes expressed in intermediate cells are conserved across species and not a stochastic sampling of genes expressed in the respective terminal cell types. Bottom, Venn diagrams detailing the number of shared genes across species for lipophil-1/gland intermediate cells (gray) compared with the shared genes by lipophil-1 and gland cell types (green). (C) Intermediate cells exhibit intermediate transcriptional signatures between their terminal cell types. For each pair of cell type in each species, we show the sum of the fraction of UMIs (per 1,000 UMIs) of the top markers (FC ≥ 2). Panels are arranged to indicate the detection of specific intermediate cell types (rows) in each of the species (columns). (D) Flow cytometry scatterplots of Trichoplax sp. H2 cells labeled by HCR-ISH against markers specific for lipophil (fatty acid-binding protein 4, Alexa Fluor-647), gland (chymotrypsin, Alexa Fluor-546) and fiber (angiotensin I-converting enzyme, Alexa Fluor-488) cells. Selected areas in each panel denote the percentage of cells with single or double label, which would correspond to intermediate cells. (E) Heatmaps representing the eigengenes across metacells of gene modules calculated using WGCNA in each placozoan. x axis colors indicate the broad cell type classification of metacells. Module colors (y axis) are arbitrary. (F) Left, gene-gene expression correlation matrix, grouping genes into the same modules as in (E). Right, normalized expression across metacells of genes grouped into modules. Transcription factors are highlighted with a dot to the right of the heatmap. Notice the presence of “lateral” gene modules expressed in individual metacells across cell types. These include, for example, the cell cycle and ciliary apparatus modules. (G) Top 10 gene ontology terms enriched in each multi-species gene module. x axis colors indicate the cell type where each module is most active (manual curation). (H) Fold-change expression of selected genes with immune-related functions across cell types of all four placozoans.
Figure 3
Figure 3
Placozoan gene expression programs (A) Multi-species clustering of gene modules across placozoans. Each node represents a gene module (group of genes co-expressed across metacells; see Figures S4E–S4G), and each node is color-coded according to the species. Edges link modules sharing orthologs across species, and their width reflects the Jaccard index of ortholog overlap between modules (only edges with Jaccard ≥0.125 are shown). We curated 34 multi-species modules, the majority of which are composed of modules from four species (pie plot). Most modules are specific to individual cell types (bar plot), with the exception of cross-cell type modules that include genes related to pan-peptidergic cells, cell cycle (S-phase and G2-phase), meiosis, and the ciliary apparatus. (B) Gene ontology enrichments in selected gene modules (left), and expression of transcription factor (TF) regulators and associated enriched motifs (right). (C) Left, multi-species clustering of non-peptidergic (top) and peptidergic cell types (bottom). The cell type tree has been obtained as in Figure 1C. Gray boxes list selected TFs specific to various cell type clades. Right, heatmap depicting the fraction of orthologous genes from each gene module expressed across cell types. Modules have been color-coded according to their cell type specificity, with the cross-cell type modules highlighted with asterisks. (D) Number of TFs, GPCRs, and neuropeptides (NPs) expressed (fold change ≥ 2) in each cell type. See also Figures S4, S5, and S6.
Figure S5
Figure S5
Placozoa chromatin landscapes, related to Figure 3 (A) Summary statistics of ATAC experiments. From left to right: number of reads, fraction of reads mapped in the genome, fraction of duplicated reads (based on mapping coordinates of read pairs), fraction of nucleosome-free reads (that are used for cis-regulatory element/peak calling), and fraction of reads in peaks. (B) ATAC-seq fragment size distribution. The line indicates the cutoff used to define nucleosome-free reads. (C) Transcription start site (TSS) metaplots for ATAC-seq nucleosome-free reads (NFRs) and H3K4me2/H3K4me3 ChIP-seq signal. (D) Frequency of regulatory elements (REs) around the TSS. (E) Distribution of number of REs per gene (left), and the average number of REs in various gene categories (right; values indicated a mean ± standard deviation). (F) Association of ATAC-seq peaks and H3K4me3 ChIP-seq peaks with different genome-wide features.
Figure S6
Figure S6
Transcription factor binding motif analysis, related to Figure 3 Motif archetype enrichment in the REs associated to genes belonging to each of the 34 multi-species gene modules. Dot color indicates the intensity of the enrichment fold change between the counts of each motif in that gene module’s genes (including only motifs with an alignment score higher than the 98th quantile of their genome-wide alignment score distribution), and using genes associated to other modules as background; dot size indicates the p value of a hypergeometric enrichment test, adjusted using a false discovery rate. Up to 20 marker archetypes with FC ≥ 1.5 are shown per module. The structural class of each motif archetype, as inferred from known motifs similar to it, is shown next to each motif (colored squares). Selected motif archetypes (scaled to information content) are shown next to the heatmap. The motifs labeled with gene names (Neurod1/2/4/6, Olig1/2/3, NF-κB, FoxC/L1/S1, Pou3, Hhex, E2F1–6, and E2F7/8) correspond to genes shown in Figure 3B.
Figure 4
Figure 4
Genetic basis of cell type evolution in Placozoa (A) Aligned genomic region exemplifying different categories of regulatory element (RE) conservation. Each RE is classified according to two criteria: across-species conservation (ancestral/novel) and intra-species sequence dynamics (conserved/neutral/accelerated). (B) Ancestral reconstruction of RE evolution across Placozoa. In extant nodes, REs are classified according to their sequence conservation/acceleration status. (C) Rates of evolution in the transcriptional and regulatory profiles of matched cell types across all four placozoans. For each cell type, we recorded the fraction of specific markers (genes expressed at FC ≥ 1.5) that were gained or lost at least once along the placozoan phylogeny (y axis) and compared them (x axis) with the rate of active RE gain + loss along the same branches (top) or to the fraction of active REs that exhibited signatures of accelerated evolution (x axis, bottom, at phyloP < 0.001) in extant species (bottom). (D) The impact of RE sequence dynamics in gene expression conservation, comparing Trichoplax adhaerens H1 to the other three placozoans. Left, boxplot comparing the expression conservation score of orthologous genes with shared ancestral REs to those of genes with novel REs. Right, boxplot comparing the expression conservation of orthologs with slow-evolving REs to orthologs with one or more accelerated RE. We used one-sided Wilcoxon rank sum tests to test for significant differences in the EC score distributions (p values below each pair of boxplots). (E) Same as (D) but comparing TF-binding motif usage similarity (Spearman correlation of gene-wise maximum motif alignment score). (F) Evolutionary dynamics of various genetic determinants of cell identity at increasing evolutionary distances. The boxplot represents the fraction of shared features for each matched cell type and from the perspective of T. adhaerens H1. Compared features include: conserved genes (genes expressed in a given T. adhaerens cell type with an ortholog in the genome of the other species or reconstructed ancestor), conserved REs (likewise, using sequence conservation of orthologous REs), active genes (genes expressed in a given cell type in both T. adhaerens H1 and the other species), active REs (REs linked to genes expressed in a given cell type in both T. adhaerens H1 and the other species), and used motifs (TF-binding motifs enriched in both T. adhaerens H1 and the other species). The cladogram shows the time-calibrated distances. (G) Distribution of the correlations in gene expression and TF-binding motifs across cell types (both measured as fold-change enrichments) between T. adhaerens H1 and the three other placozoans.
Figure 5
Figure 5
Diversity of peptidergic cell types in placozoans (A) Combinatorial expression of TFs across four placozoans. Dots indicate that a given TF has been inferred to be specifically expressed (FC ≥ 1.5) in a given peptidergic type at the last common ancestor of placozoans (based on Dollo parsimony). (B) Schematic representation of the pre-synaptic scaffold components expressed in placozoan peptidergic cells. Individual gene expression plots for the four species are shown in Figure S7. (C) Identification of Trichoplax sp. H2 small peptides. Scatter plot shows the maximum expression of the propeptide gene in any peptidergic cell type (x axis) compared with the abundance of the most common peptide per propeptide as measured by mass spectrometry (y axis). Dot sizes indicate the number of spectra identified for the most common peptide per propeptide. The color code indicates homology of the propeptide and dot border lines indicate the identification of peptide post-translational modifications. Motifs represent aminoacid frequencies around peptides. (D) Combinatorial expression of neuropeptides (NPs) and their putative receptor gene families (GPCRs and amiloride-sensitive channels [ASCs]) in peptidergic cell types across four placozoans. In the NP map, known peptides (green) or new, hypothetical peptides with homology to previously described NPs (blue) are indicated. In the GPCR map, genes with no orthologs in other animal phyla (i.e., Placozoa-specific families) are indicated (orange), whereas known families are indicated by name. (E) Network of hypothetical interactions between cell-type-specific small peptides and receptors (GPCRs and ASCs). Gray nodes indicate small peptides with an indication of the aminoacid sequence and of peptidergic cell type expressing their propeptide. The colored nodes represent receptors (GPCRs as circles and ASCs as triangles), and are color-coded according to their cell type specificity. Arrows represent hypothetical compatible interactions between NPs and receptors based on the joint three-dimensional modeling of the docked peptides for all NP-receptor combinations. In brief, we have considered all interactions with high docking scores (pDockQ > 0.23) and a positive change in ΔΔG values between the wild-type and a mutated version of the NP (FoldX ΔΔG > 0 kcal/mol; see STAR Methods for details and Table S5 and Figure S7E for a complete list of all positive interactions). An example model of a positive docking is shown at the right, including its AlphaFold prediction (receptor residues colored according to the model accuracy using the predicted local distance difference test or pLDDT score). (F) Schematic hypothetical network of cell type signaling interactions based on the inferred NP-receptor pairs from (E). This is a hypothetical model based on predicted affinities between a partial set of NPs and only a subset of all hypothetical receptors (cell-type-specific GPCRs and ASCs), and is therefore partial, leaving certain cell types unconnected (e.g., fiber and lipophil). See also Figure S7.
Figure S7
Figure S7
Peptidergic cell transcriptional profiles, related to Figures 5 and 6 (A) Expression fold change (FC) of neuropeptide-processing enzymes across species and cell types. Cell types are grouped in four categories, from right to left: peptidergic (light blue), peptidergic progenitors (dark blue), epithelial, and others. Species are indicated with different shapes. (B) Same as (A) for pre-synaptic scaffold genes. (C) Same as (A), for post-synaptic scaffold genes. (D) Identification of H. hongkongensis H13 small peptides. Scatterplot shows the maximum expression of the propeptide gene in any peptidergic cell type (x axis) compared to the abundance of the most common peptide per propeptide as measured by mass spectrometry (y axis). Dot sizes indicate the number of spectra identified for the most common peptide per propeptide. The color code indicates homology of the propeptide and dot border lines indicate the identification of peptide post-translational modifications. (E) Scatterplots showing the two docking scoring metrics (see STAR Methods) for positive docking peptide receptor pairs shown in Figure 5E. Barplots on the right show the expression pattern for the corresponding receptor (only for cell types with FC ≥ 1.5). (F) Comparison of global gene expression levels for the three Trichoplax sp. H2 Notch signaling drug treatments (plus DMSO control sample) compared with the reference Trichoplax sp. H2. Scatterplots show the normalized UMI counts per gene in each sample. The Spearman correlation for each comparison is indicated. (G) Expression similarity between placozoan peptidergic progenitor cells (H2 pooled dataset) and cell types assigned to various developmental trajectories in other species (mouse, N. vectensis and H. vulgaris), measured as weighted Pearson correlation coefficients of cell type-level FC values. Gene markers were selected from ICC-defined ortholog pairs belonging to predicted transcriptional regulator gene families (transcription factors, chromatin regulators, and RNA-binding proteins), and we restricted the analysis to genes with variable expression in both datasets (FC ≥ 1.25 in at least one cell type in both the placozoan reference and the query dataset, totaling 73–207 genes in mouse, 172–367 in N. vectensis, and 318 in H. vulgaris). For each developmental trajectory (the various neuroectodermal lineages shown in Figure 6H, plus endoderm, mesoderm, non-neural ectoderm, and endo/mesoderm), we report the the correlation with the most similar cell type in each combination of developmental stage and lineage.
Figure 6
Figure 6
Molecular signatures of neurogenesis in placozoans peptidergic cell progenitors (A) 2D projection of metacells of a Trichoplax sp. H2 single-cell pooled transcriptome of individuals grown under four conditions: treatment with the Notch antagonists DAPT (3,453 cells) and LY411575 (4,666 cells), the Notch signaling agonist Yhhu3792 (5,114 cells), and an untreated control (4,765 cells). Metacells have been color-coded by broad cell type based on comparison to the reference Trichoplax sp. H2 dataset (Figure 1C). (B) Normalized expression of Delta, Notch, Hes, and Hey in the 2D projection of Trichoplax sp. H2 metacells. (C) Pie plot with cell type proportions among the control cells (top) and fold-change enrichment in cell type fractions for each drug treatment (bottom). p values from a two-sided Fisher’s exact test of cell type counts relative to the control. (D) Differential expression of the Hes, Hey, and Myc TFs in lower epithelial and gland cells (two cell types with broad Notch expression), measured using the difference in UMIs/104 between treatment and control. p values indicate significant differential expression based on a two-sided Fisher’s exact test on UMI counts. (E) Expression of selected marker genes related to peptidergic progenitor specification across all four placozoans, including markers used for HCR-ISH experiments. p values from an FDR-adjusted two-sided Fisher’s exact test of UMI counts in a given cell type, relative to the control. (F) Sox TF maximum likelihood phylogenetic analysis supporting the orthology of placozoan Sox1/2/3 and Sox4/11/12. (G) Left, fluorescent HCR-ISH of C. collaboinventa H23 showing the expression of the peptidergic progenitor-specific marker HoiH23_PlH23_008135 (NN peptide, red) in animals with (Gii) and without (Gi) treatment with 10 μM LY411575 for 24 h. Images are maximum projections of 50 (Gi) and 40 (Gii) optical sections. The dotted lines indicate the sections used for the extended orthogonal views (40 slices). Arrowheads in the orthogonal projections indicate the upper part of the animals. Middle, fluorescent HCR-ISH of C. collaboinventa H23 (Giii and Gvi) showing the expression of the peptidergic progenitor-specific markers HoiH23_PlH23_008135 (NN peptide, red) and Klf13 (yellow). Image (Giii) is a maximum projection of 22 optical sections. Images (Giv) to (Gvi) highlight the detail of three individual cells expressing both markers and correspond to the squared sections of image (Giii). Right, fluorescent HCR-ISH of Trichoplax sp. H2 (Gvii and Gviii) showing the expression of the peptidergic progenitor-specific markers Klf13 (red) and Delta receptor (yellow). Image (Gvii) is a maximum projection of 16 optical sections. Inset (Gviii) highlights the detail of a cell expressing both markers. Dotted line depicts the shape of the cell as delineated by the membrane marker (green). Scale bars correspond to 100 μm in i and ii, 10 μm in (Giii) and (Gviii), and 1 μm for (Giv)–(Gvi) and (Gviii). (H) Expression of selected TFs, RNA-binding proteins and chromatin factors specific to placozoan peptidergic progenitors (E) along the neural developmental trajectories described in scRNA-seq experiments in M. musculus (gastrula to pharyngula stage44), N. vectensis (gastrula to adult45), and Hydra vulgaris (regenerating adult46). Genes with expression FC ≥ 1.25 in any cell type of a given developmental trajectory are indicated as colored squares in each (overexpressed genes with FC > 1 and < 1.25 in stages intermediate between two other stages are indicated with a white asterisk). For each developmental trajectory, we also indicate the number of orthologous TFs and RBPs shared with each placozoan species (barplots to the right). See also Figure S7.
Figure 7
Figure 7
Stepwise evolutionary emergence of the neuronal gene expression program (A) Network summarizing pairwise similarities (weighted Pearson correlation) between neurons from cnidarians and bilaterians (middle) with placozoan cell types (top and bottom). Only similarities above 0.2 are shown. All pairwise cell type similarities across phyla are shown in Figure S3E. (B) Left, ancestral state reconstruction of neuronal gene expression programs across Metazoa. Pie charts indicate presence, gains and losses at each extant or ancestral node. Ancestral nodes are inferred using Dollo parsimony. Neuronal genes in each species are selected from single-cell atlases as having a FC ≥ 2 in at least 25% of the metacells annotated as neurons/neuron-like cells. Right, number of GPCRs and ion channels expressed in neuronal/neuronal-like metacells (threshold FC ≥ 2) versus non-neuronal metacells. (C) Gene ontology enrichments of gene gains in ancestral gene expression programs, based on annotations of the mouse orthologs. (D) Schematic representation of the major functional gains in the neuronal gene expression programs in early animal evolution. See also Figure S3.

Similar articles

Cited by

References

    1. Brunet T., King N. The origin of animal multicellularity and cell differentiation. Dev. Cell. 2017;43:124–140. doi: 10.1016/j.devcel.2017.09.016. - DOI - PMC - PubMed
    1. Sebé-Pedrós A., Degnan B.M., Ruiz-Trillo I. The origin of Metazoa: a unicellular perspective. Nat. Rev. Genet. 2017;18:498–512. doi: 10.1038/nrg.2017.21. - DOI - PubMed
    1. Arendt D., Musser J.M., Baker C.V.H., Bergman A., Cepko C., Erwin D.H., Pavlicev M., Schlosser G., Widder S., Laubichler M.D., et al. The origin and evolution of cell types. Nat. Rev. Genet. 2016;17:744–757. doi: 10.1038/nrg.2016.127. - DOI - PubMed
    1. Brunet T., Fischer A.H.L., Steinmetz P.R.H., Lauri A., Bertucci P., Arendt D. The evolutionary origin of bilaterian smooth and striated myocytes. eLife. 2016;5:1–24. doi: 10.7554/eLife.19607. - DOI - PMC - PubMed
    1. Grau-Bové X., Torruella G., Donachie S., Suga H., Leonard G., Richards T.A., Ruiz-Trillo I. Dynamics of genomic innovation in the unicellular ancestry of animals. eLife. 2017;6:1–35. doi: 10.7554/eLife.26036. - DOI - PMC - PubMed

Publication types