. 2023 Oct 23;33(20):4312-4329.e6.
doi: 10.1016/j.cub.2023.08.069. Epub 2023 Sep 19.

Apical PAR protein caps orient the mitotic spindle in C. elegans early embryos

Affiliations

Apical PAR protein caps orient the mitotic spindle in C. elegans early embryos

Naomi J Stolpner et al. Curr Biol. .

Abstract

During embryonic development, oriented cell divisions are important for patterned tissue growth and cell fate specification. Cell division orientation is controlled in part by asymmetrically localized polarity proteins, which establish functional domains of the cell membrane and interact with microtubule regulators to position the mitotic spindle. For example, in the 8-cell mouse embryo, apical polarity proteins form caps on the outside, contact-free surface of the embryo that position the mitotic spindle to execute asymmetric cell division. A similar radial or "inside-outside" polarity is established at an early stage in many other animal embryos, but in most cases, it remains unclear how inside-outside polarity is established and how it influences downstream cell behaviors. Here, we explore inside-outside polarity in C. elegans somatic blastomeres using spatiotemporally controlled protein degradation and live embryo imaging. We show that PAR polarity proteins, which form apical caps at the center of the contact-free membrane, localize dynamically during the cell cycle and contribute to spindle orientation and proper cell positioning. Surprisingly, isolated single blastomeres lacking cell contacts are able to break symmetry and form PAR-3/atypical protein kinase C (aPKC) caps. Polarity caps form independently of actomyosin flows and microtubules and can regulate spindle orientation in cooperation with the key polarity kinase aPKC. Together, our results reveal a role for apical polarity caps in regulating spindle orientation in symmetrically dividing cells and provide novel insights into how these structures are formed.

Keywords: Caenorhabditis elegans; PAR proteins; cell polarity; embryo polarity; mitotic spindle orientation.


Conflict of interest statement

Declaration of interests The authors declare no competing interests.

Figures

Figure 1:
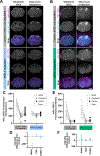
Figure 1:. PAR-3 apical caps localize near centrosomes and are dynamic during the cell cycle
A. Cartoon of 8-cell embryos with left and right sides shown. Left AB blastomeres are outlined with yellow dashed lines and Right AB blastomeres are outlined in red dashed lines. Arrows indicate the Anterior/Posterior (A/P) and Dorsal/Ventral (D/V) axes, all laterally mounted embryos will be displayed with anterior to the left and dorsal at the top. Note that the ABal cell is visible from both sides due its position within the embryo. B. Time-lapse montage of embryo expressing mNG::PAR-3 and mCh::Tubulin from left side, max projections starting just after the ABxx cells are born. This embryo was imaged from the left side; the top two blastomeres, with mNG::PAR-3 signal at t = −9.5 min, are the ABxl blastomeres. Time is indicated relative to Nuclear Envelope Breakdown (NEBD). Scale bar represents 10 μm. C. Midplane slices & maximum projections of mNG::PAR-3 and TPXL::Sc (centrosome marker). This embryo was viewed from the right side; ABal, ABar and ABpr are visible as top-left three cells mNG::PAR-3 signal. Scale bar represents 10 μm. D. Time-lapse montage of embryo expressing PAR-3::mNG and mCh::Tubulin, mounted en-face dorsally with the ABal blastomere in view. Montage starts just after ABxx cells are born, displayed every 45 seconds. Scale bar represents 5 μm. See also: Videos S1–S2.
Figure 2:
Figure 2:. Loss of PAR-3 causes a spindle orientation defect
A. Cartoon workflow of blastomere explant experiment. 2-cell embryos were dissociated to separate the AB cell from P1. AB was allowed to divide into ABx, then mounted and imaged through the next two cell divisions. Explants are named by the AB blastomere number in the cluster and which corresponding embryo stage they are equivalent to, displayed in purple boxes above each step. B. Representative images of 4AB/8 blastomere explants from wild-type mNG::PAR-3 embryo and PAR-3::ZF1::GFP embryo. In PAR-3::ZF1::GFP, blastomere explant is outlined in white. Scale bars represent 10 μm. C. Images from time-lapse live recordings of blastomere explants from wild-type (mNG::PAR-3; TPXL-1::mSc) and PAR-3::ZF1::GFP (PAR-3::ZF1::GFP; TPXL-1::mSc) imaged from 4AB/8 to 8AB/12 stage. DIC single plane images and TPXL-1::mSc maximum projections representative of the majority of the dataset are shown. Arrowheads point to cells without neighbors. Scale bars represent 10 μm. D. Phenotype scoring of 8AB/12 blastomere explants shown in (C). Images were blinded and scored based on whether the blastomere explant was organized/spherical or disorganized/had cells protruding from the cluster. E. TPXL-1::mSc maximum projection images from time-lapse live full-volume imaging of wild-type (mNG::PAR-3; TPXL-1::mSc) and PAR-3::ZF1::GFP (PAR-3::ZF1::GFP; TPXL-1::mSc) embryos. Right side is displayed, three ABxx cells are visible along the top and left of the embryo. The cells are outlined (colors match Figure 1) at times when centrosome positioning defects were observed. Time is shown relative to nuclear envelope breakdown (NEBD). Scale bars represent 10 μm. F. Quantification of spindle angle over time in AB blastomeres. Full-volume images were displayed in 3D, and centrosomes were annotated manually. X, Y, and Z coordinates were used to determine the XY and XZ angles of the spindle relative to the embryo’s AP axis over time, starting from the beginning of centrosome separation until NEBD. Time is shown relative to NEBD. See also: Figure S1, Videos S3–S4.
Figure 3:
Figure 3:. aPKC degradation causes a spindle orientation defect
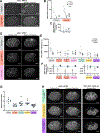
A. aPKC localization in wild-type (mNG::aPKC; TPXL-1::mSc) and ZF1::GFP::aPKC (ZF1::GFP::aPKC; TPXL-1::mSc) 4AB/8 blastomere explants as in figure 2. In ZF1::GFP::aPKC, blastomere explant is outlined in white. Scale bars represent 10 μm. B. Representative images of 4AB/8 blastomere explants from wild-type mNG::aPKC embryo and ZF1::GFP::aPKC embryo. Wild-type data is the same as in Figure 2, shown again to facilitate comparison. Arrowheads indicate cells protruding from the cluster. Scale bars represent 10 μm. C. Phenotype scoring of 8AB/12 blastomere explants shown in (B). Dataset was blinded and scored based on whether the blastomere explant was organized/spherical or disorganized/had cells protruding from the cluster. Wild type data is the same as in Figure 2D and is shown here for clarity. D. TPXL-1::mSc maximum projection images from time-lapse live full-volume imaging of wild-type (mNG::aPKC; TPXL-1::mSc) and ZF1::GFP::aPKC (ZF1::GFP::aPKC; TPXL-1::mSc) embryos. Right side is displayed, three ABxx cells are visible along the top and left of the embryo. ABpl spindle is visible in the center of the embryo starting at t=8 due to projection of full-volume image. Displayed is every 2 minutes, images taken every 30 seconds. The cells are outlined (colors match Figure 1) at times when centrosome positioning defects were observed. Scale bars represent 10 μm. E. Quantification of spindle angle in ABal from embryos shown in (D). Full-volume images were displayed in 3D, and centrosomes were annotated manually. X, Y, and Z coordinates were used to determine the XY and XZ angles of the spindle relative to the embryo’s AP axis over time, starting from the beginning of centrosome separation until NEBD. Interval = 30sec. See also: Videos S4–S5.
Figure 4:
Figure 4:. PAR-3 polarizes independently of aPKC and instructs aPKC localization
A. Localization of Sc::aPKC and PAR-3::ZF1::GFP under the indicated conditions. For “Control” embryos, zif-1 RNAi was used to prevent PAR-3::ZF1::GFP degradation. Scale bars represent 10 μm. B. Localization of Sc::PAR-3 and aPKC::ZF1::GFP under the indicated conditions. For “Control” embryos, zif-1 RNAi was used to prevent ZF1::GFP::aPKC degradation. Scale bars represent 10 μm. C. Quantification of data in (A). Linescans were taken from midplane slices from the apical membrane through the cytoplasm and to the AB cell-cell contact. Background was subtracted and apical maximum, cytoplasmic average (of 10 datapoints) and contact maximum were plotted. Data points indicate individual measurements (one measurement per embryo), and lines indicate the means. D. Comparison between wild-type and PAR-3::ZF1::GFP data in (C). Bars indicate the mean intensity difference between mutant and wild-type and its 95% confidence interval. E. Quantification of data in (B), as in (C). F. Comparison between wild-type and aPKC::ZF1::GFP data in (E). Bars indicate the mean intensity difference between mutant and wild-type and its 95% confidence interval. See also: Figure S2.
Figure 5:
Figure 5:. PAR-3 can polarize after disrupting microtubules, myosin flow or cell-cell contacts
A. Vehicle control and 50 μM nocodazole-treated embryos expressing mCh::Tubulin; mNG::PAR-3. Embryos were permeabilized with perm-1 RNAi and imaged in media + DMSO vehicle in an open coverslip device that allows drug addition during imaging. Right: Nocodazole treatment. After the 4–8 AB cell division, 50 μM nocodazole was added and wicked through the device; MTs were not visible 60–90 sec after addition. Left: For controls, no nocodazole was added. Right side of embryo is shown; ABxx blastomeres visible along top/anterior. Timepoints shown are equivalent staged embryos, 3 minutes elapsed between time points. Scale bars represent 10 μm. B. Maximum projection of embryo expressing NMY-2::mKate2; mNG::PAR-3 at peak apical cap formation. Left side of embryo is shown focused on Abal; ABxx blastomeres are visible along top/anterior. Scale bars represent 10 μm. C. Cortical image of embryo expressing NMY-2::mKate2; mNG::PAR-3 and kymograph. Image is at the beginning of mNG::PAR-3 apical cap formation. Inset shows selection across the ABpl apical cap used for kymograph. Kymograph displays pre-apical cap formation to peak apical cap intensity. Time is on Y axis. D. Maximum projection of control embryos (mCh::Tubulin; mNG::PAR-3) and myosin (ts) embryos (myosin (ts); mCh::Tubulin; mNG::PAR-3). Wild-type embryos formed normal cytokinesis furrows in neighboring mitotic cells (yellow arrow). myosin (ts) embryos had disrupted visibly shallow cytokinesis furrows and/or partial furrows that receded (yellow arrows). Embryos were divided into two groups. Group 1 (one example shown): embryos with cells that had normal centrosome numbers and therefore didn’t have a visible cytokinesis defect before imaging; Group 2 (two examples shown): embryos with cells that had duplicate centrosome numbers indicating a cytokinesis defect before imaging. Here, arrows indicate partial furrows that regressed or areas between two nuclei that had no membrane. Scale bars represent 10 μm. E. mNG:::PAR-3 and TPXL-1::mSc localization in 4AB/8, 2AB/8 and 1AB/8 cell explants. F. Quantification of PAR-3 intensity. Linescans were taken across the PAR-3 enriched side of the blastomere, through the cytoplasm to the opposite contact-free membrane. G. mNG::PAR-3 and mSc::aPKC localization in 1AB/8 explants. Background-subtracted images are shown in inverted contrast for clarity. The raw, unprocessed images are shown in Figure S3F. Scale bar represents 10 μm. See also: Figures S3 and S4.
Figure 6:
Figure 6:. PAC-1 regulates aPKC but not PAR-3, and does not act through CDC-42
A. mSc::PAR-3 localization in wild-type and pac-1 RNAi treated embryos. pac-1 RNAi treatment was performed for 24 hours. Midplane and maximum projection shown. Scale bars represent 10 μm. B. Quantification of data in (A) from linescans from apical, through cytoplasmic to contact. Linescans were taken from midplane slices from the apical membrane through the cytoplasm and to the AB cell-cell contact. Background was subtracted and apical maximum, cytoplasmic average (of 10 datapoints) and contact maximum were plotted. Data points indicate individual measurements (one measurement per embryo), and lines indicate the means. C. Comparison between wild-type and pac-1(RNAi) data in (B). Bars indicate the mean intensity difference between mutant and wild-type and its 95% confidence interval. D. mSc::aPKC localization in wild-type, pac-1(RNAi) and pac-1(xn6) embryos. pac-1 RNAi treatment was performed for 24 hours. Midplane and maximum projection shown. Scale bars represent 10 μm. E. Quantification of data in (D) and (G). Linescans were taken from midplane slices from the apical membrane through the cytoplasm and to the AB cell-cell contact. Background was subtracted and apical maximum and contact maximum were plotted. Data points indicate individual measurements (one measurement per embryo), and lines indicate the means. F. Comparisons between control and experimental data in (E). Bars indicate the mean intensity difference between mutant and wild-type and its 95% confidence interval. For pac-1(RNAi) and pac-1(xn6), the control is mSc::aPKC in a wild-type background. For YFP::ZF1::CDC-42 and YFP::ZF1::CDC-42 + pac-1(RNAi), the control is YFP::ZF1::CDC-42 treated with zif-1 RNAi to prevent YFP::ZF1::CDC-42 degradation. G. mSc::aPKC and CDC-42::ZF1::YFP localization in mSc::aPKC, CDC-42::ZF1::YFP embryos treated with zif-1 RNAi (no ZF1 degradation; gray), no RNAi (yellow), and pac-1 RNAi (purple). Scale bars represent 10 μm. H. Ratios of apical:contact aPKC fluorescence intensity, calculated from the measurements in (E). Data points indicate individual measurements (one measurement per embryo), and lines indicate the means. See also: Figure S5
Figure 7:
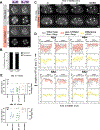
Figure 7:. PAC-1 depletion does not cause a spindle orientation defect
A. Representative images of 4AB/8 blastomere explants from wild-type and pac-1 RNAi treated mNG::PAR-3; TPXL-1::mSc embryos. Scale bars represent 10 μm. B. Phenotype scoring of 8AB/12 blastomere explants from (A). Dataset was blinded and scored based on whether the blastomere explant was organized/spherical or disorganized/had cells protruding from the cluster. Wild type data is the same as in Figures 2D and 3C, and is shown here for clarity. C. Time-lapse maximum projection montage of centrosomes marked by mSc::TPXL-1 from full-volume imaging in wild-type and pac-1 RNAi. Time to NEBD (minutes) at top, embryos were imaged every 30 seconds; displayed is every 2 minutes. Scale bars represent 10 μm. D. Quantification of spindle position in ABaL from 3D reconstruction of timelapse images shown in (C). Centrosomes were annotated and x, y, and z coordinates were used to determine the XY and XZ angles of the spindle relative to the embryo’s AP axis over time, starting from the beginning of centrosome separation until NEBD. Interval = 30sec. E. Comparison of spindle angles between Wild-type, PAR-3::ZF1, ZF1::aPKC and pac-1(RNAi) embryos in the indicated cells and at the indicated times. For clarity, we chose to compare the angles and time points at which PAR-3::ZF1 was most different from wild-type. Data points indicate individual measurements, and lines indicate the means. Error bars indicate the mean difference from wild-type and its 95% confidence interval, plotted on the right Y-axis. See Figure S6 for additional cells. See also: Figure S6, Videos S4 & S6.

Update of

Comment in

Similar articles

Cited by

References

    1. Goldstein B, and Macara IG (2007). The PAR proteins: fundamental players in animal cell polarization. Dev Cell 13, 609–622. 10.1016/j.devcel.2007.10.007. - DOI - PMC - PubMed
    1. Lechler T, and Mapelli M (2021). Spindle positioning and its impact on vertebrate tissue architecture and cell fate. Nat Rev Mol Cell Bio 22, 691–708. 10.1038/s41580-021-00384-4. - DOI - PMC - PubMed
    1. Zhu M, and Zernicka-Goetz M (2020). Building an apical domain in the early mouse embryo: Lessons, challenges and perspectives. Curr Opin Cell Biol 62, 144–149. 10.1016/j.ceb.2019.11.005. - DOI - PMC - PubMed
    1. Maître J-L, Turlier H, Illukkumbura R, Eismann B, Niwayama R, Nédélec F, and Hiiragi T (2016). Asymmetric division of contractile domains couples cell positioning and fate specification. Nature. 10.1038/nature18958. - DOI - PMC - PubMed
    1. Korotkevich E, Niwayama R, Courtois A, Friese S, Berger N, Buchholz F, and Hiiragi T (2017). The Apical Domain Is Required and Sufficient for the First Lineage Segregation in the Mouse Embryo. Dev Cell 40, 235–247.e7. 10.1016/j.devcel.2017.01.006. - DOI - PMC - PubMed

Publication types

MeSH terms

Substances

LinkOut - more resources