. 2023 Oct 23;33(20):4353-4366.e5.
doi: 10.1016/j.cub.2023.08.072. Epub 2023 Sep 19.

Olfactory bulb activity shapes the development of entorhinal-hippocampal coupling and associated cognitive abilities

Affiliations

Olfactory bulb activity shapes the development of entorhinal-hippocampal coupling and associated cognitive abilities

Yu-Nan Chen et al. Curr Biol. .

Abstract

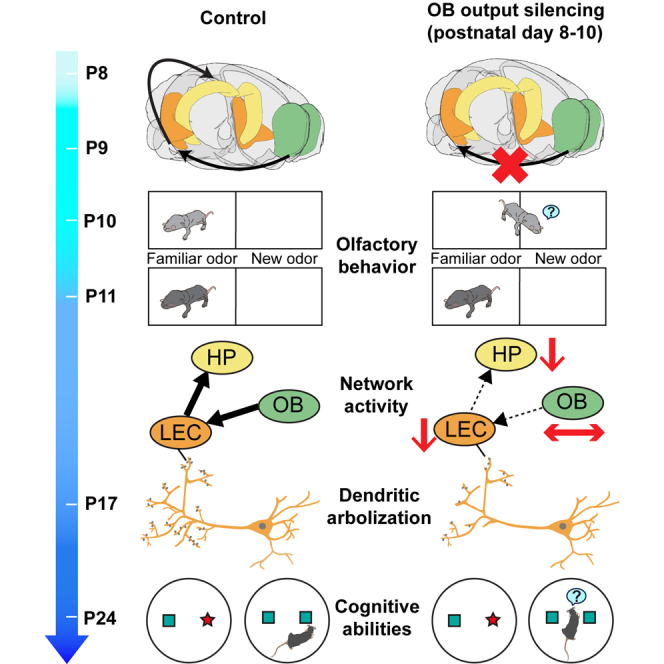
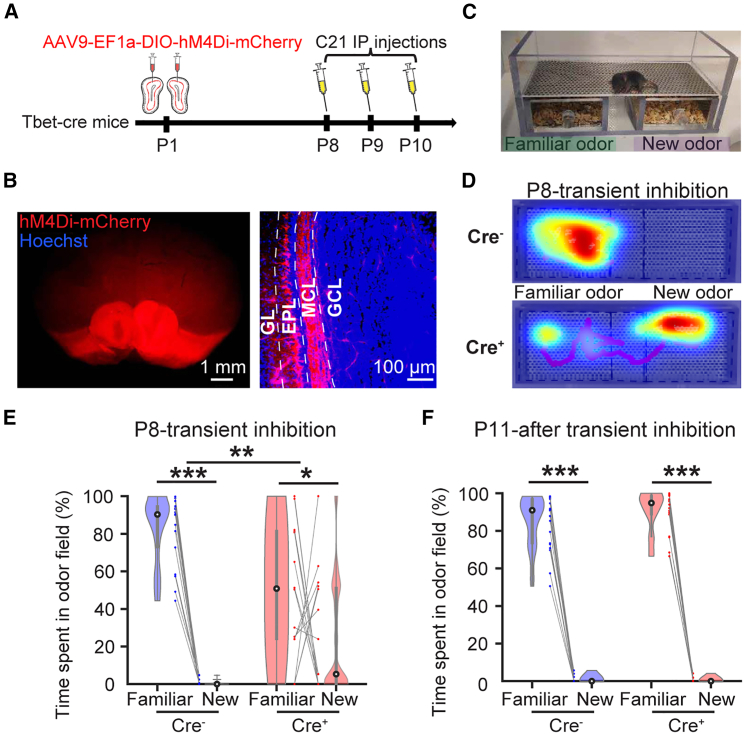
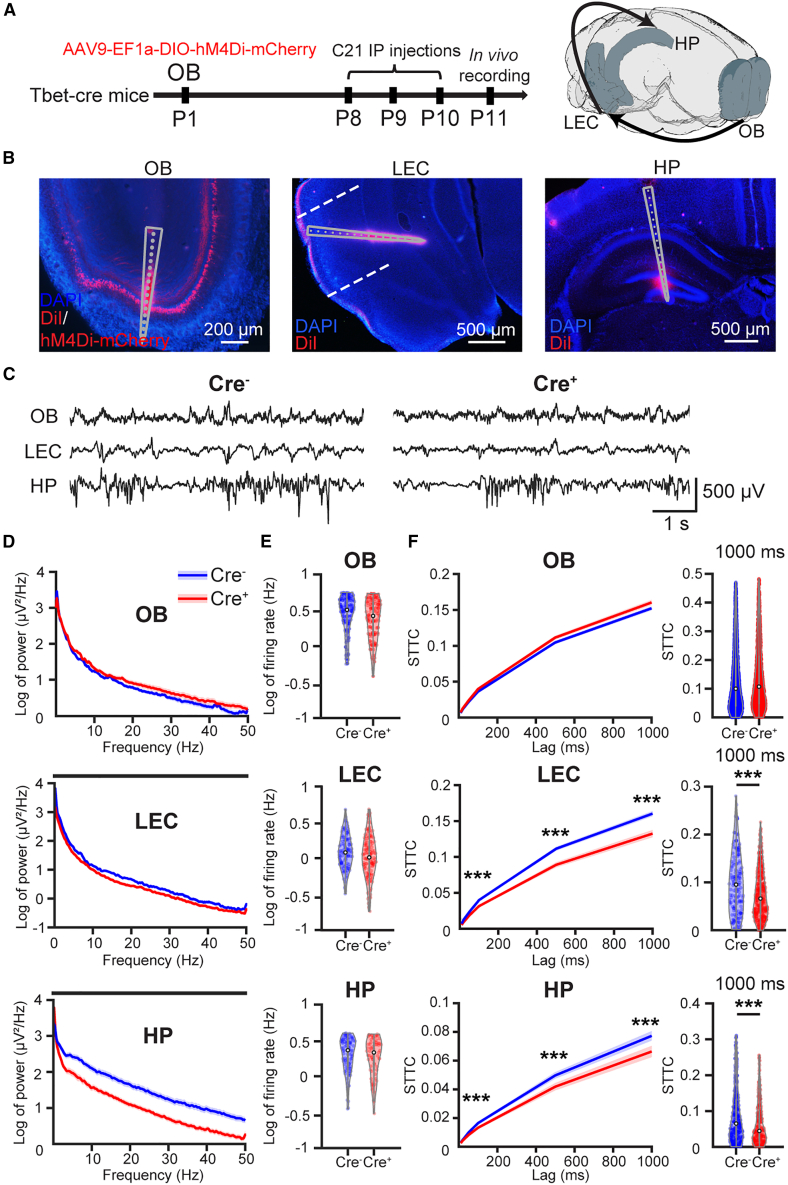
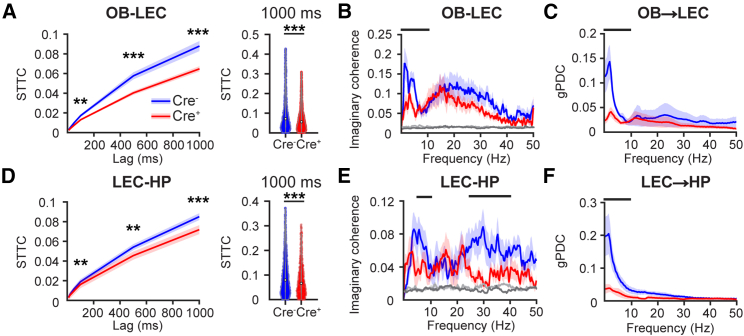
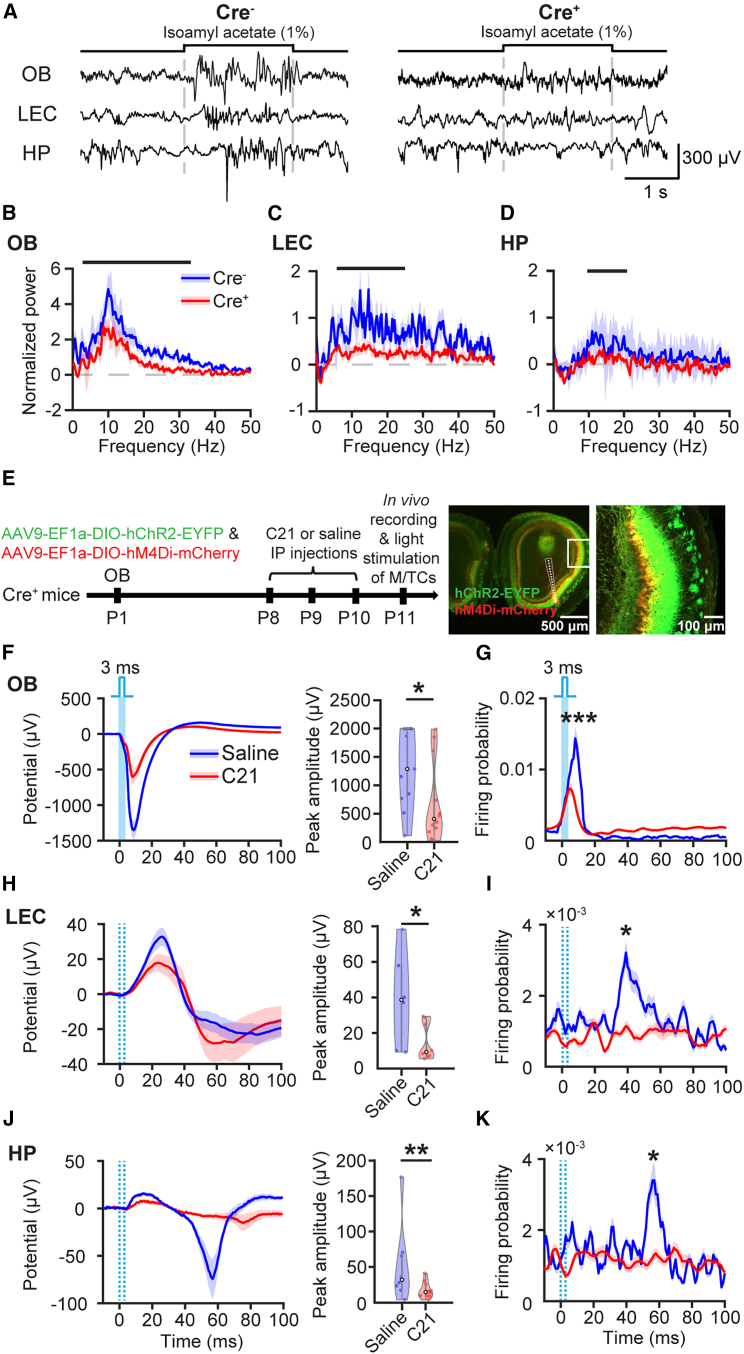
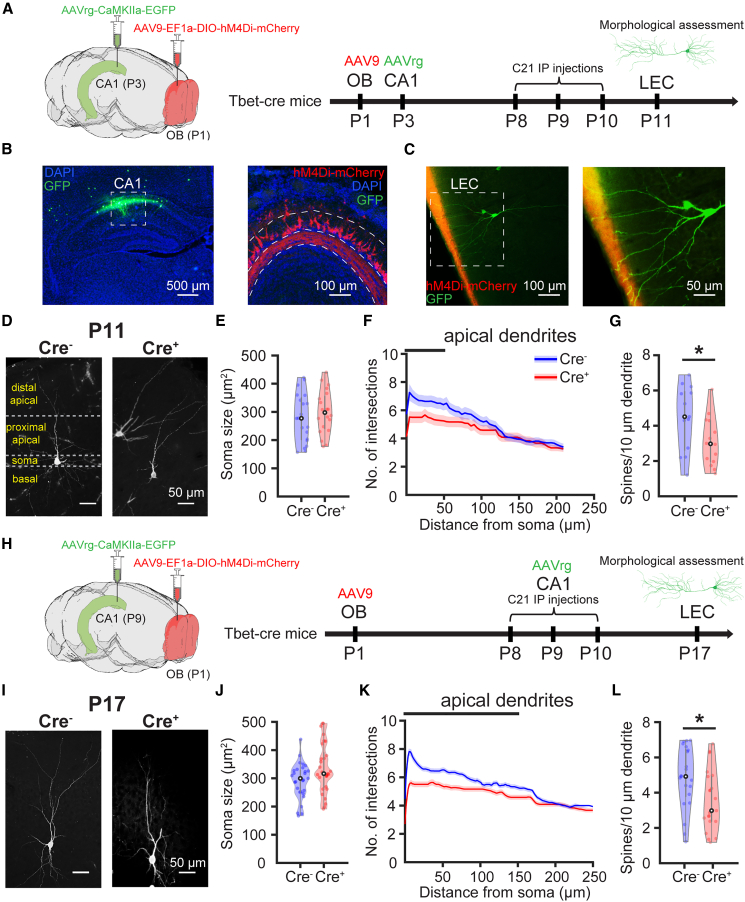
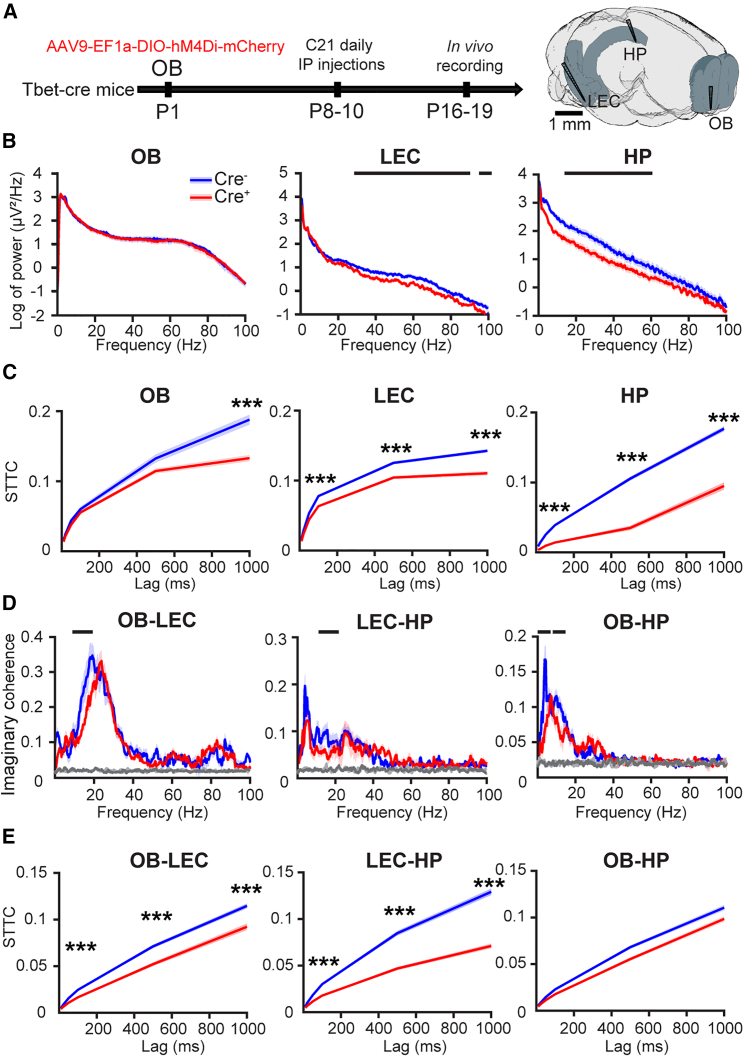
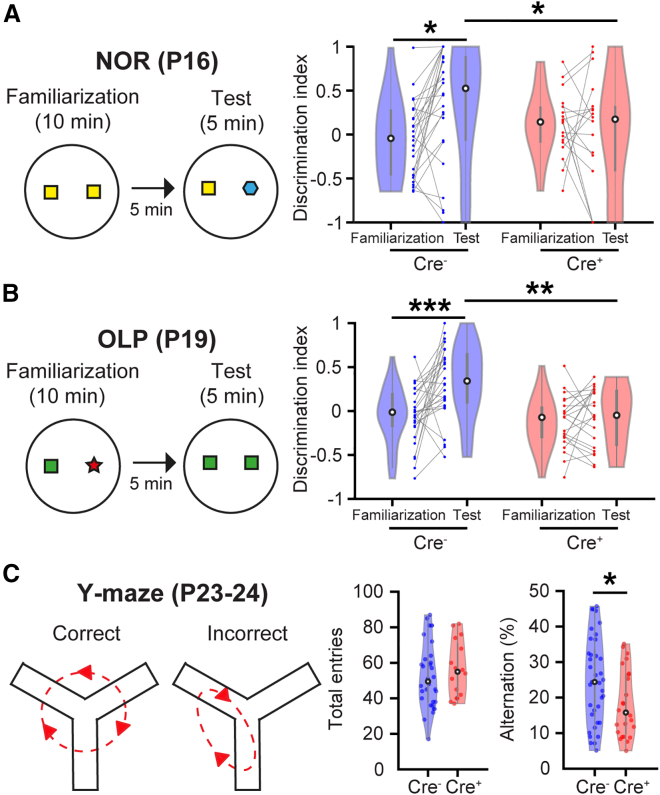
The interplay between olfaction and higher cognitive processing has been documented in the adult brain; however, its development is poorly understood. In mice, shortly after birth, endogenous and stimulus-evoked activity in the olfactory bulb (OB) boosts the oscillatory entrainment of downstream lateral entorhinal cortex (LEC) and hippocampus (HP). However, it is unclear whether early OB activity has a long-lasting impact on entorhinal-hippocampal function and cognitive processing. Here, we chemogenetically silenced the synaptic outputs of mitral/tufted cells, the main projection neurons in the OB, during postnatal days 8-10. The transient manipulation leads to a long-lasting reduction of oscillatory coupling and weaker responsiveness to stimuli within developing entorhinal-hippocampal circuits accompanied by dendritic sparsification of LEC pyramidal neurons. Moreover, the transient silencing reduces the performance in behavioral tests involving entorhinal-hippocampal circuits later in life. Thus, neonatal OB activity is critical for the functional LEC-HP development and maturation of cognitive abilities.

Keywords: chemogenetics; development; entorhinal-hippocampal network; olfactory bulb; oscillatory activity; recognition memory.


Conflict of interest statement

Declaration of interests The authors declare no competing interests.

Figures

None
Graphical abstract
Figure 1
Figure 1
Effects of transient M/TC output silencing on odor discrimination/detection of neonatal mice (A) Experimental timeline of the transient chemogenetic silencing of M/TC outputs. Expression of inhibitory hM4Di receptors in M/TCs was performed by AAV injections into OB of both hemispheres at P1 in Tbet-cre mice. C21 was intraperitoneally (i.p.) injected at P8, P9, and P10 once per day. (B) Digital photomontages of nuclear Hoechst-staining and expression of hM4Di-mCherry in both OBs of a P11 Cre+ mouse (front view of an intact brain, left) and in a coronal slice of the OB from the same mouse (right; GL, glomerular layer; EPL, external plexiform layer; MCL, mitral cell layer; GCL, granule cell layer). (C) Photograph of the setup for non-contact odor preference test for neonatal mice. One field contains homecage beddings as familiar odor, whereas the other field contains fresh beddings soaked with 1% vanillin as new odor. (D) Representative tracking paths merged with locomotion heatmaps of a Cre (top) and a Cre+ mouse (bottom) in the odor preference test arena after the first C21 injection at P8. (E) Violin plots displaying the relative time spent by P8 Cre (blue) and Cre+ (red) mice over each odor field after the first C21 injection (Cre, n = 18; Cre+, n = 16; p < 0.0001 for interaction of genotype and odor, p < 0.0001 for Cre-familiar versus Cre-new, p = 0.026 for Cre+-familiar versus Cre+-new, p = 0.0078 for Cre-new versus Cre+-new, nonparametric multiple comparisons with Bonferroni’s post hoc test). (F) Violin plots displaying the relative time spent by P11 Cre and Cre+ mice over each odor field after 3-day C21 injections from P8 to P10 (Cre, n = 22; Cre+, n = 17; p = 0.216 for interaction of genotype and odor, p < 0.0001 for Cre-familiar versus Cre-new, p < 0.0001 for Cre+-familiar versus Cre+-new, p = 0.908 for Cre-new versus Cre+-new, nonparametric multiple comparisons with Bonferroni’s post hoc test). Data are presented as individual data points, median, and interquartile range. p < 0.05, ∗∗p < 0.01, ∗∗∗p < 0.001. See also Figure S1 and Table S1.
Figure 2
Figure 2
Effects of transient M/TC output silencing on the neuronal and network activity in OB, LEC, and HP of P11 mice (A) Left: experimental timeline of the chemogenetic silencing of M/TC outputs during P8–P10 followed by in vivo multi-site extracellular recordings of OB, LEC, and HP at P11. Right: three-dimensional (3D) schematic of the recording sites in OB, LEC, and HP. Black arrows correspond to the axonal projections linking the OB, LEC, and HP. (B) Digital photomontage reconstructing the location of the DiI-labeled extracellular recording electrodes in OB, LEC, and HP of a P11 hM4Di-mCherry expressing Cre+ mouse. (C) Representative extracellular recordings of the LFPs in the OB, LEC, and HP of P11 Cre (left) and Cre+ (right) mice. (D) Averaged power spectra of oscillatory activity recorded from P11 Cre (blue) and Cre+ (red) mice in OB (Cre, n = 16; Cre+, n = 15; p = 0.810 for genotype, linear mixed-effects model [LMEM]), LEC (Cre, n = 12; Cre+, n = 12; p = 0.00104 for genotype, LMEM), and HP (Cre, n = 12; Cre+, n = 11; p = 0.0411 for genotype, LMEM). (E) Violin plot displaying the SUA firing rates in OB, LEC, and HP for P11 Cre and Cre+ mice. (F) Left: averaged correlation between spike trains quantified by STTC for P11 Cre and Cre+ mice. The significance levels for comparisons at 100, 500, and 1,000 ms time lag are displayed. Right: violin plot displaying the corresponding STTC values for 1,000 ms time lag between spike trains in OB (p = 0.36, Wilcoxon rank-sum test), LEC (p < 0.0001, Wilcoxon rank-sum test), and HP (p < 0.0001, Wilcoxon rank-sum test). For line plots, data are presented as median ± standard error of the median. Horizontal black lines indicate p < 0.05. For violin plots, data are presented as individual data points, median, and interquartile range. ∗∗∗p < 0.001. See also Table S1.
Figure 3
Figure 3
Effects of transient M/TC output silencing on long-range communication between OB, LEC, and HP for P11 mice (A) Left: STTC between spike trains simultaneously recorded in OB and LEC from P11 Cre (blue) and Cre+ (red) mice. The significance levels for comparisons at 100, 500, and 1,000 ms time lag are displayed. Right: violin plot displaying the corresponding STTC values for 1,000 ms time lag (p < 0.0001, Wilcoxon rank-sum test). (B) Averaged imaginary coherence for oscillatory activity simultaneously recorded in OB and LEC for P11 Cre and Cre+ mice (Cre, n = 12; Cre+, n = 12; p = 0.00212 for interaction of genotype and frequency, LMEM). The gray lines at the bottom correspond to the imaginary coherence calculated for shuffled LFPs of both groups, respectively (light gray for Cre; dark gray for Cre+). (C) Information flow from OB to LEC within OB-LEC-HP network quantified by gPDC for simultaneous oscillatory activity of P11 Cre and Cre+ mice (Cre, n = 12; Cre+, n = 12; p = 0.0126 for interaction of genotype and frequency, LMEM). (D) Same as (A) for LEC-HP (p < 0.0001, Wilcoxon rank-sum test). (E) Same as (B) for LEC-HP (Cre, n = 9; Cre+, n = 9; p = 0.0043 for interaction of genotype and frequency, LMEM). (F) Same as (C) for information flow from LEC to HP (Cre, n = 9; Cre+, n = 9; p = 0.0129 for interaction of genotype and frequency, LMEM). For line plots, data are presented as median ± standard error of the median. Horizontal black lines indicate p < 0.05. For violin plots, data are presented as individual data points, median, and interquartile range. p < 0.05, ∗∗p < 0.01. See also Figure S2 and Table S1.
Figure 4
Figure 4
Effects of transient M/TC output silencing on odor- and M/TC optogenetically evoked activity in OB, LEC, and HP of P11 mice (A) Representative extracellular recordings of the LFP in OB, LEC, and HP of P11 Cre (left) and Cre+ (right) mice during odor stimulation with 1% isoamyl acetate. (B) Averaged power during odor stimulation with 1% isoamyl acetate normalized to the power before stimulation in OB of P11 Cre (blue) and Cre+ (red) mice (Cre, n = 12; Cre+, n = 8; p = 0.0219 for interaction of genotype and frequency, LMEM). (C) Same as (B) for LEC (Cre, n = 7; Cre+, n = 7; p = 0.0308 for interaction of genotype and frequency, LMEM). (D) Same as (B) for HP (Cre, n = 10; Cre+, n = 8; p = 0.0163 for interaction of genotype and frequency, LMEM). Data are presented as median ± standard error of the median. Horizontal black lines indicate p < 0.05. (E) Left: experimental timeline of acute optogenetic M/TC activation after transient M/TC output silencing of Tbet-cre mice. Expression of both inhibitory hM4Di and light-sensitive hChR2 receptors in M/TCs was performed by AAV injections into OBs of both hemispheres at P1 in Tbet-cre+ mice, and C21 or saline was i.p. injected at P8, P9 and P10 once per day. Light stimulations were performed on M/TCs along with in vivo multi-site extracellular recordings of OB, LEC, and HP at P11. Right: digital photomontages of hChR2-EYFP- and hM4Di-mCherry-transfected OB from a P11 Cre+ mouse, and transfection pattern over the OB layers from the same slice when displayed at larger magnification. (F) Left: averaged light-induced field potentials recorded in the OB of P11 Cre+ mice after daily saline (blue) or C21 (red) injections during P8–P10. Right: violin plots of the peak amplitude of light-induced field potentials (Cre+-saline, n = 10; Cre+-C21, n = 12; p = 0.0161, Wilcoxon rank-sum test). (G) Averaged probability of SUA firing in OB induced by light stimulation of P11 Cre+ mice after daily saline or C21 injections during P8–P10 (Cre+-saline, n = 63; Cre+-C21, n = 81; p = 0.000378, Wilcoxon rank-sum test). The 3-ms blue light square pulses (473 nm) delivered to M/TC layer are marked by light blue bars. (H and I) Same as (F) and (G) for LEC (F, Cre+-saline, n = 6; Cre+-C21, n = 7; p = 0.0293, Wilcoxon rank-sum test; G, Cre+-saline, n = 32; Cre+-C21, n = 48; p = 0.0149, Wilcoxon rank-sum test). (J and K) Same as (F) and (G) for HP (J, Cre+-saline, n = 8; Cre+-C21, n = 10; p = 0.00555, Wilcoxon rank-sum test; K, Cre+-saline, n = 17; Cre+-C21, n = 39; p = 0.0144, Wilcoxon rank-sum test). For line plots, data are presented as mean ± SEM. Horizontal black lines indicate p < 0.05. For violin plots, data are presented as individual data points, median, and interquartile range. p < 0.05, ∗∗p < 0.01. See also Figure S3 and Table S1.
Figure 5
Figure 5
Long-lasting effects of transient M/TC output silencing on the morphology of LEC neurons (A) Experimental design and timeline for retrograde tracing of CA1-projecting neurons in LEC of P11 mice. (B) Digital photomontages displaying the injection site of viral construct AAVrg-CaMKIIa-EGFP in the hippocampal CA1, and AAV9-hM4Di-mCherry in OB of a Cre+ mouse. (C) GFP-labeled CA1-projecting neurons in LEC of the same Cre+ mouse in (B). Note that the axonal terminals of M/TCs were also labeled by hM4Di-mCherry. (D) Representative images of labeled pyramidal neurons in LEC of P11 Cre and Cre+ mice. (E) Violin plots displaying the soma area of labeled pyramidal neurons in LEC of P11 Cre (blue) and Cre+ (red) mice. (F) Dendritic intersections within a 250 μm radius from the soma center of LEC neurons from Cre (n = 3 mice, 13 neurons) and Cre+ (n = 3 mice, 14 neurons) mice at P11. (G) Violin plots of spine density on apical dendrites of labeled LEC pyramidal neurons from Cre and Cre+ mice on P11 (Cre, n = 13; Cre+, n = 14; p = 0.0404, Wilcoxon rank-sum test). (H) Experimental design and timeline for retrograde tracing of CA1-projecting neurons in LEC of P17 mice. (I–L) Same as (D)–(G) for P17 mice (K, Cre, n = 3 mice, 21 neurons; Cre+, n = 3 mice, 21 neurons; p < 0.0001 for interaction of genotype and distance from the soma, LMEM; L, Cre, n = 21; Cre+, n = 21; p = 0.0221, Wilcoxon rank-sum test). For line plots, data are presented as median ± standard error of the median. Horizontal black lines indicate p < 0.05. For violin plots, data are presented as individual data points, median, and interquartile range. p < 0.05. See also Figure S4 and Table S1.
Figure 6
Figure 6
Effects of transient M/TC output silencing on neuronal and network activity in the OB-LEC-HP network of P16–P19 mice (A) Left: experimental timeline of the chemogenetic silencing of M/TC outputs during P8–P10 followed by in vivo multi-site extracellular recordings of OB, LEC, and HP at P16–P19. Right: 3D schematic of the recording sites in OB, LEC, and HP of P16–P19 mice. (B) Averaged power spectra of oscillatory activity recorded from Cre (blue) and Cre+ (red) mice during P16–P19 in OB (Cre, n = 16; Cre+, n = 15; p = 0.296 for genotype, LMEM), LEC (Cre, n = 10; Cre+, n = 12; p = 0.00883 for genotype, LMEM), and HP (Cre, n = 11; Cre+, n = 13; p = 0.0472 for genotype, LMEM). (C) Averaged correlation between spike trains quantified by STTC in OB, LEC, and HP recorded from Cre and Cre+ mice during P16–P19. The significance levels for comparisons at 100, 500, and 1,000 ms time lag are displayed, respectively. (D) Averaged imaginary coherence for simultaneous oscillatory activity recorded in OB and LEC (Cre, n = 10; Cre+, n = 12; p = 0.0248 for interaction of genotype and frequency, LMEM), LEC, and HP (Cre, n = 10; Cre+, n = 12; p = 0.0493 for interaction of genotype and frequency, LMEM), as well as OB and HP (Cre, n = 11; Cre+, n = 13; p = 0.00058 for interaction of genotype and frequency, LMEM) from Cre and Cre+ mice during P16–P19. The gray lines at the bottom correspond to the imaginary coherence calculated for shuffled LFPs (light gray for Cre; dark gray for Cre+). (E) Pairwise correlation between spike trains simultaneously recorded in OB and LEC (left), LEC and HP (middle), as well as OB and HP (right) from P16 to P19 Cre and Cre+ mice quantified by STTC. The significance levels for comparisons at 100, 500, and 1,000 ms time lag are displayed. Data are presented as median ± standard error of the median. Horizontal black lines indicate p < 0.05. See also Figure S5 and Table S1.
Figure 7
Figure 7
Effects of transient M/TC output silencing on the behavioral performance of pre-juvenile mice in recognition and spatial memory tasks (A) Left: schematic of the protocol for the NOR test. Right: violin plots displaying the discrimination indices in both familiarization and test trials for Cre (blue) and Cre+ (red) mice (Cre, n = 26; Cre+, n = 18; p = 0.0141 for interaction of genotype and trial, p = 0.0119 for Cre-familiarization versus Cre-test, p = 0.828 for Cre+-familiarization versus Cre+-new, p = 0.0301 for Cre-new versus Cre+-new, nonparametric multiple comparisons with Bonferroni’s post hoc test). (B) Left: schematic of the protocol for OLP test of mice. Right: violin plots displaying the discrimination indices in both familiarization and test trials for Cre and Cre+ mice (Cre, n = 27; Cre+, n = 23; p = 0.0122 for interaction of genotype and trial, p < 0.0001 for Cre-familiarization versus Cre-test, p = 0.444 for Cre+-familiarization versus Cre+-test, p = 0.00539 for Cre-test versus Cre+-test, nonparametric multiple comparisons with Bonferroni’s post hoc test). (C) Left: schematic illustrating a correct and an incorrect alternation in the Y-maze test for mice. Middle: violin plot displaying the total number of arm entries in the Y-maze for Cre and Cre+ mice (Cre, n = 37; Cre+, n = 25; p = 0.511, Wilcoxon rank-sum test). Right: violin plot displaying the percentage of spontaneous alternations in the Y-maze test for Cre and Cre+ mice (p = 0.0355, Wilcoxon rank-sum test). Data are presented as individual data points, median, and interquartile range. p < 0.05, ∗∗p < 0.01, ∗∗∗p < 0.001. See also Table S1.

Comment in

Similar articles

Cited by

References

    1. Fries P. A mechanism for cognitive dynamics: neuronal communication through neuronal coherence. Trends Cogn. Sci. 2005;9:474–480. doi: 10.1016/j.tics.2005.08.011. - DOI - PubMed
    1. Buzsáki G. Neural syntax: cell assemblies, synapsembles, and readers. Neuron. 2010;68:362–385. doi: 10.1016/j.neuron.2010.09.023. - DOI - PMC - PubMed
    1. Voytek B., Knight R.T. Dynamic network communication as a unifying neural basis for cognition, development, aging, and disease. Biol. Psychiatry. 2015;77:1089–1097. doi: 10.1016/j.biopsych.2015.04.016. - DOI - PMC - PubMed
    1. Wilson M.A., Varela C., Remondes M. Phase organization of network computations. Curr. Opin. Neurobiol. 2015;31:250–253. doi: 10.1016/j.conb.2014.12.011. - DOI - PMC - PubMed
    1. Quirk C.R., Zutshi I., Srikanth S., Fu M.L., Devico Marciano N., Wright M.K., Parsey D.F., Liu S., Siretskiy R.E., Huynh T.L., et al. Precisely timed theta oscillations are selectively required during the encoding phase of memory. Nat. Neurosci. 2021;24:1614–1627. doi: 10.1038/s41593-021-00919-0. - DOI - PMC - PubMed

Publication types