. 2023 Aug;33(8):1409-1423.
doi: 10.1101/gr.277722.123. Epub 2023 Sep 20.

Genetic features and genomic targets of human KRAB-zinc finger proteins

Affiliations

Genetic features and genomic targets of human KRAB-zinc finger proteins

Jonas de Tribolet-Hardy et al. Genome Res. 2023 Aug.

Abstract

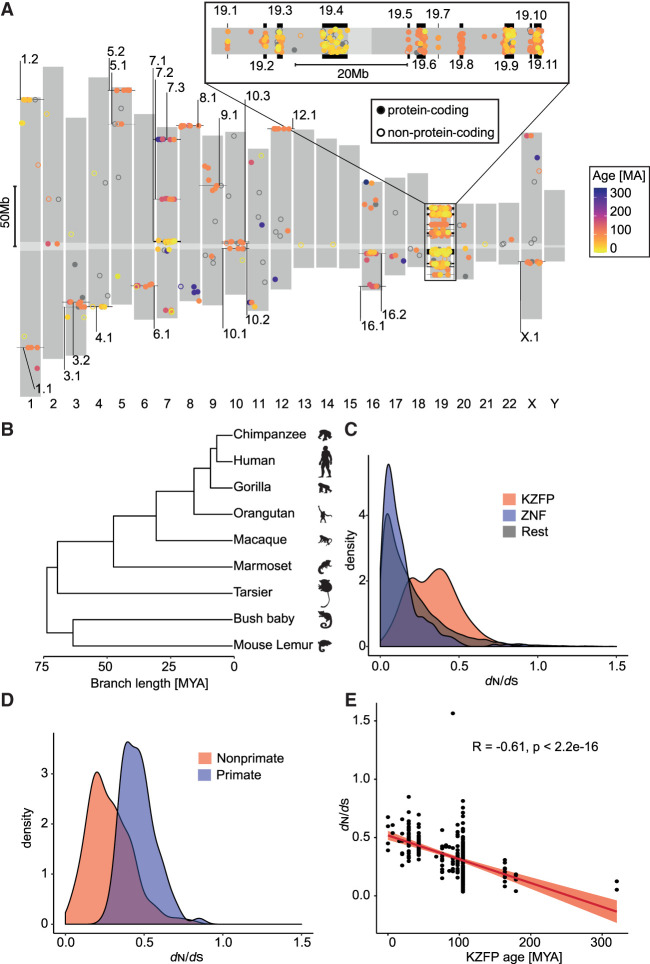
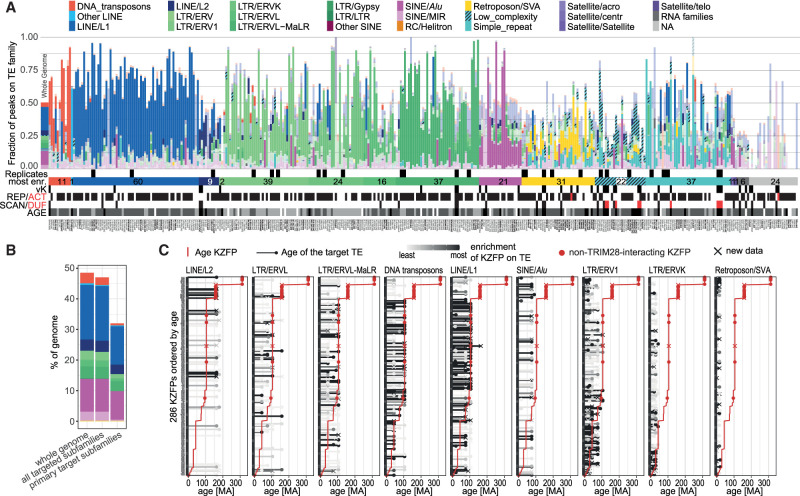
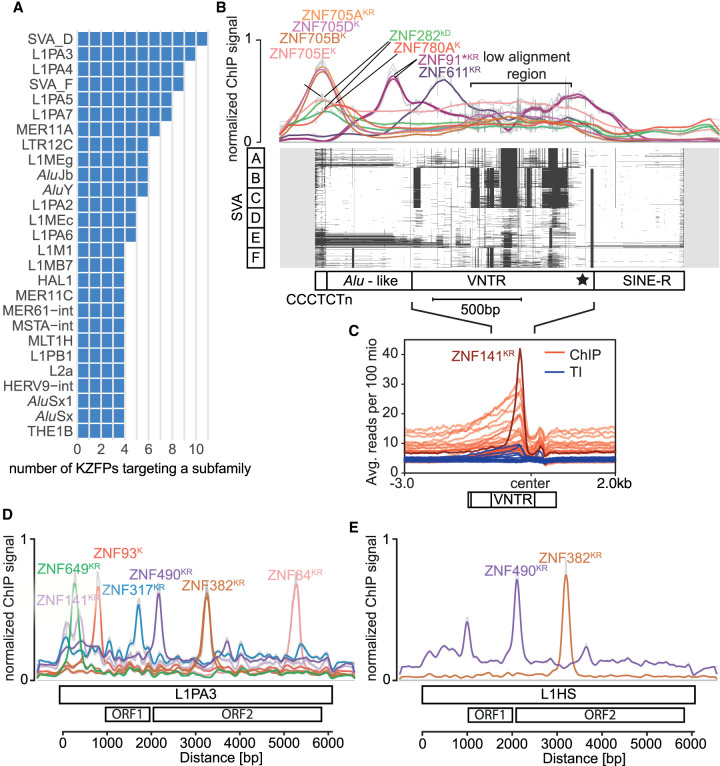
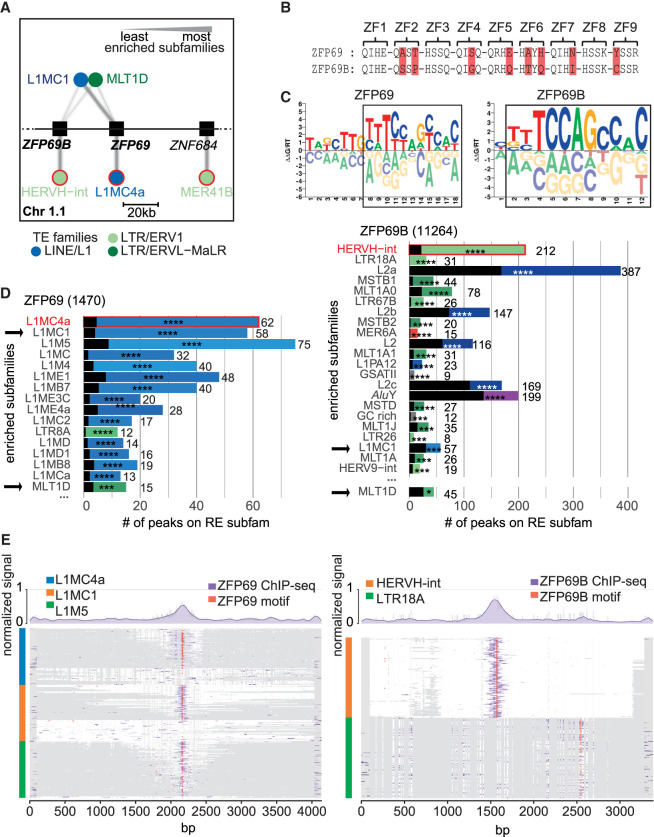
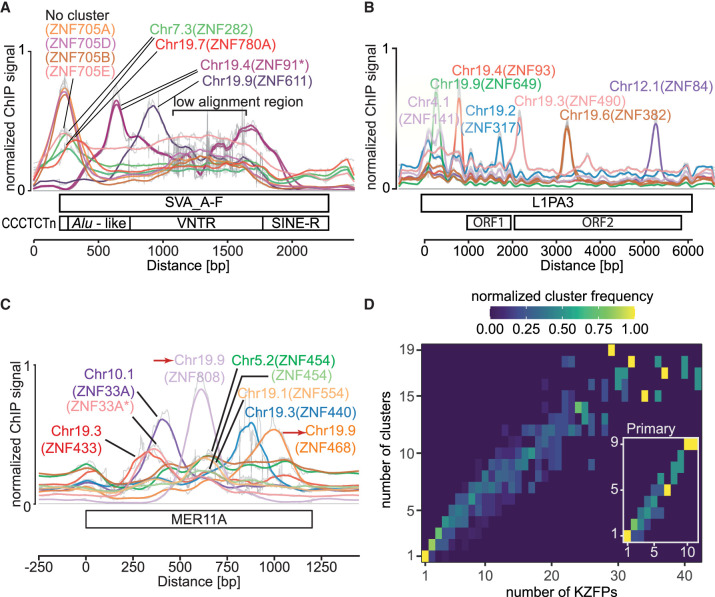
Krüppel-associated box (KRAB) domain-containing zinc finger proteins (KZFPs) are one of the largest groups of transcription factors encoded by tetrapods, with 378 members in human alone. KZFP genes are often grouped in clusters reflecting amplification by gene and segment duplication since the gene family first emerged more than 400 million years ago. Previous work has revealed that many KZFPs recognize transposable element (TE)-embedded sequences as genomic targets, and that KZFPs facilitate the co-option of the regulatory potential of TEs for the benefit of the host. Here, we present a comprehensive survey of the genetic features and genomic targets of human KZFPs, notably completing past analyses by adding data on close to a hundred family members. General principles emerge from our study of the TE-KZFP regulatory system, which point to multipronged evolutionary mechanisms underlaid by highly complex and combinatorial modes of action with strong influences on human speciation.


Figures

Figure 1.
Figure 1.
Human KRAB-zinc finger proteins (KZFPs) and their evolution in the primate lineage. (A) Dots indicate relative chromosomal position of KZFP genes (defined by juxtaposed KRAB- and zinc finger-coding domains), with the color code indicative of age (gray for unassigned) and numbered clusters pointed to in black. Hollow circles indicate non-protein-coding genes. A higher magnification of Chromosome 19 is presented on top. Centromeres are indicated in light gray. (B) Phylogenetic tree of primate species used to calculate natural selection of human genes, with branch length indicating approximate time of divergence in million years (MYA). Silhouettes courtesy of PhyloPic (http://phylopic.org/). (C) Distribution of PAML dN/dS values of natural selection for KZFPs (red), nonKRAB ZFPs (blue), and all remaining genes in the genome (gray). (D) dN/dS distribution of primate-specific KZFPs (blue) and older (red) KZFP genes. (E) Spearman's correlation of the dN/dS values and estimated age of KZFP genes. The linear regression and 95% confidence interval are shown in red.
Figure 2.
Figure 2.
Coding constraints of KZFP genes. (A) Schematic of genetic constraint Z-score calculation. WGS/WES, whole genome/exome sequencing; LoF, loss-of-function variant; CDS, coding sequence. (B) Distribution of indicated Z scores; a lower score indicates increased constraint compared to the average of all KZFPs. Full KZFP, all variants within the canonical KZFP transcript; KRAB domain, only variants in the KRAB domain; ZF domains, variants within the ZF domains; ZF other, variants in nonfunctional positions within the ZF domains; FingerPrint, variants in the ZF fingerprint positions; C2H2, variants in the cysteine or histidine positions of the ZF domains; LoF, loss-of-function variants. (C) Correlation plot showing the Spearman's correlations between: the Z scores defined in B, level of natural selection (PAML dN/dS), and estimated age of KZFPs. The colors and their intensity represent the direction and strength of the correlations, with blue representing a positive and red a negative correlation. Only significant correlations after Bonferroni correction are shown. (D) Primate versus nonprimate KZFP constraint across indicated KZFP domains or residues. (E) Relative constraint of indicated regions for KZFPs inside versus outside clusters. P-values were calculated using the Wilcoxon rank-sum test (WRS).
Figure 3.
Figure 3.
Coding constraints of KZFP paralogs. (A) Distribution of C2H2 constraint Z scores for indicated sets of KZFP paralogs, arranged from top to bottom according to difference within pairs. Each KZFP is colored according to their respective age, with the line separating them colored as the mean age of the pair. The paralog within each pair with the most conserved fingerprint across evolutionary time is marked by a triangle, whereas less or identically conserved KZFPs are marked by a dot. The order of the y-axis labels corresponds to the order of the colored points on the graph. (B) Differential constraint Z scores for indicated domains of paralogs ZNF160 and ZNF665. (C) Zinc fingerprints of ZNF160 and ZNF665 with the scaled minor allele frequency (MAF) of identified missense variants indicated on the sides. Gray lines indicate identical zinc fingerprints. (D) Consensus DNA binding motifs of ZNF160 and ZNF665. (E) Venn diagram of ChIP-exo peaks of ZNF160 and ZNF665 in HEK293T cells.
Figure 4.
Figure 4.
Profiling of the human KZFPs. Pie chart of the data on all 378 protein-coding KZFPs. “No overexpression” indicates the number of KZFPs where the codon-optimized construct did not yield sufficient protein. “No transcript” represents KZFPs with no annotated transcript containing both the KRAB and zinc finger domains simultaneously. “No DNA synthesis” indicates the number of KZFP CDSs that could not be synthesized, with a minimum of two tries. “de Tribolet-Hardy et al. 2023” refers to the present work.
Figure 5.
Figure 5.
Targets of human KZFPs. (A) Bar graph showing the fraction of peaks over repetitive element (RE) families for all our conducted experiments (x-axis) (external data are shown in Supplemental Fig. S5), ordered by the most enriched family, indicated by the horizontal bar below along with the number of KZFPs for each category. Significant enrichments (FDR > 0.05) are shown in fully opaque colors whereas nonsignificant enrichments are transparent. The leftmost bar shows the percentage of the genome occupied by each RE family. Replicate experiments are indicated by black squares above the horizontal bar. Different aspects of each KZFP are shown below the horizontal bar: vK = variant KRAB according to Helleboid et al. (2019), REP/ACT = repressor and activator KZFPs according to Tycko et al. (2020), SCAN/DUF = KZFP carrying an additional SCAN or DUF3669 domain. Age: Black = >105 myo, dark gray = >105 myo years (placental mammals), light gray = > 74 myo years (primates), white = no data. The total number of peaks per experiment is indicated in brackets after the KZFP name below each bar. Names of KZFPs with new data are shown in saturated black; previously published KZFPs are shown in gray. (B) Bar graph showing the genome occupancy of targeted TE subfamilies. The left stack of bars shows the fractions of the genome covered by TEs, the central stack shows the coverage by all TE subfamilies which are targeted by a KZFP (FDR > 0.05), and the right stack shows the coverage of the TE subfamilies which are the primary target of one or more KZFPs (10% highest −log10[FDR]). Bars are colored according to the TE families to which the subfamilies belong, with the same color code as in A. (C) Age of KZFP and their target TEs. KZFPs (rows) are ordered by age, shown as a red line. Their targets are split into different subplots by family (excluding families targeted by <20 KZFPs) and their age is shown as black or gray bars with a dot on top. The gray level of the TE targets shows the level of enrichment of the given KZFP for the subfamily with black showing the target with the highest −log10(FDR) linearly scaling to 0 (white). If the KZFP is enriched on several subfamilies of the same family, the lowest FDR is shown. Red dots indicate KZFPs which are unlikely to interact with TRIM28 as defined by Helleboid et al. (2019). KZFPs with new data presented in this study are marked by a cross.
Figure 6.
Figure 6.
TE families are targeted by multiple KZFPs. (A) Bar graphs showing the TE subfamilies targeted by the largest number of different KZFPs. Only KZFPs targeting the subfamily as their primary targets were considered (−log10(FDR) within 10% of the highest ­−log10(FDR) for that KZFP). (B) KZFP signal over the multiple sequence alignment (MSA) of SVA subfamilies A to F. Top: Line graph of the normalized cumulative reads for each position from the indicated ChIP-seq and -exo experiments. External data sets are marked with stars. Bottom: MSA plot of 100 of the longest SVA sequences for each subfamily indicated on the left, 200 bp of nonaligned extensions are added around elements shown in gray, white depicts aligned regions, and black gaps in the alignment. For visibility, places in the alignment (columns) with more than 85% gaps were removed. The approximate different domains of the SVAs are indicated below, adapted from Hancks and Kazazian (2010); the star indicates the center region for C. (C) Signal over the low alignment region of the remaining SVA binders centered on the 3′ end of the VNTR (without alignment of sequences). ChIP signals for KZFPs enriched on SVAs are shown in red (ZFP57, ZFP92*, ZNF14*, ZNF141, ZNF155*, ZNF215, ZNF25, ZNF256, ZNF263, ZNF268*, ZNF28, ZNF30, ZNF41*, ZNF415*, ZNF461*, ZNF500*, ZNF556*, ZNF560*, ZNF57*, ZNF587B*, ZNF597, ZNF624*, ZNF641, ZNF689*, ZNF699*, ZNF747*, ZNF813*, ZNF852*, and ZNF878*; * = new data in this publication) with the signal for ZNF141 shown in dark red. Input signals for the presented ChIPs are shown in blue. (D,E) Binding sites of KZFPs on L1PA3 and L1HS elements. Elements were aligned the same way as in A and the normalized ChIP-seq and -exo signals are shown for each aligned position. External data sets are marked with stars. K = standard KRAB, k = variant KRAB, D = DUF domain, R = repressor; according to Helleboid et al. (2019) and Tycko et al. (2020). (D) 1000 L1PA3 elements were aligned. (E) 382 full-length L1HS elements were aligned. Multimapped reads were included for the signals in panels BE.
Figure 7.
Figure 7.
Evolution of TE-KZFP interaction. (A) Network for cluster Chr 1.1 in which targets (circles) of each KZFP (squares) are shown as connected edges and the amount of binding is represented by the line thickness. The thickest line for each KZFP represents the TE subfamily with the highest −log10(FDR) and then scales linearly to the lowest value. For visibility, only the best targets (below) and shared targets (above) are shown. The TE subfamilies are colored according to their families. Primary targets for each KZFP are highlighted in red. (B) Zinc fingerprints of ZFP69 and ZFP69B. The DNA-contacting amino acids for zinc finger (ZF) are shown; differences are highlighted in red. (C) DNA binding motifs of ZFP69 and ZFP69B as identified by Weirauch et al. (2014). Regions of high similarity are framed by a black square. (D) Enrichment of peaks over different repetitive element subfamilies. Subfamilies with FDR > 0.01 are shown. The width of the colored bars represents the number of peaks per subfamily also shown as a number on the right of the bar. The black transparent bars represent the expected number of peaks following a random distribution. The FDR of the enrichment is shown with stars (FDR > 0.0001 = ****, >0.001 = ***, >0.01 = **, >0.05 = *, ≥0.05 = n.s.). Rows are ordered by FDR. The number next to the title indicates the total number of peaks for the experiment. Primary targets for each KZFP are highlighted in red and shared subfamilies between the two panels are indicated by black arrows. (E) MSA over the three most enriched targets of ZFP69 (left) and ZFP69B (right). Up to 200 elements for the indicated targets (blue, orange, and green) were aligned, selecting first elements overlapping with a peak and then the longest elements. White regions in the plots indicate aligned sequences; gray regions indicate gaps. The signal of ZFP69 and ZFP69B ChIPs was laid over their respective alignments in purple. The locations of their motifs from panel C are shown in red. The normalized signal can be seen as a line plot above the MSA plot.
Figure 8.
Figure 8.
Localization of multiple KZFPs targeting the same TE subfamily. (AC) Cluster location of the indicated KZFPs, which primarily bind the respective TE subfamilies. Duplicated clusters are marked with red arrows; external data sets are marked with stars. (A) Alignment of approximately 200 of the longest SVA_A to SVA_F elements. (B,C) Alignment of 1000 L1PA3 and MER11A elements. (D) Heatmap comparing the genomic locations of KZFP genes, the products of which target the same TE subfamilies, showing that they are spread across multiple gene clusters. Each square represents the indicated number (x-axis) of different KZFPs targeting the same TE subfamily and the number (y-axis) of KZFP gene clusters in which these KZFPs are located. Colors represent the frequency with which the number of KZFPs are found in the number of different clusters and are normalized for each column. Main panel: all KZFPs targeting a subfamily (FDR > 0.05). Inset: Only KZFPs primarily targeting a subfamily (−log10(FDR) within 10% of the highest −log10(FDR)).

References

    1. Ambrosini G, Groux R, Bucher P. 2018. PWMScan: a fast tool for scanning entire genomes with a position-specific weight matrix. Bioinformatics 34: 2483–2484. 10.1093/bioinformatics/bty127 - DOI - PMC - PubMed
    1. Arnold C, Matthews LJ, Nunn CL. 2010. The 10kTrees website: a new online resource for primate phylogeny. Evol Anthropol Issues News Rev 19: 114–118. 10.1002/evan.20251 - DOI
    1. Barnada SM, Isopi A, Tejada-Martinez D, Goubert C, Patoori S, Pagliaroli L, Tracewell M, Trizzino M. 2022. Genomic features underlie the co-option of SVA transposons as cis-regulatory elements in human pluripotent stem cells. PLoS Genet 18: e1010225. 10.1371/journal.pgen.1010225 - DOI - PMC - PubMed
    1. Barrett T, Wilhite SE, Ledoux P, Evangelista C, Kim IF, Tomashevsky M, Marshall KA, Phillippy KH, Sherman PM, Holko M, et al. 2013. NCBI GEO: archive for functional genomics data sets—update. Nucleic Acids Res 41: D991–D995. 10.1093/nar/gks1193 - DOI - PMC - PubMed
    1. Britten RJ, Davidson EH. 1969. Gene regulation for higher cells: a theory. Science 165: 349–357. 10.1126/science.165.3891.349 - DOI - PubMed

Publication types

Substances