

Small-area estimation and analysis of HIV/AIDS indicators for precise geographical targeting of health interventions in Nigeria. a spatial microsimulation approach
- PMID: 37730574
- PMCID: PMC10510115
- DOI: 10.1186/s12942-023-00341-8
Small-area estimation and analysis of HIV/AIDS indicators for precise geographical targeting of health interventions in Nigeria. a spatial microsimulation approach
Abstract
Background: Precise geographical targeting is well recognised as an indispensable intervention strategy for achieving many Sustainable Development Goals (SDGs). This is more cogent for health-related goals such as the reduction of the HIV/AIDS pandemic, which exhibits substantial spatial heterogeneity at various spatial scales (including at microscale levels). Despite the dire data limitations in Low and Middle Income Countries (LMICs), it is essential to produce fine-scale estimates of health-related indicators such as HIV/AIDS. Existing small-area estimates (SAEs) incorporate limited synthesis of the spatial and socio-behavioural aspects of the HIV/AIDS pandemic and/or are not adequately grounded in international indicator frameworks for sustainable development initiatives. They are, therefore, of limited policy-relevance, not least because of their inability to provide necessary fine-scale socio-spatial disaggregation of relevant indicators.
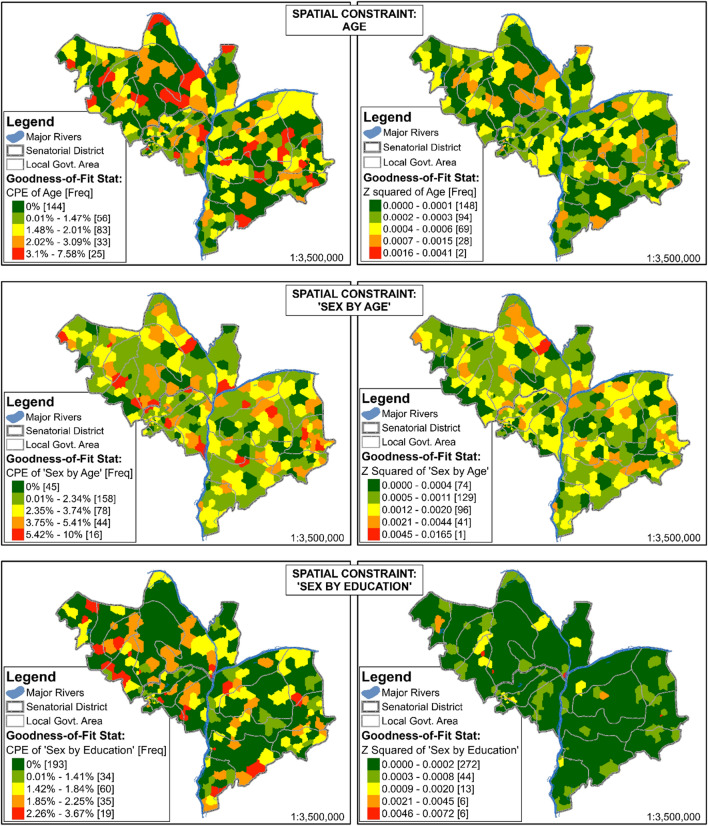
Methods: The current study attempts to overcome these challenges through innovative utilisation of gridded demographic datasets for SAEs as well as the mapping of standard HIV/AIDS indicators in LMICs using spatial microsimulation (SMS).
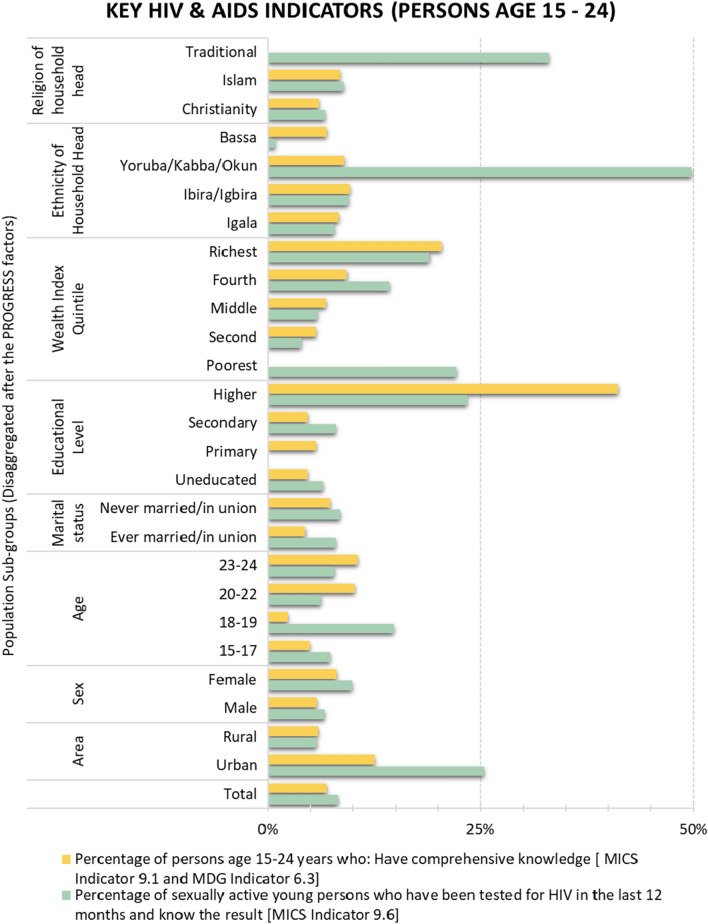
Results: The result is a spatially enriched synthetic individual-level population of the study area as well as microscale estimates of four standard HIV/AIDS and sexual behaviour indicators. The analysis of these indicators follows similar studies with the added advantage of mapping fine-grained spatial patterns to facilitate precise geographical targeting of relevant interventions. In doing so, the need to explicate socio-spatial variations through proper socioeconomic disaggregation of data is reiterated.
Conclusions: In addition to creating SAEs of standard health-related indicators from disparate multivariate data, the outputs make it possible to establish more robust links (even at individual levels) with other mesoscale models, thereby enabling spatial analytics to be more responsive to evidence-based policymaking in LMICs. It is hoped that international organisations concerned with producing SDG-related indicators for LMICs move towards SAEs of such metrics using methods like SMS.
Keywords: AIDS; Geographic targeting; HIV; Nigeria; Sexual behaviour; Small-Area estimation; Spatial microsimulation.
© 2023. BioMed Central Ltd., part of Springer Nature.
Conflict of interest statement
The authors have no competing interests as defined by BMC, or other interests that might be perceived to influence the results and/or discussion reported in this manuscript.
Figures


Similar articles
-
Evaluating social outcomes of HIV/AIDS interventions: a critical assessment of contemporary indicator frameworks.J Int AIDS Soc. 2014 Aug 25;17(1):19073. doi: 10.7448/IAS.17.1.19073. eCollection 2014. J Int AIDS Soc. 2014. PMID: 25160645 Free PMC article. Review.
-
Exploring the high-resolution mapping of gender-disaggregated development indicators.J R Soc Interface. 2017 Apr;14(129):20160825. doi: 10.1098/rsif.2016.0825. J R Soc Interface. 2017. PMID: 28381641 Free PMC article.
-
Mapping HIV prevalence in Nigeria using small area estimates to develop a targeted HIV intervention strategy.PLoS One. 2022 Jun 8;17(6):e0268892. doi: 10.1371/journal.pone.0268892. eCollection 2022. PLoS One. 2022. PMID: 35675346 Free PMC article.
-
The future of Cochrane Neonatal.Early Hum Dev. 2020 Nov;150:105191. doi: 10.1016/j.earlhumdev.2020.105191. Epub 2020 Sep 12. Early Hum Dev. 2020. PMID: 33036834
-
A review of geospatial methods for population estimation and their use in constructing reproductive, maternal, newborn, child and adolescent health service indicators.BMC Health Serv Res. 2021 Sep 13;21(Suppl 1):370. doi: 10.1186/s12913-021-06370-y. BMC Health Serv Res. 2021. PMID: 34511089 Free PMC article. Review.
Cited by
-
Spatiotemporal Analysis of HIV/AIDS Incidence in China From 2009 to 2019 and Its Association With Socioeconomic Factors: Geospatial Study.JMIR Public Health Surveill. 2024 Jun 7;10:e56229. doi: 10.2196/56229. JMIR Public Health Surveill. 2024. PMID: 38848123 Free PMC article.
References
-
- Grantham KL, Kerr CC, Wilson DP. Local responses to local epidemics for national impact need advanced spatially explicit tools. AIDS. 2016;30(9):1981. - PubMed
MeSH terms
LinkOut - more resources
Full Text Sources
Medical
