. 2023 Sep 20;22(1):156.
doi: 10.1186/s12943-023-01857-0.

Combined inhibition of Bcl-2 family members and YAP induces synthetic lethality in metastatic gastric cancer with RASA1 and NF2 deficiency

Affiliations

Combined inhibition of Bcl-2 family members and YAP induces synthetic lethality in metastatic gastric cancer with RASA1 and NF2 deficiency

Jong-Wan Kwon et al. Mol Cancer. .

Abstract

Background: Targetable molecular drivers of gastric cancer (GC) metastasis remain largely unidentified, leading to limited targeted therapy options for advanced GC. We aimed to identify molecular drivers for metastasis and devise corresponding therapeutic strategies.

Methods: We performed an unbiased in vivo genome-wide CRISPR/Cas9 knockout (KO) screening in peritoneal dissemination using genetically engineered GC mouse models. Candidate genes were validated through in vivo transplantation assays using KO cells. We analyzed target expression patterns in GC clinical samples using immunohistochemistry. The functional contributions of target genes were studied through knockdown, KO, and overexpression approaches in tumorsphere and organoid assays. Small chemical inhibitors against Bcl-2 members and YAP were tested in vitro and in vivo.

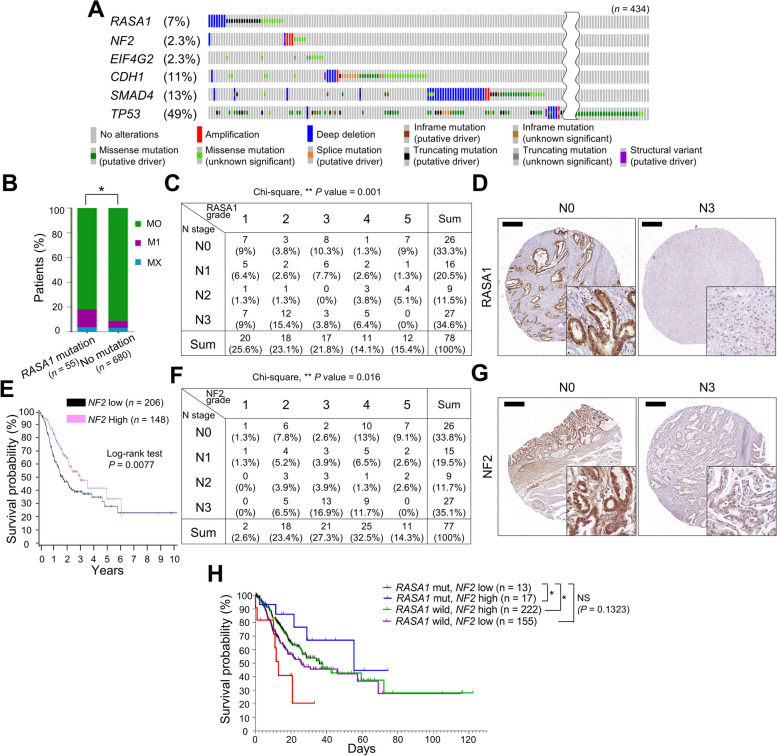
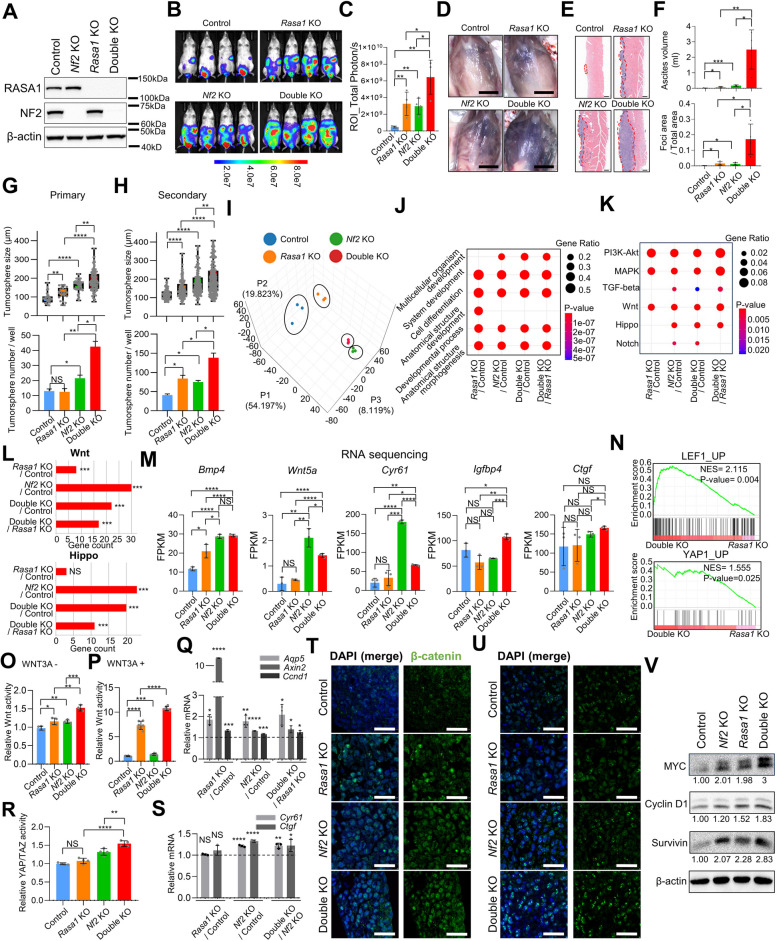
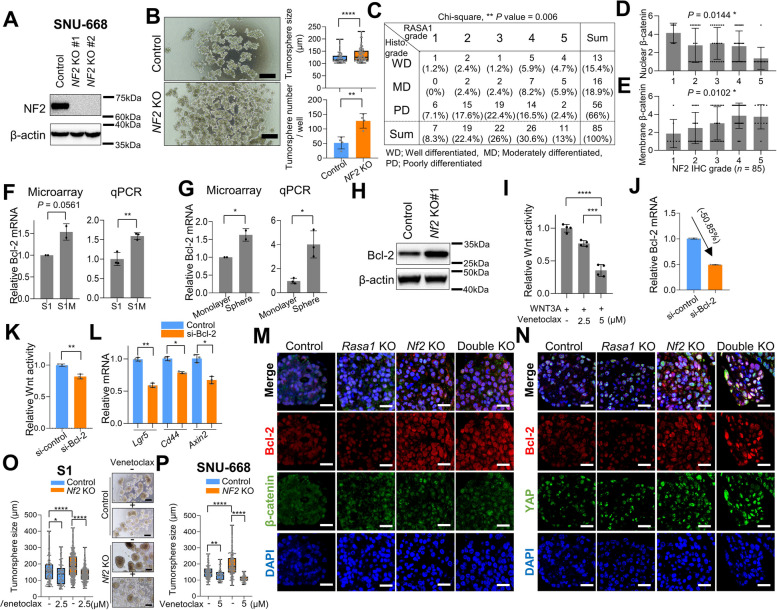
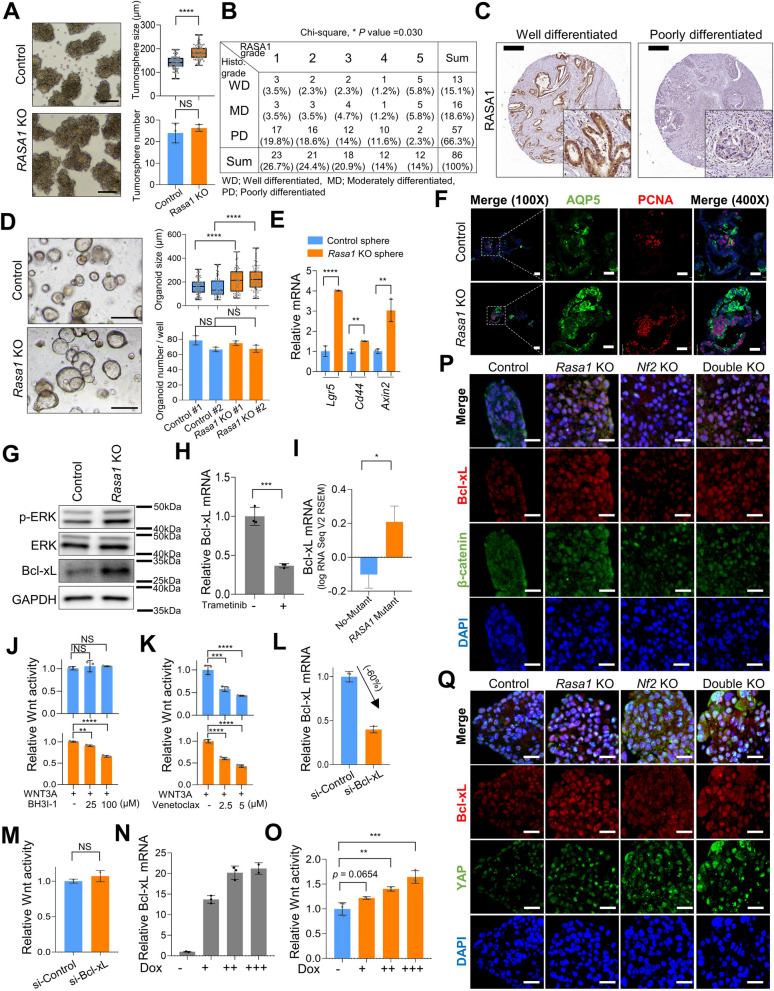
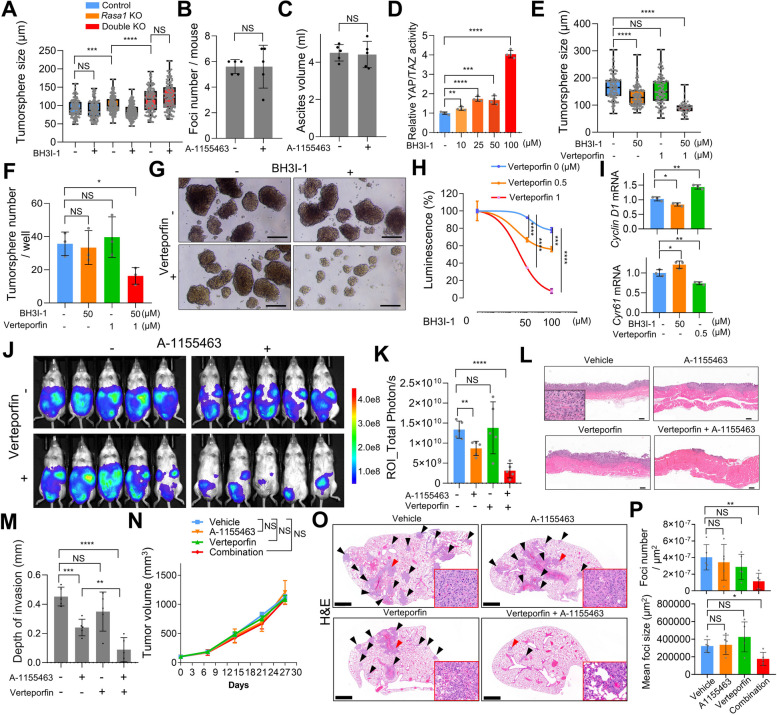
Results: We identified Nf2 and Rasa1 as metastasis-suppressing genes through the screening. Clinically, RASA1 mutations along with low NF2 expression define a distinct molecular subtype of metastatic GC exhibiting aggressive traits. NF2 and RASA1 deficiency increased in vivo metastasis and in vitro tumorsphere formation by synergistically amplifying Wnt and YAP signaling in cancer stem cells (CSCs). NF2 deficiency enhanced Bcl-2-mediated Wnt signaling, conferring resistance to YAP inhibition in CSCs. This resistance was counteracted via synthetic lethality achieved by simultaneous inhibition of YAP and Bcl-2. RASA1 deficiency amplified the Wnt pathway via Bcl-xL, contributing to cancer stemness. RASA1 mutation created vulnerability to Bcl-xL inhibition, but the additional NF2 deletion conferred resistance to Bcl-xL inhibition due to YAP activation. The combined inhibition of Bcl-xL and YAP synergistically suppressed cancer stemness and in vivo metastasis in RASA1 and NF2 co-deficiency.

Conclusion: Our research unveils the intricate interplay between YAP and Bcl-2 family members, which can lead to synthetic lethality, offering a potential strategy to overcome drug resistance. Importantly, our findings support a personalized medicine approach where combined therapy targeting YAP and Bcl-2, tailored to NF2 and RASA1 status, could effectively manage metastatic GC.

Keywords: CRISPR/Cas9; Cancer stem cells; Wnt pathway; YAP signaling.


Conflict of interest statement

The authors declare no competing interests.

Figures

Fig. 1
Fig. 1
Identification of GC metastasis-suppressing genes using CRISPR KO screening. A Schematic of the in vivo genome-wide CRISPR KO screen using a peritoneal dissemination model. B KO library coverage rates based on amplicon next-generation sequencing (NGS) analysis of input samples from three independent experiments. C Peritoneal dissemination rates in syngeneic mice intraperitoneally injected with KO library and control S1M cells. Necropsy was performed either upon showing clinical signs of malignancy or after 105 days post-injection. D Kaplan–Meier survival analysis of metastasis-free survival percentage in syngeneic mice injected with KO library and control S1M cells. The data represent the combined results of three independent screenings of sets. P value, Log-rank test was performed to compare the metastasis-free survival. E Representative gross images at the point of necropsy of syngeneic mice after intraperitoneal injection with control and KO library S1M cells. Bar = 1 cm. F Representative H&E-stained images of metastatic foci developed at peritoneum and diaphragm of syngeneic mice intraperitoneally transplanted with KO library S1M cells. Bar = 200 μm. G Representative Ki-67 immunohistochemical images of metastatic foci in the peritoneum from syngeneic mice intraperitoneally transplanted with KO library S1M cells. Bar = (top) 200 μm, (bottom) 50 µm. H Enriched gRNA-targeted genes were analyzed using TA cloning with Sanger sequencing (set 1) and amplicon NGS analyses (sets 2 and 3). Each color in pie charts represents a specific gene targeted by the gRNA and shows the relative read counts obtained from each mouse with metastasis. Genes with read counts less than 5% of the total are represented in the gray area. I Incidence rates of metastasis after intraperitoneal injection with individual candidate genes-KO cells into syngeneic mice. P value, Fisher's exact test; compared with the results of control cells. In all experiments, Student's t-test was used to obtain the p-value for statistical analysis, unless otherwise specified
Fig. 2
Fig. 2
Clinical significance of NF2 and RASA1 deficiency in human GC. A Oncoprint of RASA1, NF2, EIF4G2, CDH1, SMAD4, and TP53 mutations in GC. Each column represents one patient as identified in The Cancer Genome Atlas (TCGA) dataset. B Metastasis stage in GC patients depending on RASA1 mutation status in TCGA dataset, classified as M0 (no metastasis), M1 (metastasis present), and MX (metastasis cannot be assessed). P value, chi-square test. C Decreased RASA1 expression was associated with the advanced N stage in human GC tissue microarray (TMA). P value, chi-square test. D Representative RASA1 immunohistochemical images of human GC TMA tissues according to N stage. E Kaplan–Meier plots for the overall survival of patients with GC according to NF2 mRNA expression in the TCGA dataset. P value, log-rank test. F Decreased NF2 expression was associated with the advanced N stage in human GC TMA tissues. P value, chi-square test. G Representative NF2 immunohistochemical images of human GC TMA tissues according to N stage. H Kaplan–Meier plots for the overall survival of patients with GC according to RASA1 mutation and NF2 mRNA expression in TCGA dataset. P value, log-rank test
Fig. 3
Fig. 3
Cooperative enhancement of Wnt and YAP signaling in cancer stem cells by NF2 and RASA1 deficiency. A Western blot analysis of RASA1 and NF2 in control and KO S1M cells. B-F (B) Bioluminescence in vivo imaging of NOD-SCID mice 10 days after intraperitoneal transplantation of control, Nf2-, Rasa1- and Nf2/Rasa1-double-KO S1M cells (each of n = 4). (C) Total bioluminescence signals measured in each mouse. D Representative gross and (E) H&E images of each group. Red dashed lines indicate tumor area. Bar = (D) 1 cm, (E) 200 μm. F Effect of Rasa1- and Nf2-deficiency on peritoneal dissemination was evaluated using ascites volume (top) and number of macro-metastatic foci (bottom). G and H Sphere-forming assay using control, Rasa-, Nf2-, and Rasa1/Nf2-double-KO S1 cells. G Primary and (H) secondary tumorspheres (top) size and (bottom) number was measured. I Principal component analysis of RNA profiles obtained from control and KO S1 tumorspheres. Each dot represents a technical replication. J and K (J) GO and (K) KEGG pathway enrichment analysis of genes with significant expression changes (> threefold change) in KO cells compared to control cells. L Bar chart showing the differential activation of the Wnt and Hippo signaling pathways in KO cells compared to control cells, as determined by KEGG pathway analysis. M mRNA expression levels of YAP/TAZ-TEAD target genes in control, Rasa1-KO, Nf2-KO, and Rasa1/Nf2-double-KO S1 tumorspheres, as determined by RNA sequencing analysis. N Gene set enrichment analysis showing upregulation of Wnt and Hippo/YAP pathway-related genes in double-KO S1 tumorspheres compared to Rasa1-KO tumorspheres. O and P TOP-Flash luciferase reporter assay in control and KO S1M cells, depending on WNT3A stimulation; (O) conventional media, (P) 25 ng/ml of WNT3A. Q Relative mRNA expression of Wnt-dependent transcription (Aqp5, Axin2, and Ccnd1) in control and KO S1M cells (WNT3A, 25 ng/ml). R and S (R) HOP-Flash luciferase reporter assay and (S) relative mRNA expression of YAP-dependent transcription (Ctgf and Cyr61) in control, Rasa1-, Nf2-, and Rasa1/Nf2-double-KO S1 cells. T and U Immunofluorescence staining images of control and KO S1 tumorspheres using (T) active-β-catenin (green) and (U) YAP (green) with DAPI. Bar = 25 μm. V Western blot analysis of MYC, Cyclin D1 and Survivin in control and KO S1M cells (WNT3A, 25 ng/ml). Student's t-test was used for statistical analysis, unless otherwise specified
Fig. 4
Fig. 4
NF2 deficiency induces GC stemness and Wnt signaling via Bcl-2. A Western blot analysis of NF2 in control and NF2-KO SNU-668 cells. B Sphere-forming assay using control and NF2-KO SNU-668 cells. (left) Representative images of tumorsphere and (right) tumorsphere size (top) and number per well (bottom). Bar = 200 µm. C Low NF2 expression is associated with high histological grade in human GC tissue microarray (TMA) data. P value, chi-square test. D and E Immunohistochemical analysis of β-catenin expression in human GC TMA tissues according to NF2 expression. D Nuclear β-catenin, one-way ANOVA, P value = 0.0144, F = 3.320, (E) Membrane β-catenin, one-way ANOVA, P value = 0.0102, F = 3.552. F and G Microarray and reverse transcriptase-quantitative PCR (RT-qPCR) analysis of relative Bcl-2 mRNA expression in (F) monolayer culture of S1 and S1M cells and (G) monolayer and tumorsphere of S1 cells. H Western blot analysis of Bcl-2 in control and Nf2-KO S1M cells. I TOP-Flash luciferase reporter assay measuring Wnt pathway activity in venetoclax-treated S1M cells. Venetoclax was treated at the indicated concentrations for 24 h. J RT-qPCR analysis confirming Bcl-2 knockdown (KD) efficiency in S1M cells. K TOP-Flash luciferase reporter assay measuring Wnt pathway activity in control and Bcl-2 KD S1M cells. L Expression levels of Wnt-dependent transcription (Lgr5, Cd44, and Axin2) in control and Bcl-2 KD S1M cells. M and N Representative immunofluorescence images displaying Bcl-2 (red) paired with active-β-catenin (green) (M) and Bcl-2 (red) paired with YAP (green) (N) across control, Rasa1-KO, Nf2-KO, and Rasa1/Nf2-double-KO S1 tumorspheres. Bar = 25 µm. O and P Sphere-forming assay using control and Nf2-KO S1 (O) and control and NF2-KO SNU-668 (P) cells. Venetoclax treated at indicated concentrations for 5 days. Student's t-test was used for statistical analysis, unless otherwise specified
Fig. 5
Fig. 5
Synthetic lethality regulated by Bcl-2 and YAP signaling. A Relative cell viability of control and Nf2-KO S1 tumorspheres using luciferase ATP cell viability assay. Verteporfin was treated for 5 days at indicated doses. B Sphere-forming assay using Nf2-KO and Nf2/Yap1-double-KO S1 cells. Tumorspheres diameter (left) and counts (right). C TOP-Flash luciferase reporter assay in control and Yap1-KO S1M cells. D Relative mRNA expression of Wnt-dependent transcription (Axin2) in control and Yap1-KO S1M cells. E TOP-Flash luciferase reporter assay in S1M cells, verteporfin treated for 48 h at indicated doses. F Relative mRNA expression of Wnt-dependent transcription (Aqp5 and Axin2) in S1M cells treated with verteporfin (0.5 µM) for 48 h. G Relative Bcl-2 mRNA expression in Nf2-KO S1 cells treated with verteporfin for 48 h. H TOP-Flash luciferase reporter assay in control and Yap1-KO S1 cells treated with venetoclax and/or BH3I-1 for 48 h. I, J and K Sphere-forming assay of S1 cells treated with venetoclax (5 µM) and/or verteporfin (0.4 µM) for 5 days. Tumorsphere size (I) and number (J). K Representative images of S1 tumorspheres. Bar = 200 µm. L and M Sphere-forming assay using MKN-74 cells. Venetoclax (5 µM) and/or verteporfin (0.4 µM) treated for 5 days. Tumorsphere size (L) and number (M). N Relative mRNA expression of (top) Ccnd1 and (bottom) Cyr61 in S1M cells treated with venontoclax and/or verteporfin at indicated dose for 48 h. O, P and Q Nf2-KO S1M cells were peritoneally injected in NOD-SCID mice with treatment of control (n = 5), venetoclax (n = 4, 12 mg/kg, p.o.), verteporfin (n = 5, 10 mg/kg, i.p.), and combination of venetoclax and verteporfin (n = 4). O epresentative bioluminescence imaging of NOD-SCID mice 8 days after intraperitoneal transplantation of Nf2-KO S1M cells with drug treatment. P H&E images of peritoneal metastatic tissues. Bar = 200 µm. Q Proportion of metastatic foci area (top) and depth of invasion (bottom) depending on treatment. Student's t-test was used for statistical analysis
Fig. 6
Fig. 6
Effects of RASA1 deficiency on stemness via Bcl-xL. A (left) Representative images of tumorspheres of control (top) and RASA1-KO (bottom) SNU-484 cells. (right) Tumorsphere size (top) and counts (bottom). Bar = 200 µm. B Low RASA1 expression has correlation with high histological grade human gastric cancer (GC) in tissue microarray (TMA) tissue. P value, chi-square test. C Representative RASA1 immunohistochemical images of human GC TMA according to tumor cell differentiation. D Representative images of Tp53-KO mouse stomach organoids of control and Rasa1-KO. (top) Diameter of organoids and (bottom) number of organoids per well. Bar = 200 µm. E Relative mRNA expression levels of stem cell markers (Lgr5, Cd44, and Axin2) in control and Rasa1-KO mouse stomach organoids. F Representative immunofluorescence staining images for AQP5 (green), PCNA (red), and DAPI in control and Rasa1-KO Tp53-KO organoids represented in (D). Bar = 50 µm. G Western blot analysis of p-ERK, ERK, and Bcl-xL in control and Rasa1-KO S1M cells. H Bcl-xL mRNA expression in S1M cells treated with trametinib (60 nM) for 48 h. I Bcl-xL mRNA expression levels depending on RASA1 mutation status in TCGA GC dataset. J and K TOP-Flash luciferase reporter assay measuring Wnt pathway activity in control and Rasa1-KO S1M cells treated with (J) BH3I-1 and (K) venetoclax at the indicated concentrations for 24 h. L RT-qPCR analysis to confirm knockdown (KD) efficiency of Bcl-xL in S1M cells treated with si-Bcl-xL. M TOP-Flash luciferase reporter assay in control and Bcl-xL KD S1M cells. N RT-qPCR analysis measuring tetracycline induced Bcl-xL expression in S1M cells after doxycycline (Dox) treatment at multiple doses. O TOP-Flash luciferase reporter assay in tetracycline-induced Bcl-xL-overexpression S1M cells. P and Q Representative immunofluorescence images displaying Bcl-xL (red) paired with active-β-catenin (green) (P) and Bcl-xL (red) paired with YAP (green) (Q) across control, Rasa1-KO, Nf2-KO, and Rasa1/Nf2-double-KO S1 tumorspheres. Bar = 25 µm. Student's t-test was used for statistical analysis, unless otherwise specified
Fig. 7
Fig. 7
Therapeutic susceptibility of Rasa1-deficient gastric cancer (GC) to Bcl-xL inhibition. A and B Sphere-forming assay of control and Rasa1-KO S1 cells treated with BH3I-1 (25 µM) and/or venetoclax (5 µM). A Size and number of tumorspheres and (B) representative images of control and Rasa1-KO tumorspheres after BH3I-1 treatment. P value, Student’s T test. C and D Dose–response curve of relative cell viability after 5 days of treatment with BH3I-1 (C) and venetoclax (D) at the indicated concentrations in control and Rasa1-KO S1 tumorspheres using ATP cell viability luciferase assay. P value, Student’s T test. E Sphere-forming assay using SNU-484 and MKN-74 human GC cells treated with BH3I-1 at the indicated concentrations for 5 days. (left) Tumorsphere size and number and (right) representative images of SNU-484 (top) and MKN-74 (bottom) tumorspheres treated with vehicle and BH3I-1. P value, Student’s T test. F and G Sphere-forming assay using control and Rasa1-KO SNU-719 (F) and NCI-N87 (G) cells treated with BH3I-1 at the indicated concentrations for 5 days. The graph indicates the size (top) and number (bottom) of tumorspheres. P value, Student’s T test. H and I Effect of Bcl-xL inhibition on peritoneal dissemination was evaluated by intraperitoneally injecting control or Rasa1-KO S1M cells into NOD-SCID mice and treated with vehicle and A-1155463 (5 mg/kg, i.p., once daily) for 10 consecutive days. H Representative images of closed and opened peritoneum for each group. I Ascites volume (top) and number of macro-metastatic foci in each group (bottom) at the time of necropsy. P value, Student’s T test
Fig. 8
Fig. 8
Synthetic lethality regulated by Bcl-xL and YAP signaling. A Sphere-forming assay using control, Rasa1-KO, and Rasa1/Nf2-double-KO S1 cells treated with BH3I-1 (25 µM) for 5 days. B and C Effect of Bcl-xL inhibition on peritoneal dissemination model of Rasa1/Nf2-double-KO S1M cells in NOD-SCID mice treated with vehicle (n = 5) or A-1155463 (n = 5, 7.5 mg/kg, i.p., once daily) for 10 consecutive days. B Ascites volume and (C) macro-metastatic foci numbers measured at necropsy. D HOP-Flash luciferase reporter assay in BH3I-1-treated S1 cells after 48 h. E, F, and G Sphere-forming assay of Rasa1/Nf2-double-KO S1 cells treated with BH3I-1 (50 µM) and/or verteporfin (1 µM) for 5 days. E Tumorsphere size, (F) number, and (G) Representative images of tumorspheres. H Luciferase ATP cell viability assay of Rasa1/Nf2-double-KO S1 tumorspheres, treated with BH3-I and/or verteporfin for 5 days at indicated doses. I RT-qPCR analysis of mRNA expression levels of (top) Wnt-dependent transcription (Ccnd1) and (bottom) YAP-dependent transcription (Cyr61) depending on BH3-I and/or verteporfin treatment in Rasa1/Nf2-double-KO S1 tumorspheres. J-M (J) Bioluminescence in vivo imaging of NOD-SCID mice 8 days after intraperitoneal transplantation of in Rasa1/Nf2-double-KO S1M cells, treated with vehicle (n = 5), A-1155463 (n = 5, 7.5 mg/kg, i.p., once daily), verteporfin (n = 5, 10 mg/kg, i.p., every other day), or combination of both drugs (n = 5). K Total bioluminescence signals in (J). L Representative H&E-stained images of peritoneal metastatic foci. Bar = 200 μm. M Depth of invasion was measured based on H&E slides. N, O, and P (N) Subcutaneous tumor volume of Rasa1/Nf2-double-KO S1M cells treated with vehicle (n = 5), A-1155463 (n = 5, 7.5 mg/kg, i.p., once daily), verteporfin (n = 5, 10 mg/kg, i.p., every other day) or combination of both drugs (n = 5). O Representative histopathological images of pulmonary metastasis. Black arrows indicate metastatic foci. Red boxes represent magnified views of red arrow locations. Bar = 1 mm (P) Statistical analysis of pulmonary metastasis regarding the number of metastatic foci (top) and mean foci size (bottom). Student's t-test was used for statistical analysis, unless otherwise specified
Fig. 9
Fig. 9
Schematic representation of the methodology, clinical relevance, underlying mechanisms, and therapeutic implications presented in this study. We uncovered intricate interactions between Wnt and YAP signaling, regulated by RASA1 and NF2 deficiency in CSC biology. Our findings spotlight a novel therapeutic strategy: the inhibition of Bcl-2 family members and YAP signaling, potentially inducing synthetic lethality, particularly in NF2 and RASA1 deficient cases. This strategy opens up a potential path to counter drug resistance in highly metastatic GC

References

    1. Sung H, Ferlay J, Siegel RL, Laversanne M, Soerjomataram I, Jemal A, et al. Global Cancer Statistics 2020: GLOBOCAN Estimates of Incidence and Mortality Worldwide for 36 Cancers in 185 Countries. CA Cancer J Clin. 2021;71:209–249. doi: 10.3322/caac.21660. - DOI - PubMed
    1. Riihimäki M, Hemminki A, Sundquist K, Sundquist J, Hemminki K. Metastatic spread in patients with gastric cancer. Oncotarget. 2016;7:52307–52316. doi: 10.18632/oncotarget.10740. - DOI - PMC - PubMed
    1. Yang D, Hendifar A, Lenz C, Togawa K, Lenz F, Lurje G, et al. Survival of metastatic gastric cancer: Significance of age, sex and race/ethnicity. J Gastrointest Oncol. 2011;2:77–84. - PMC - PubMed
    1. Bernards N, Creemers GJ, Nieuwenhuijzen GAP, Bosscha K, Pruijt JFM, Lemmens VEPP. No improvement in median survival for patients with metastatic gastric cancer despite increased use of chemotherapy. Ann Oncol. 2013;24:3056–3060. doi: 10.1093/annonc/mdt401. - DOI - PubMed
    1. Cancer Genome Atlas Research Network Comprehensive molecular characterization of gastric adenocarcinoma. Nature. 2014;513:202–209. doi: 10.1038/nature13480. - DOI - PMC - PubMed

Publication types

Substances

LinkOut - more resources