

A Novel pyroptosis-related signature for predicting prognosis and evaluating tumor immune microenvironment in ovarian cancer
- PMID: 37730669
- PMCID: PMC10512632
- DOI: 10.1186/s13048-023-01275-2
A Novel pyroptosis-related signature for predicting prognosis and evaluating tumor immune microenvironment in ovarian cancer
Abstract
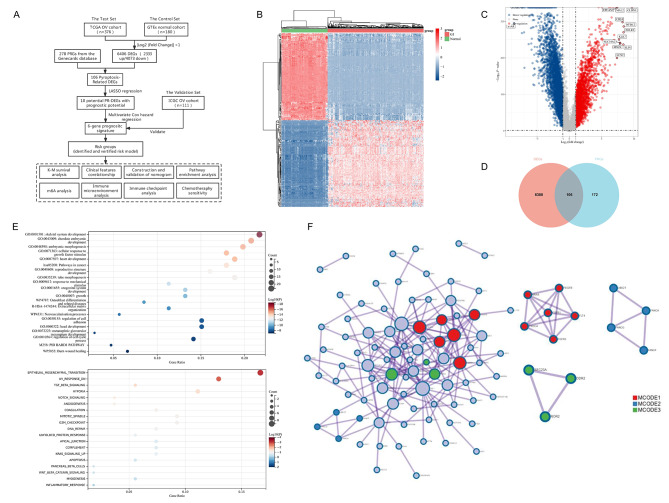
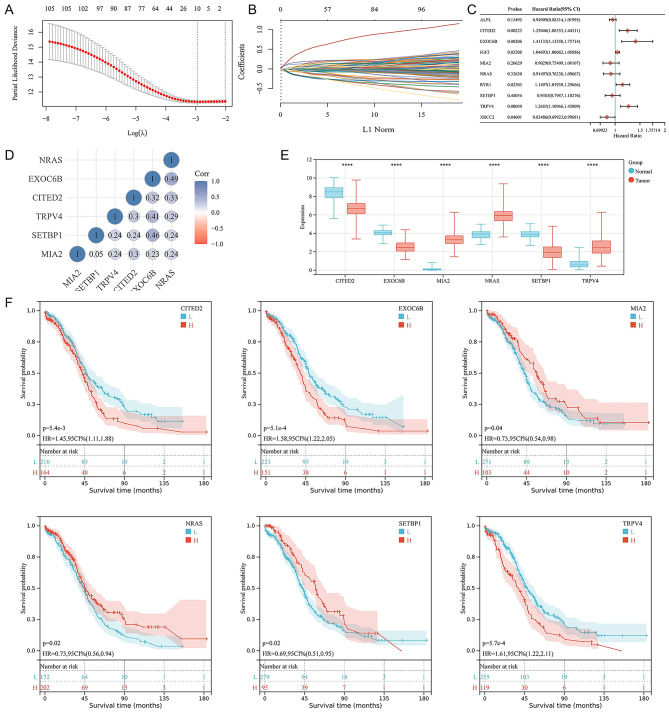
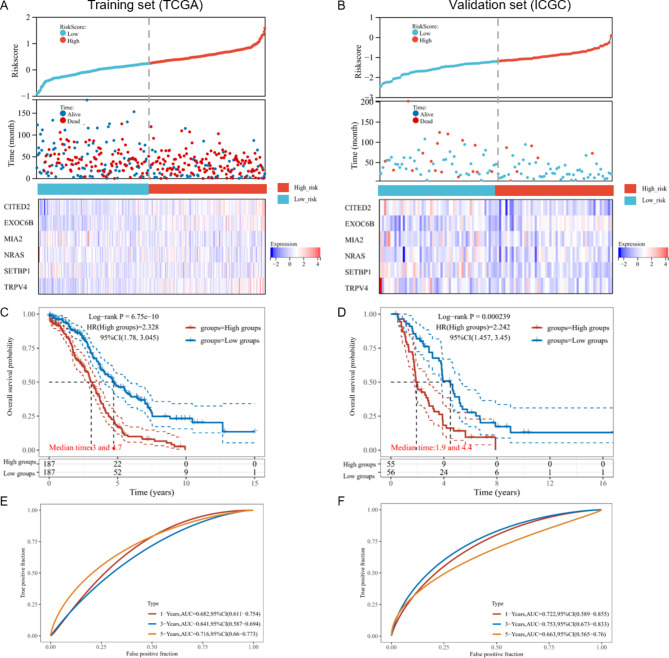
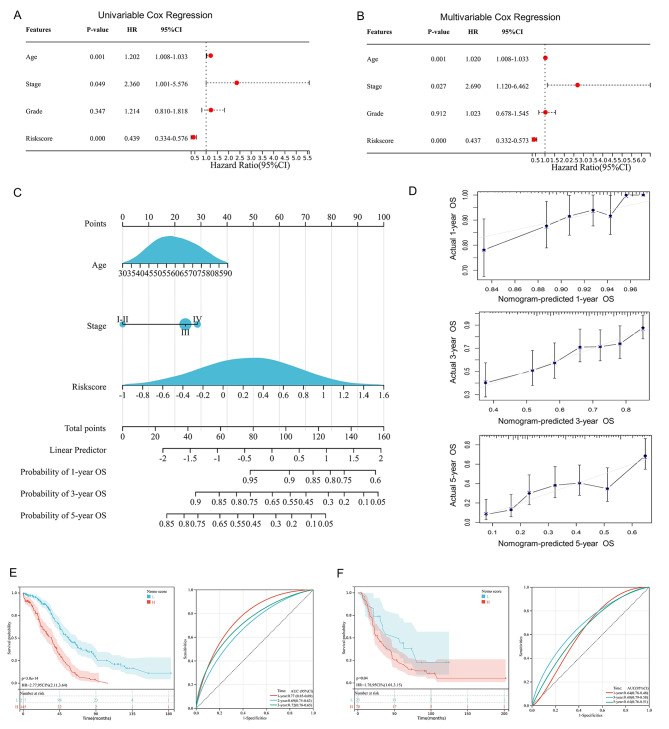
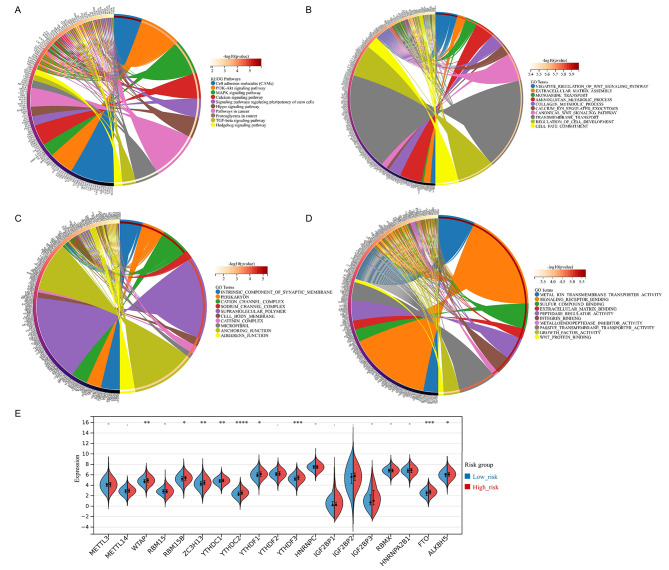
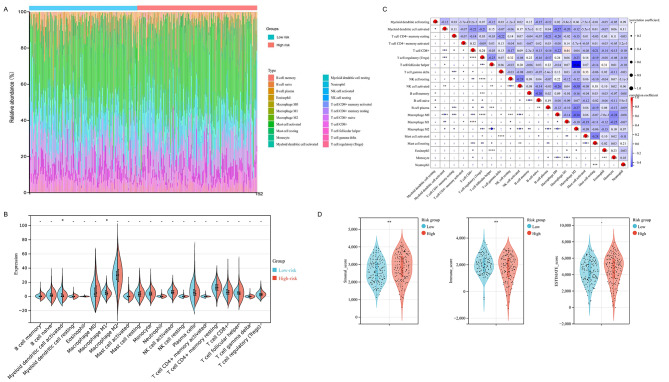
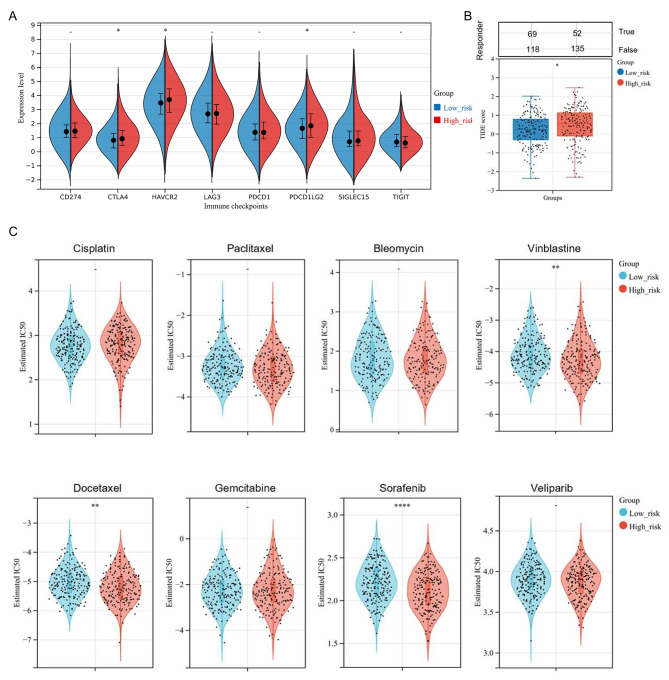
Ovarian cancer (OV) is the most fatal gynecological malignant tumor worldwide, with high recurrence rates and great heterogeneity. Pyroptosis is a newly-acknowledged inflammatory form of cell death with an essential role in cancer progression, though studies focusing on prognostic patterns of pyroptosis in OV are still lacking. Our research filtered 106 potential pyroptosis-related genes (PRGs) among the 6406 differentially expressed genes (DEGs) between the 376 TCGA-OV samples and 180 normal controls. Through the LASSO-Cox analysis, the 6-gene prognostic signature, namely CITED2, EXOC6B, MIA2, NRAS, SETBP1, and TRPV46, was finally distinguished. Then, the K-M survival analysis and time-dependent ROC curves demonstrated the promising prognostic value of the 6-gene signature (p-value < 0.0001). Furthermore, based on the signature and corresponding clinical features, we constructed and validated a nomogram model for 1-year, 2-year, and 3-year OV survival, with reliable prognostic values in TCGA-OV (p-value < 0.001) and ICGC-OV cohort (p-value = 0.040). Pathway analysis enriched several critical pathways in cancer, refer to the pyroptosis-related signature, while the m6A analysis indicated greater m6A level in high-risk group. We assessed tumor immune microenvironment through the CIBERSORT algorithm, which demonstrated the upregulation of M1 Macrophages and activated DCs and high expression of key immune checkpoint molecules (CTLA4, PDCD1LG2, and HAVCR2) in high-risk group. Interestingly, the high-risk group exhibited poor sensitivity towards immunotherapy and better sensitivity towards chemotherapies, including Vinblastine, Docetaxel, and Sorafenib. Briefly, the pyroptosis-related signature was a promising tool to predict prognosis and evaluate immune responses, in order to assist decision-making for OV patients in the realm of precision medicine.
Keywords: Ovarian cancer; Prognostic signature; Pyroptosis; Tumor immune microenvironment.
© 2023. BioMed Central Ltd., part of Springer Nature.
Conflict of interest statement
The authors declare no competing interests.
All the authors declared that the study was conducted without any financial or commercial relationships that might be construed as potential conflicts of interest.
Figures
Similar articles
-
A novel autophagy-related gene signature associated with prognosis and immune microenvironment in ovarian cancer.J Ovarian Res. 2023 Apr 29;16(1):86. doi: 10.1186/s13048-023-01167-5. J Ovarian Res. 2023. PMID: 37120633 Free PMC article.
-
Anoikis-related signature predicts prognosis and characterizes immune landscape of ovarian cancer.Cancer Cell Int. 2024 Feb 3;24(1):53. doi: 10.1186/s12935-023-03170-8. Cancer Cell Int. 2024. PMID: 38310291 Free PMC article.
-
Construction and validation of a novel ferroptosis-related signature for evaluating prognosis and immune microenvironment in ovarian cancer.Front Genet. 2023 Jan 5;13:1094474. doi: 10.3389/fgene.2022.1094474. eCollection 2022. Front Genet. 2023. PMID: 36685851 Free PMC article.
-
Pyroptosis and the tumor immune microenvironment: A new battlefield in ovarian cancer treatment.Biochim Biophys Acta Rev Cancer. 2024 Mar;1879(2):189058. doi: 10.1016/j.bbcan.2023.189058. Epub 2023 Dec 17. Biochim Biophys Acta Rev Cancer. 2024. PMID: 38113952 Review.
-
Unlocking ovarian cancer heterogeneity: advancing immunotherapy through single-cell transcriptomics.Front Oncol. 2024 May 30;14:1388663. doi: 10.3389/fonc.2024.1388663. eCollection 2024. Front Oncol. 2024. PMID: 38873253 Free PMC article. Review.
Cited by
-
Creation of an innovative diagnostic framework for hepatocellular carcinoma employing bioinformatics techniques focused on senescence-related and pyroptosis-related genes.Front Oncol. 2025 Feb 13;15:1485421. doi: 10.3389/fonc.2025.1485421. eCollection 2025. Front Oncol. 2025. PMID: 40018411 Free PMC article.
-
Research progress on the effect of pyroptosis on the occurrence, development, invasion and metastasis of colorectal cancer.World J Gastrointest Oncol. 2024 Aug 15;16(8):3410-3427. doi: 10.4251/wjgo.v16.i8.3410. World J Gastrointest Oncol. 2024. PMID: 39171180 Free PMC article. Review.
-
Prediction Model for Therapeutic Responses in Ovarian Cancer Patients using Paclitaxel-resistant Immune-related lncRNAs.Curr Med Chem. 2024;31(26):4213-4231. doi: 10.2174/0109298673281438231217151129. Curr Med Chem. 2024. PMID: 38357948 Free PMC article.
References
-
- Jacobs IJ, Menon U, Ryan A, Gentry-Maharaj A, Burnell M, Kalsi JK, Amso NN, Apostolidou S, Benjamin E, Cruickshank D, et al. Ovarian cancer screening and mortality in the UK Collaborative Trial of Ovarian Cancer Screening (UKCTOCS): a randomised controlled trial. Lancet. 2016;387(10022):945–56. doi: 10.1016/S0140-6736(15)01224-6. - DOI - PMC - PubMed
MeSH terms
Substances
Grants and funding
LinkOut - more resources
Full Text Sources
Medical
Research Materials
Miscellaneous
