. 2023 Sep 20;14(1):5825.
doi: 10.1038/s41467-023-41562-6.

Large T cell clones expressing immune checkpoints increase during multiple myeloma evolution and predict treatment resistance

Affiliations

Large T cell clones expressing immune checkpoints increase during multiple myeloma evolution and predict treatment resistance

Cirino Botta et al. Nat Commun. .

Abstract

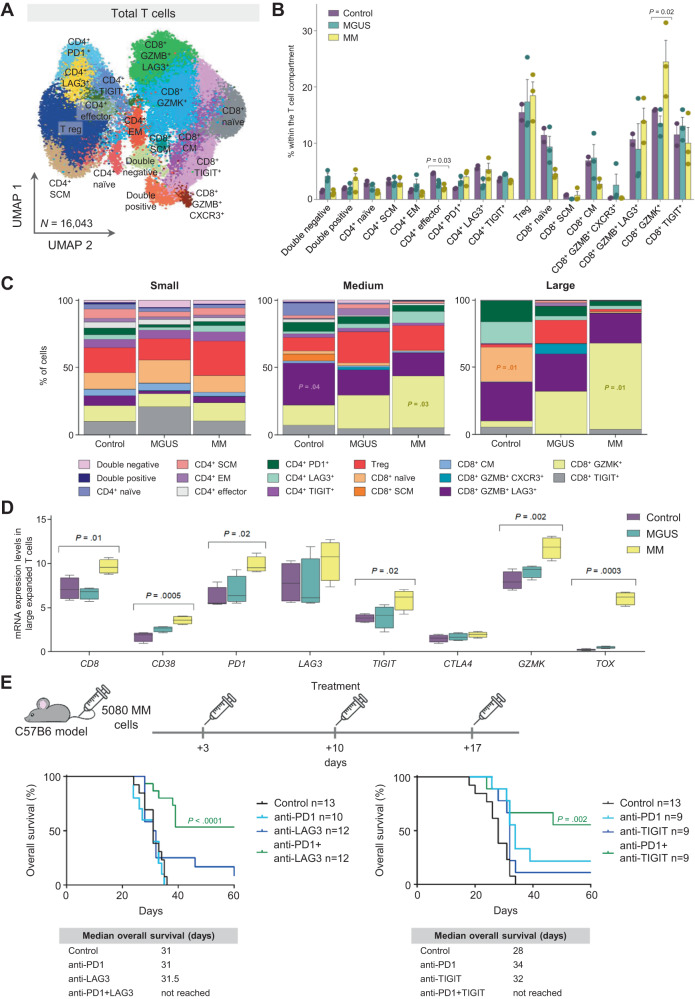
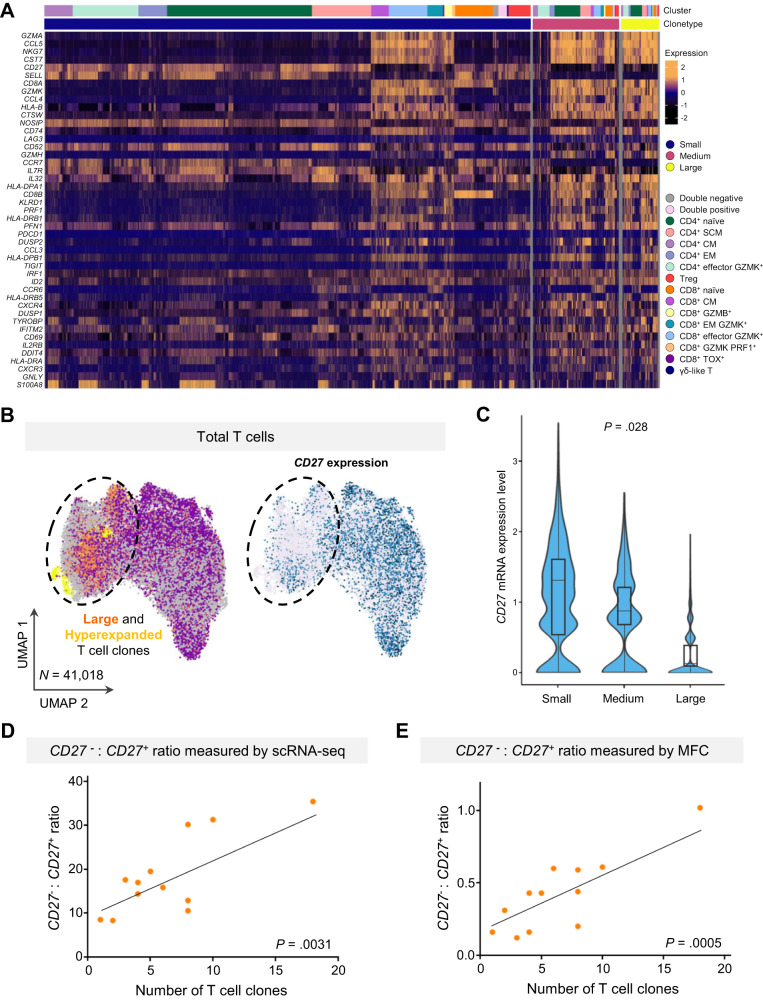
Tumor recognition by T cells is essential for antitumor immunity. A comprehensive characterization of T cell diversity may be key to understanding the success of immunomodulatory drugs and failure of PD-1 blockade in tumors such as multiple myeloma (MM). Here, we use single-cell RNA and T cell receptor sequencing to characterize bone marrow T cells from healthy adults (n = 4) and patients with precursor (n = 8) and full-blown MM (n = 10). Large T cell clones from patients with MM expressed multiple immune checkpoints, suggesting a potentially dysfunctional phenotype. Dual targeting of PD-1 + LAG3 or PD-1 + TIGIT partially restored their function in mice with MM. We identify phenotypic hallmarks of large intratumoral T cell clones, and demonstrate that the CD27- and CD27+ T cell ratio, measured by flow cytometry, may serve as a surrogate of clonal T cell expansions and an independent prognostic factor in 543 patients with MM treated with lenalidomide-based treatment combinations.


Conflict of interest statement

C.B. has served as a member on advisory boards for Amgen, Janssen, Pfizer, Takeda, and Oncopeptides; A.R. has received honoraria from Amgen, Celgene, and Janssen and a research grant from AstraZeneca and the Associazione Italiana per la Ricerca sul Cancro (AIRC): AIRC-IG-24689. H.G. has received speakers bureau honoraria from Academy2, KG, Agentur Hogg Robinson Germany, Amgen, ArtTempi, Beupdated Helbig Consulting and Research AG Schweiz, Bristol Myers Squibb, Celgene, Chop, Chugai, Congress Culture Concept Dr. S. Stocker München, Connectmedia Warschau/Polen, Dr. Hubmann Tumorzentrum München, FomF, GlaxoSmithKline, GWT Forschung und Innovation Dresden, Institut für Versorgungsforschung in der Onkologie GbR, Janssen, Kompetenznetz Maligne Lymphome, MedConcept, Medical Communication, Münchner Leukämie Labor Prof. Haferlach, New Concept Oncology, Novartis, Omnia Med Deutschland, Onko Internetportal DKG-web, Sanofi, STIL Forschungs, and Veranstaltungskonzept Gesundheit Mechernich, has served as a member on advisory boards for Adaptive Biotechnology, Amgen, Bristol Myers Squibb, Celgene, Janssen, Sanofi, and Takeda, and has received research grants and/or materials such as investigational medicinal products from Amgen, Bristol Myers Squibb, Celgene, Chugai, Dietmar-Hopp-Foundation, Janssen, John Hopkins University, and Sanofi. A. Oriol participated in advisory boards for Amgen, Celgene and Janssen. M.-V.M. has received honoraria for lectures from or participated in advisory boards for Janssen, Celgene, Amgen, Takeda, AbbVie, Adaptive, GSK, Pharmamar, EDO, and Oncopeptides. L.R. reports honoraria from Janssen, Celgene, Amgen, and Takeda. J.B. reports honoraria for lectures from Janssen, Amgen, Celgene, Takeda, and Oncopeptides. J.-J.L. reports honoraria from and membership on boards of directors or advisory committees with Takeda, Amgen, Celgene, and Janssen. J.F.S.-M. reports consultancy for Bristol-Myers Squibb, Celgene, Novartis, Takeda, Amgen, MSD, Janssen, and Sanofi and membership on a board of directors or advisory committee with Takeda. J.A.M.-C. has received research grants from Roche, Bristol-Myers Squibb-Celgene, and Janssen. B.P. reports honoraria for lectures from and membership on advisory boards with Adaptive, Amgen, Becton Dickinson, Bristol-Myers Squibb-Celgene, Janssen, Merck, Novartis, Roche, Sanofi and Takeda; unrestricted grants from Bristol-Myers Squibb-Celgene, EngMab, Roche, Sanofi, and Takeda; and consultancy for Bristol-Myers Squibb-Celgene, Janssen, Sanofi, and Takeda. The remaining authors declare no competing interests.

Figures

Fig. 1
Fig. 1. The T cell compartment in healthy, benign, and malignant bone marrow.
A Experimental design. Bone marrow aspirates were collected from four healthy adults, eight patients with the precursor states of monoclonal gammopathy of undetermined significance (MGUS) or smoldering multiple myeloma (SMM), and ten patients with active, newly-diagnosed multiple myeloma (MM). T cells were isolated using fluorescence activated cell sorting (FACS), followed by simultaneous, single-cell sequencing of RNA (scRNA-seq) and T cell receptors (scTCR-seq). B Uniform manifold approximation and projection (UMAP) of 16 T cell clusters identified with single-cell RNA sequencing, in bone marrow aspirates from four healthy adults, eight patients with MGUS/SMM, and ten patients with active, newly-diagnosed MM. C Relative distribution of the 16 clusters within the T cell compartment of healthy adults (n = 4), MGUS/SMM (n = 8) and MM (n = 10) patients. Error bars represent mean ± standard error mean (SEM). P values were calculated using the Kruskal–Wallis test, *p = 0.03, 0.04 and 0.02, **p = 0.007 from left to right. Source data are provided as a Source Data file. D Uniform manifold approximation and projection (UMAP) of the distribution of T cell clones in bone marrow T cells from healthy adults, MGUS/SMM and MM patients. E Bar chart showing clonal distribution in grouped healthy adults, MGUS/SMM and MM patients. T cell clones were categorized as small (range, 0–≤ 0.01), medium (range, 0.01–≤ 0.1) and large (range, 0.1–≤ 1) based on the percentage of each clonotype within total T cells. Source data are provided as a Source Data file. F Bar chart showing clonal distribution in individual cases.
Fig. 2
Fig. 2. Evolving phenotype of T cells during disease progression.
A Transcriptional phenotype of small, medium and large T cell clones in bone marrow aspirates from healthy adults, MGUS/SMM and MM patients. T cells from the 16 clusters were categorized as small (range, 0–≤ 0.01), medium (range, 0.01–≤ 0.1) and large (range, 0.1–≤ 1) based on the percentage of each clonotype within total T cells and were classified according to their abundance in each clone group. Source data are provided as a Source Data file. B Distribution of the 16 T cell clusters among small, medium and large T cell clones in bone marrow aspirates from four healthy adults, eight MGUS/SMM and ten MM patients. P values were calculated using the Kruskal–Wallis test. Source data are provided as a Source Data file.
Fig. 3
Fig. 3. ICB combination therapy tailored to the phenotype of large T cell clones.
A Uniform manifold approximation and projection (UMAP) of 17 T cell clusters identified with single-cell RNA sequencing, in bone marrow aspirates from two control mice, three mice with monoclonal gammopathy of undetermined significance (MGUS) and three mice with active multiple myeloma (MM). B Relative distribution of the 17 clusters within the T cell compartment of control (n = 2), MGUS (n = 3) and MM (n = 3) mice. Error bars represent mean ± standard error mean (SEM). P values were calculated using the Kruskal–Wallis test, *p = 0.03 and 0.02. Source data are provided as a Source Data file. C Distribution of the 17 T cell clusters among small, medium and large clones in bone marrow aspirates from control, MGUS and MM mice. P values were calculated using the Kruskal–Wallis test. Source data are provided as a Source Data file. D mRNA expression levels of CD8, CD38, PD1, LAG3, TIGIT, CTLA4, GZMK and TOX in T cells with large T cell clones in control (n = 2), MGUS (n = 3) and MM (n = 3) mice. Center and error bars represent median ± minimum and maximum. P values were calculated using the Kruskal–Wallis test. Source data are provided as a Source Data file. E A total of 10 × 106 cells from the MM5080 cell line were intravenously injected into 8-week-old C57BL/6 mice. This cell line was established from bone marrow MM cells from a P53-BIcγ1 mouse, which results from the addition of a heterozygous P53 deletion to BIcγ1 mice. Three days after cell injection, mice were randomly divided into experimental groups and received a weekly dose of anti-PD1 (200 µg; RMP1-14), anti-LAG3 (200 µg; C9B7W) or anti-TIGIT (200 µg; 1G9), as monotherapy or in combination for the three following weeks. Kaplan–Meier overall survival for each group of mice is shown at the bottom of the panel. P values were calculated using log-rank test.
Fig. 4
Fig. 4. T cell markers of clonality in MM.
A Heatmap of the most differentially expressed genes between T cells with small, medium and large T cell clones from four healthy adults, eight patients with benign monoclonal gammopathy of undetermined significance (MGUS) or smoldering multiple myeloma (SMM), and ten patients with active, newly-diagnosed multiple myeloma (MM). A log-transformed fold-change was used to measure gene expression. mRNA expression of CD27 in bone marrow T cells with small, medium and large T cell clones shown in a (B) uniform manifold approximation and projection (UMAP) and (C) violin plot. Center and error bars of the boxplots represent median ± minimum and maximum. P values were calculated using the Kruskal–Wallis test. D Association between the ratio of CD27 negative and positive (CD27: CD27+) T cells with the number of T cell clones analyzed by single-cell RNA and TCR sequencing (scRNA/TCR-seq). P values were calculated using the two-sided Pearson’s correlation test. Source data are provided as a Source Data file. E Association between the CD27: CD27+ ratio with the number of T cell clones analyzed by multidimensional flow cytometry (MFC). P values were calculated using the two-sided Pearson’s correlation test. Source data are provided as a Source Data file.
Fig. 5
Fig. 5. T cell markers of progression in MM.
A Uniform manifold approximation and projection (UMAP) of bone marrow cells from newly-diagnosed multiple myeloma (MM) patients. All samples were stained with the same eight-color monoclonal antibody combination described in the panel, and processed using standardized protocols. Computational flow cytometry was used to cluster bone marrow cells and to subcluster lymphocytes. A total of 22 clusters and subclusters were identified, including CD27 negative and positive T cells. B Progression-free survival of 271 transplant-ineligible MM patients enrolled in the PETHEMA/GEM-CLARIDEX clinical trial, stratified according to values of CD27: CD27+ ratio in T cells below vs equal or greater than the median value observed in the entire MM series (0.3). C Progression-free survival of 272 transplant-eligible MM patients enrolled in the PETHEMA/GEM2012MENOS65 clinical trial, stratified according to values of the CD27: CD27+ ratio in T cells below vs equal or greater than the median value observed in the entire MM series (0.3). D Multivariate analysis of progression-free survival (PFS) considering established risk factors at diagnosis (i.e., International Staging System [ISS] 3, high-risk cytogenetics defined by the presence of t(4;14), t(14;16) and/or del(17p), and elevated lactate dehydrogenase [LDH] levels) and the CD27: CD27+ ratio in T cells from MM (n = 543) patients. Blue dots represent the hazard ratio and bars represent the 95% confidence interval. Hazard ratio and 95% CI were determined using the regression coefficient of the Cox model. E Boxplots representing the percentage of tumor cell killing after culture in a 3D organoid model of the bone marrow of MM patients (n = 3) treated or not with 1 µM lenalidomide, with or without an anti-HLA antibody. Center and error bars represent mean ± SEM. P values were calculated using a two-sided Student’s t test. Source data are provided as a Source Data file.

References

    1. Waldman AD, Fritz JM, Lenardo MJ. A guide to cancer immunotherapy: from T cell basic science to clinical practice. Nat. Rev. Immunol. 2020;20:651–668. - PMC - PubMed
    1. Jhunjhunwala S, Hammer C, Delamarre L. Antigen presentation in cancer: insights into tumour immunogenicity and immune evasion. Nat. Rev. Cancer. 2021;21:298–312. - PubMed
    1. Zheng L, et al. Pan-cancer single-cell landscape of tumor-infiltrating T cells. Science. 2021;374:abe6474. - PubMed
    1. van der Leun AM, Thommen DS, Schumacher TN. CD8+ T cell states in human cancer: insights from single-cell analysis. Nat. Rev. Cancer. 2020;20:218–232. - PMC - PubMed
    1. Liu Z, et al. Detecting tumor antigen-specific T cells via interaction-dependent fucosyl-biotinylation. Cell. 2020;183:1117–1133.e19. - PMC - PubMed

Publication types

Substances