. 2023 Sep 20;14(1):5843.
doi: 10.1038/s41467-023-39824-4.

Evidence of a causal and modifiable relationship between kidney function and circulating trimethylamine N-oxide

Collaborators, Affiliations

Evidence of a causal and modifiable relationship between kidney function and circulating trimethylamine N-oxide

Petros Andrikopoulos et al. Nat Commun. .

Abstract

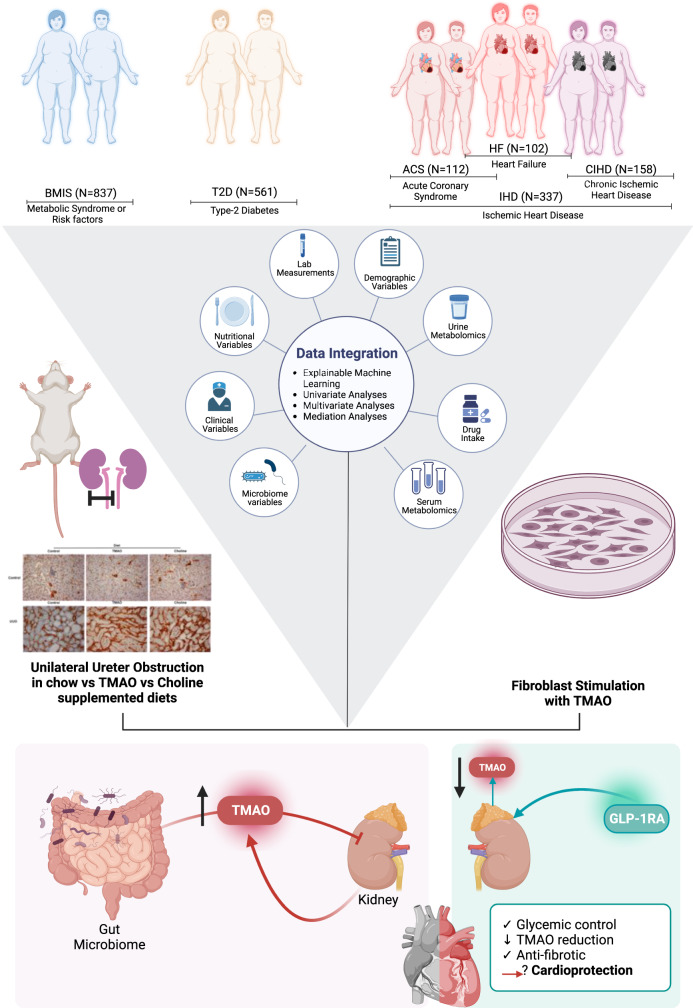
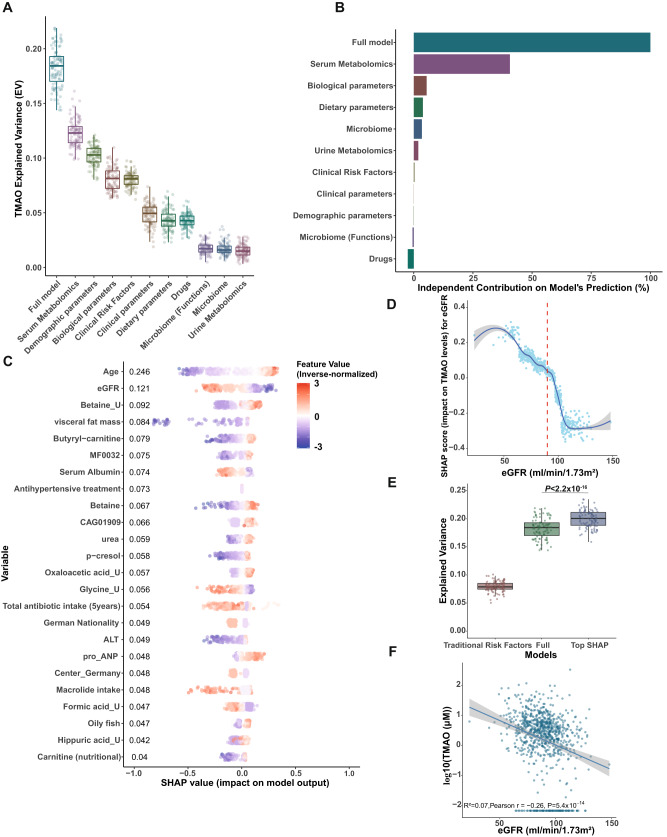
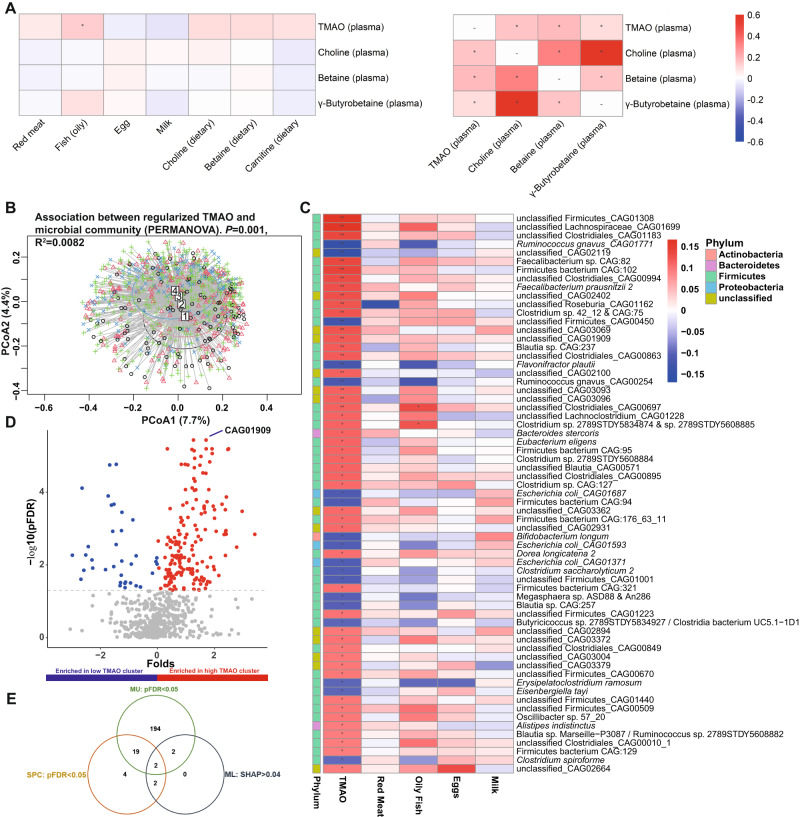
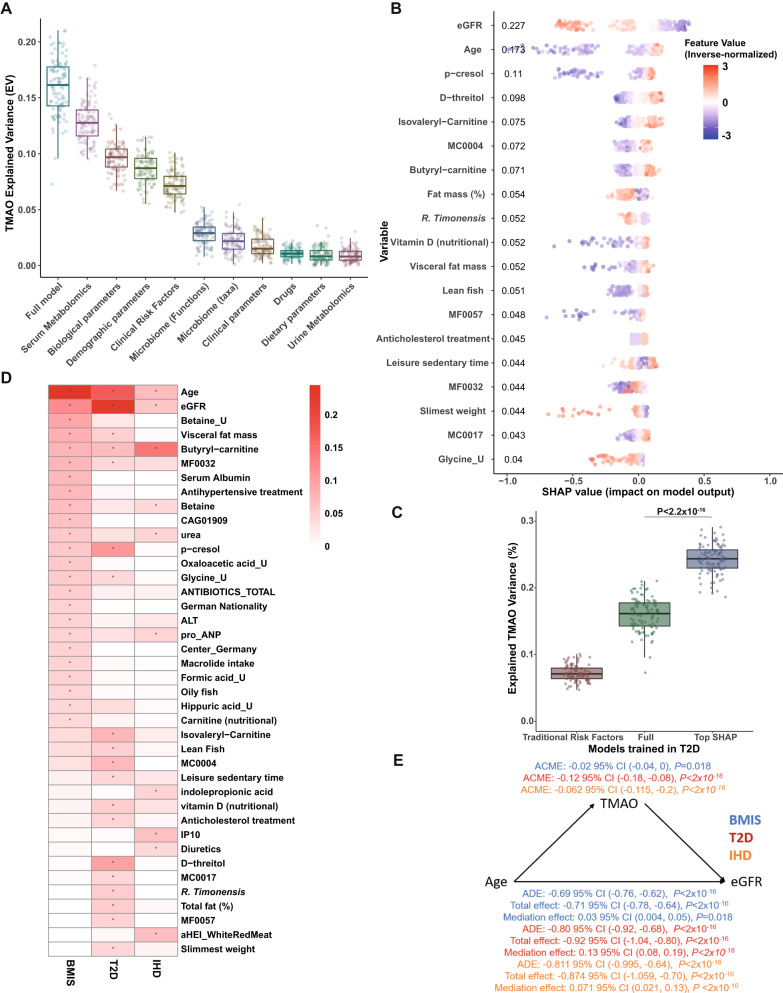
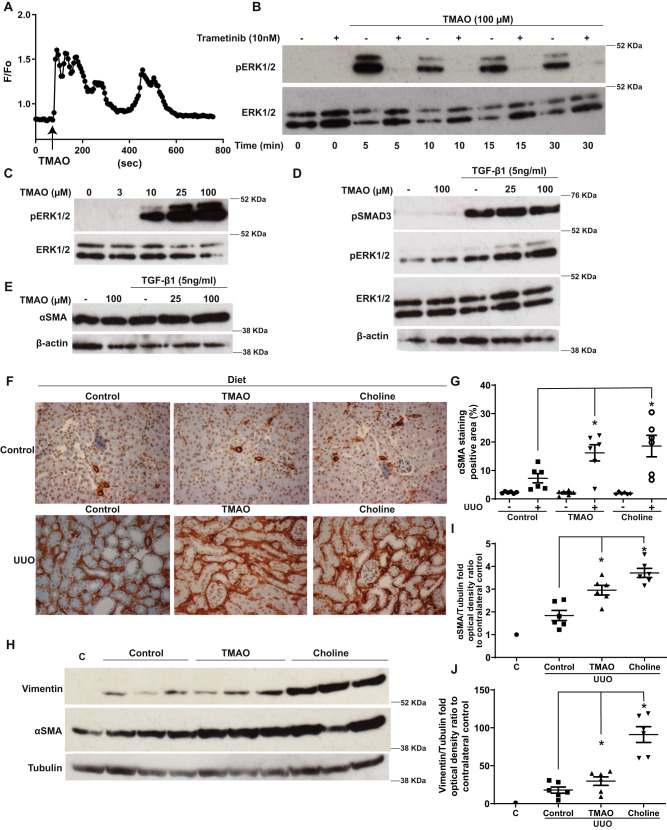
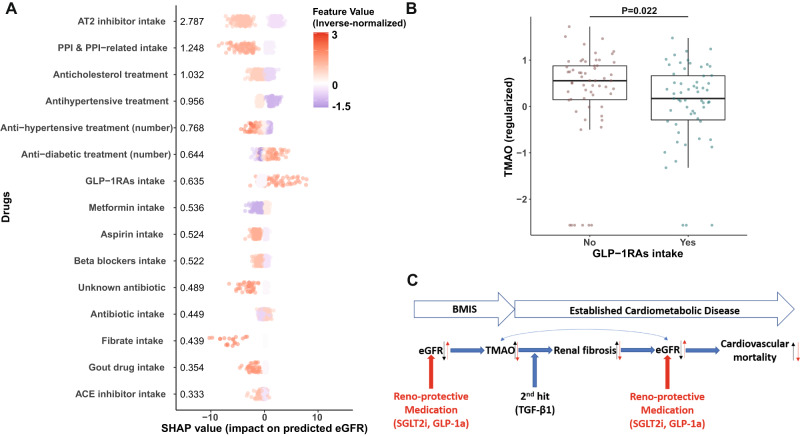
The host-microbiota co-metabolite trimethylamine N-oxide (TMAO) is linked to increased cardiovascular risk but how its circulating levels are regulated remains unclear. We applied "explainable" machine learning, univariate, multivariate and mediation analyses of fasting plasma TMAO concentration and a multitude of phenotypes in 1,741 adult Europeans of the MetaCardis study. Here we show that next to age, kidney function is the primary variable predicting circulating TMAO, with microbiota composition and diet playing minor, albeit significant, roles. Mediation analysis suggests a causal relationship between TMAO and kidney function that we corroborate in preclinical models where TMAO exposure increases kidney scarring. Consistent with our findings, patients receiving glucose-lowering drugs with reno-protective properties have significantly lower circulating TMAO when compared to propensity-score matched control individuals. Our analyses uncover a bidirectional relationship between kidney function and TMAO that can potentially be modified by reno-protective anti-diabetic drugs and suggest a clinically actionable intervention for decreasing TMAO-associated excess cardiovascular risk.


Conflict of interest statement

K.C. is a consultant for Danone Research, Ysopia, and CONFO therapeutics for work not associated with this study. K.C. held a collaborative research contract with Danone Research in the context of MetaCardis project. F.B. is a shareholder of Implexion Pharma AB. M.B. received lecture and/or consultancy fees from AstraZeneca, Boehringer-Ingelheim, Lilly, Novo Nordisk, Novartis, and Sanofi. The remaining authors declare no competing interests.

Figures

Fig. 1
Fig. 1. Overview of study design and main findings.
Here we used an integrated approach comprising Machine Learning (ML), multivariate, univariate, and mediation analyses to objectively characterize host parameters contributing to plasma TMAO levels in the multicenter European MetaCardis study. We observed that kidney function is the main modifiable factor consistently regulating fasting serum TMAO levels (Figs. 2–4) and corroborated our epidemiological findings in preclinical models where TMAO increased kidney scarring (Fig. 5). Further supporting the strong interplay between kidney function and fasting circulating TMAO, patients with T2D in the cohort prescribed new-generation anti-diabetics (GLP-1 Receptor Agonists; GLP-1RAs) with reno-protective effects had lower serum circulating TMAO levels when compared to propensity-score matched controls (Fig. 6). Created with BioRender.com.
Fig. 2
Fig. 2. Age and parameters associated with kidney function are the main drivers of circulating TMAO in BMIS MetaCardis participants.
A Coefficients of determination (Explained Variance; EV) of predicted circulating TMAO levels determined by xgboost algorithms after fivefold cross-validation in the left-out group (Supplementary Table 3 for n numbers and xgboost parameters), trained exclusively on variables from each feature category (Supplemental Data 1 for variables included in each group), or the full model (all variables), after 100 iterations. B Averaged independent predictive contribution of each feature category to full model predictions of plasma TMAO, trained as in (A), calculated as the average reduction of EV achieved in relation to the full model (set to 100%) after removing all variables belonging to each feature group after 100 iterations. C Swarm plots of impact on model output (SHAP values) for each BMIS individual with complete phenotypic data (N = 582) for all variables contributing more than 4% to model predictions of regularized TMAO standard deviation, as determined by xgboost algorithms trained on each feature category. Mean absolute SHAP values from all BMIS participants (N = 582) are shown (in descending order) next to each variable. Individual dots, representing each participant, are colored by the inverse-normalized value of the corresponding variable. U denotes urinary metabolites. D Dependance plot of eGFR values (x axis) versus their impact on model outcome (y axis) calculated for each individual in BMIS (N = 837) from algorithms trained on bioclinical variables, vertical red line indicates 90 mL/min/1.73 m2. The curve was drawn using locally weighted scatterplot smoothing (LOWESS) and the shaded area indicates 95% confidence interval (CI). E Boxplots depicting EV (R2) of circulating TMAO for BMIS participants computed from algorithms trained on clinical risk factors, the full model or all 24 variables contributing more than 4% of regularized TMAO standard deviation to predictions, as determined by SHAP analysis, after 100 iterations. Significance was determined by the two-sided Matt–Whitney test. F Linear-regression-based scatterplot showing correlation between serum TMAO (log-transformed) and estimated Glomerular Filtration Rate (eGFR, ml/min/1.73 m2). Insert; unadjusted Pearson’s r, P value and explained variance (R2). Shaded area indicates 95% CI. A, E Center lines denote medians, box limits indicate the 25th and 75th percentiles, whiskers extend to the minimal and maximal values. Source data are provided as a Source Data file.
Fig. 3
Fig. 3. Modest impact of diet and microbiota composition on circulating TMAO in BMIS MetaCardis subjects.
A Associations between circulating TMAO and its precursors with habitual consumption of food items rich in TMAO precursors (N = 763; left panel) or with its precursors themselves (right panel). B Principal coordinates analysis of Bray–Curtis dissimilarity matrices of participants (N = 834) stratified in TMAO clusters by the k-means algorithm (1 the lowest, 4 the highest) at the species level (input; 699 species present in at least 20% of the BMIS population). Insert; PERMANOVA (999 iterations) of taxonomic Bray–Curtis dissimilarity matrices association with regularized TMAO levels with age, sex, and country of recruitment as covariates. C Overlap of microbiome taxa significantly associated with circulating TMAO (Spearman partial correlations adjusted for age, sex country of recruitment and BMI) and the consumption of food items rich in TMAO precursors in BMIS participants (N = 763). D Volcano plot of differential bacterial species abundances between BMIS participants in the lowest (N = 101) and highest (N = 147) TMAO clusters (blue; taxa significantly depleted, red; taxa significantly enriched in the high TMAO cluster respectively, two-sided Mann–Whitney U test, pFDR<0.05). E Venn diagram summarizing the overlap between taxa associating with circulating TMAO according to our three complimentary analyses (SPC Spearman correlations, ML machine learning and feature attribution analysis; MU: two-sided Mann–Whitney U test between high and low TMAO clusters). For all *pFDR <0.05, **pFDR <0. 0.01. Source data are provided as a Source Data file.
Fig. 4
Fig. 4. Signatures predicting circulating TMAO shift in different disease groups and TMAO causally mediates eGFR decline with age.
A Explained Variance (EV) of predicted serum TMAO levels determined by boosted decision trees (Supplementary Table 4 for N numbers and optimized xgboost parameters per variable group), trained exclusively on variables from each variable category (Supplemental Data 1 for a list of variables included in each group), or the full model (containing all variables), after 100 iterations in T2D MetaCardis patients. B Swarm plots of SHAP values (impact on model outcome) for each T2D MetaCardis participant with complete phenotypic data (N = 387); represented by individual dots, for all variables contributing more than 4% to model predictions of regularized TMAO standard deviation, computed from xgboost algorithms trained on each feature category. Numbers denote mean absolute SHAP values from all T2D participants (in descending order) next to their corresponding variable. Dots are colored by the inverse-normalized value of their corresponding variable. C Boxplots depicting Explained Variance (EV; R2) of circulating TMAO in T2D individuals calculated by algorithms trained on clinical risk factors, the full model containing all variables or all the variables contributing more than 4% of regularized TMAO standard deviation to T2D model predictions, as determined by SHAP analysis, after 100 iterations. D Heatmap depicting all the variables contributing at least 4% of regularized TMAO standard deviation in model predictions as determined by SHAP analysis in at least one of the MetaCardis disease groups. *Μean absolute SHAP value > 0.04. E Mediation analysis (see “Methods”) computing the direct effect of TMAO on eGFR decline with age in BMIS (blue), T2D (red) or IHD (orange) MetaCardis participants. ADE: Average direct effect (of age on eGFR); ACME: average causal mediated effect (of TMAO on eGFR); Total effect: (cumulative effect of age and TMAO on eGFR (ADE + ACME)); Mediation effect: (% of the effect of age on eGFR attributed to TMAO). A, C Center lines denote medians, box limits indicate the 25th and 75th percentiles, whiskers extend to the minimal and maximal values. Source data are provided as a Source Data file.
Fig. 5
Fig. 5. TMAO promotes myofibroblast differentiation and exacerbates renal fibrotic injury.
A Representative ratiometric traces (340/380 nm) from Human Renal Fibroblasts (HRFs) loaded with the Ca2+ indicator Fura-2 and stimulated with 100 µM TMAO. B Serum-starved HRFs were preincubated with the MEK inhibitor trametinib (10 nM) for 30 min prior to stimulation with 100 µM TMAO for the indicated times. Phospho-ERK1/2 levels were probed by Western blot; membranes were stripped and re-probed for total ERK1/2. C Serum-starved HRFs were stimulated with the indicated concentrations of TMAO and phospho-ERK1/2 and total ERK1/2 levels were determined as in (B). HRFs in complete medium were preincubated with the indicated concentrations of TMAO for 30 min and stimulated with TGF-β1 (5 nM) or vehicle for 24 h. Phospho-ERK1/2, phospho-SMAD3 (D) and alpha-smooth muscle actin (αSMA) (E) levels were probed with western blot. Β-actin levels for (D, E) were probed in parallel western blots. For B–E a representative image from three independent biological repeats is shown. F Immunostaining with αSMA of kidney sections (×20 magnification) from obstructed (UUO; 5 days post-surgery) or contralateral sham-operated (control) kidneys. Animals were fed normal chow (control), a diet containing 0.12% w/w TMAO (TMAO) or 1% choline w/w (Choline) for 6 weeks prior to surgery, as indicated. n = 6 per group. G Quantification of positive αSMA staining as (%) of stained area/field of view averaged from 5 images per animal. H Western blot of whole-kidney lysates for αSMA and vimentin expression. Tubulin, as loading control, was probed in parallel western blots. A representative photomicrograph from n = 2 Western blots with n = 1 animals for control (non-ligated kidneys, chow diet; C) n = 6 animals for all other groups is shown. OD of the (I) αSMA and (J) vimentin bands in (H) normalized against tubulin. The normalized density of the sham-control samples was arbitrarily set to 1. For all graphs, error bars represent the mean ± SEM of data from n = 4–6 animals per group. *P < 0.05 versus the UUO control. Source data are provided as a Source Data file.
Fig. 6
Fig. 6. Reno-protective medication is associated with reduced circulating TMAO in MetaCardis participants with T2D.
A Swarm plots of impact on model eGFR predictions (SHAP values) for MetaCardis T2D individuals (N = 561) for the top 15 drugs, as determined by xgboost algorithms trained exclusively on prescribed medication. Mean absolute SHAP values from participants with T2D are shown (in descending order) next to each variable. Individual dots, representing each participant, are colored by the inverse-normalized value of the corresponding drug variable. B Comparison of circulating regularized TMAO levels between subjects with T2D prescribed GLP-1 receptor agonists (GLP-1Ras; N = 59) and non-GLP-1Ras treated subjects with T2D propensity-matched for age, sex, disease group, and hypertension status (N = 59) (Supplementary Table 6 for group characteristics). P value determined by two-sided Mann–Whitney U test. Center lines denote medians, box limits indicate the 25th and 75th percentiles, whiskers extend to the minimal and maximal values. C Summary of the main findings of our study. We demonstrate that eGFR, irrespective of disease stage, is the primary modifiable modulator of circulating TMAO. Far from being a bystander, TMAO significantly accelerates the rate of renal output decline by age, with its effect increasing at advanced stages of disease. TMAO promotes renal fibrosis in conjunction with established pathophysiology (two-hit” model) further negatively impacting renal clearance. Accordingly, medication with reno-protective properties (red arrows), such as GLP-1RAs, reduce circulating TMAO levels thereby potentially moderating its adverse effect on kidney function. Source data are provided as a Source Data file.

References

    1. Fan Y, Pedersen O. Gut microbiota in human metabolic health and disease. Nat. Rev. Microbiol. 2021;19:55–71. - PubMed
    1. Agus A, Clément K, Sokol H. Gut microbiota-derived metabolites as central regulators in metabolic disorders. Gut. 2021;70:1174–1182. - PMC - PubMed
    1. Li J, et al. Interplay between diet and gut microbiome, and circulating concentrations of trimethylamine N-oxide: findings from a longitudinal cohort of US men. Gut. 2022;71:724–733. - PMC - PubMed
    1. Romano KA, Vivas EI, Amador-Noguez D, Rey FE. Intestinal microbiota composition modulates choline bioavailability from diet and accumulation of the proatherogenic metabolite trimethylamine-N -Oxide. mBio. 2015;6:e02481–14. - PMC - PubMed
    1. Rath S, Heidrich B, Pieper DH, Vital M. Uncovering the trimethylamine-producing bacteria of the human gut microbiota. Microbiome. 2017;5:54. - PMC - PubMed

Publication types