. 2023 Sep 20;14(1):5856.
doi: 10.1038/s41467-023-41583-1.

Critical requirement of SOS1 for tumor development and microenvironment modulation in KRASG12D-driven lung adenocarcinoma

Affiliations

Critical requirement of SOS1 for tumor development and microenvironment modulation in KRASG12D-driven lung adenocarcinoma

Fernando C Baltanás et al. Nat Commun. .

Abstract

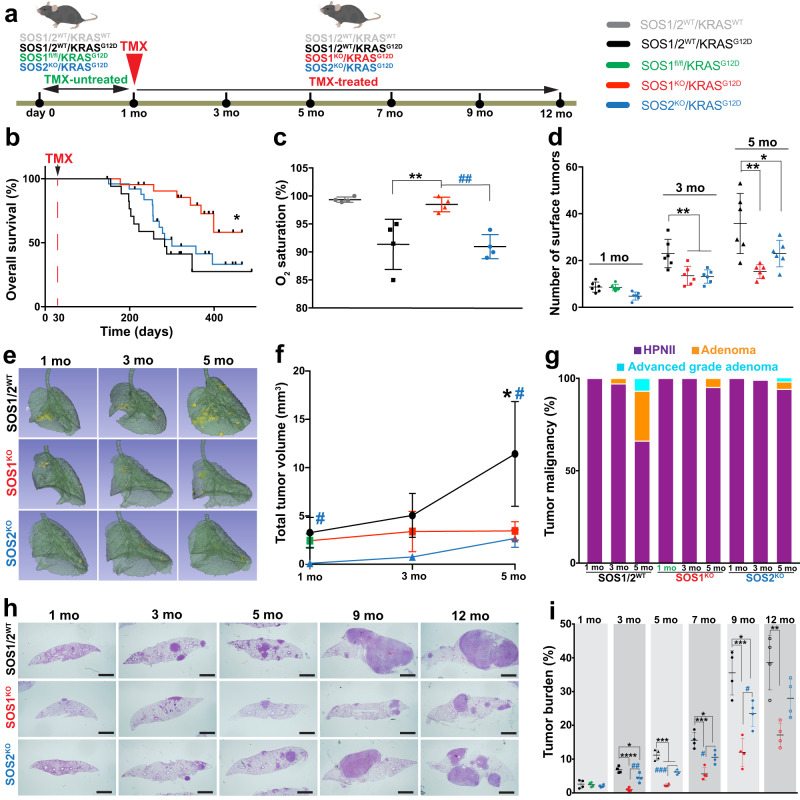
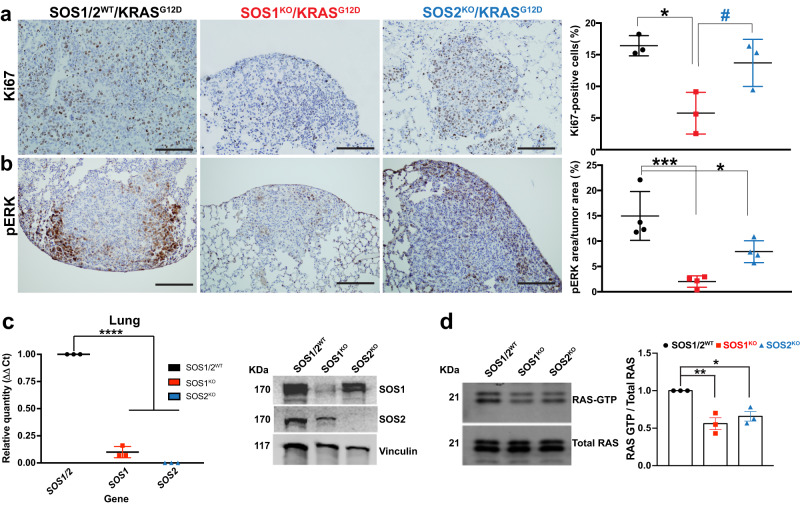
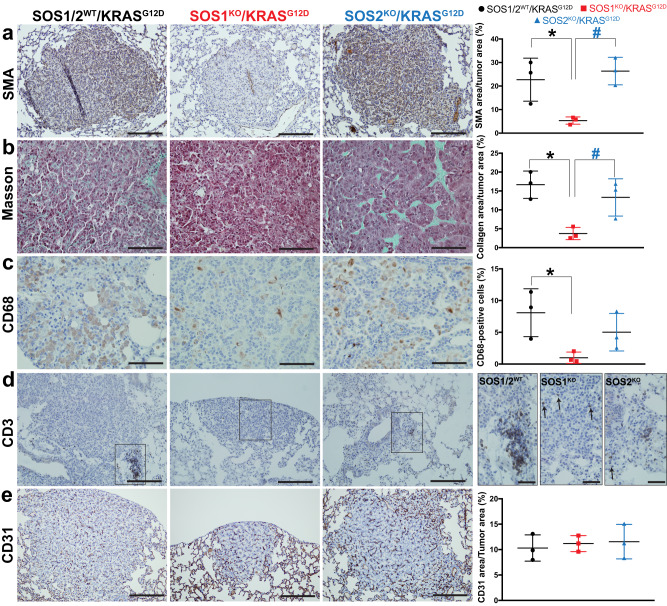
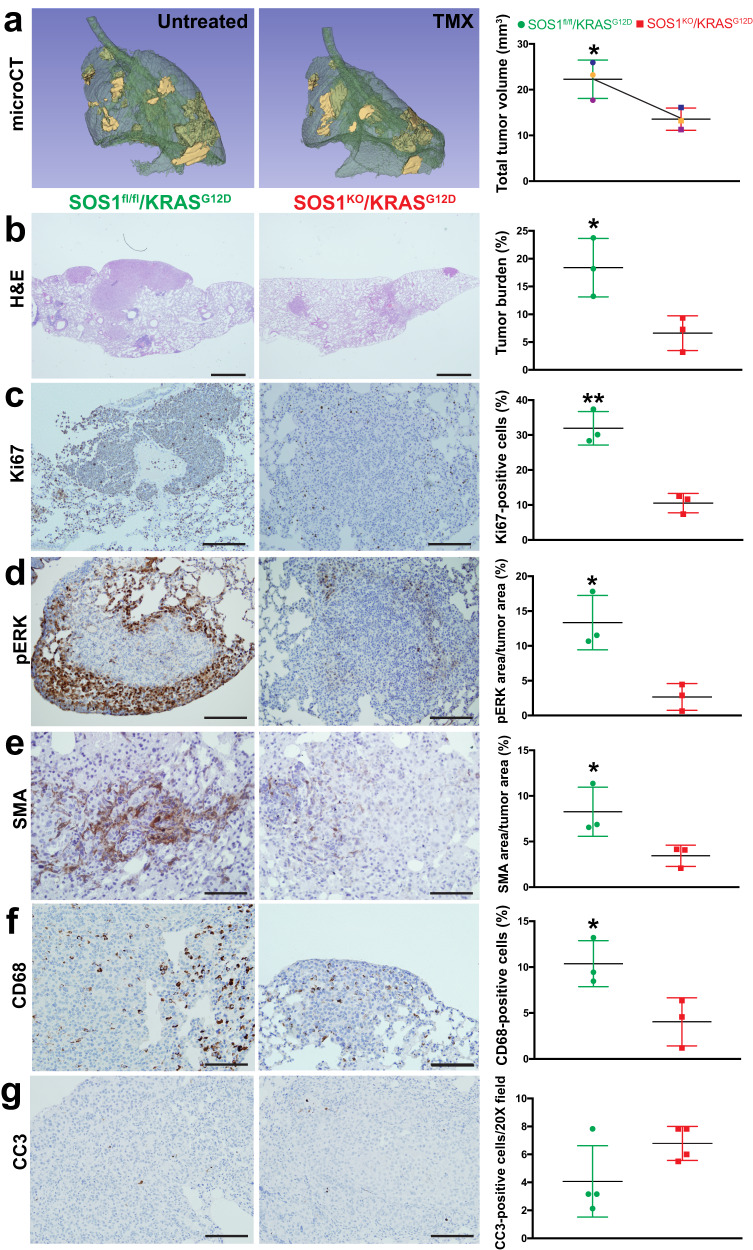
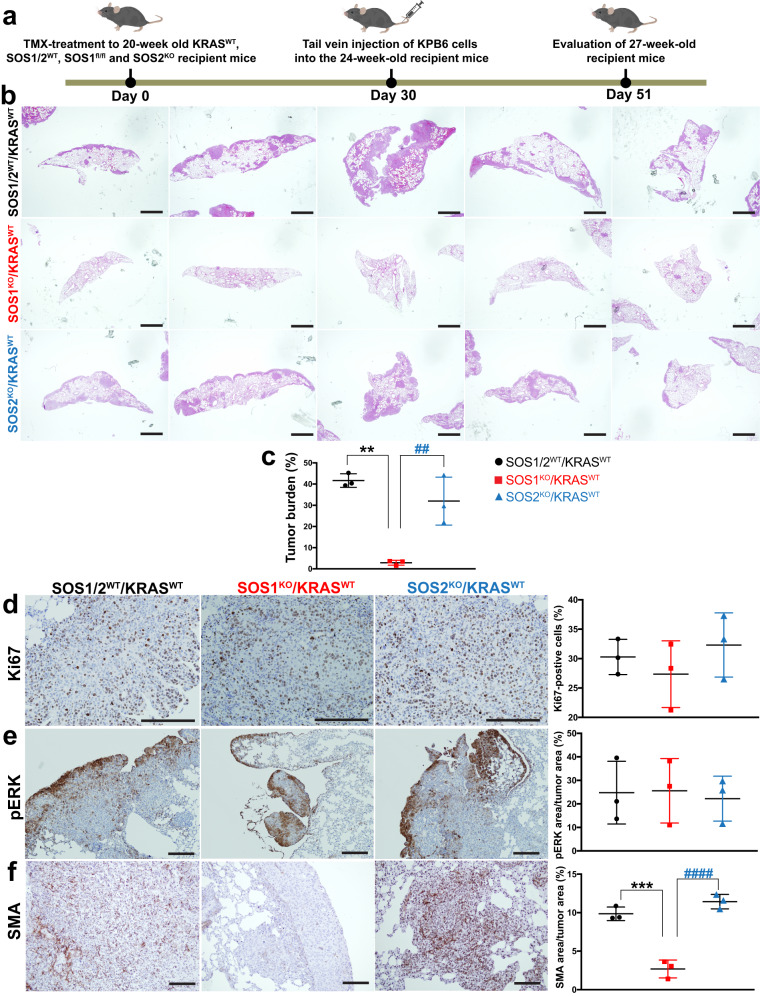
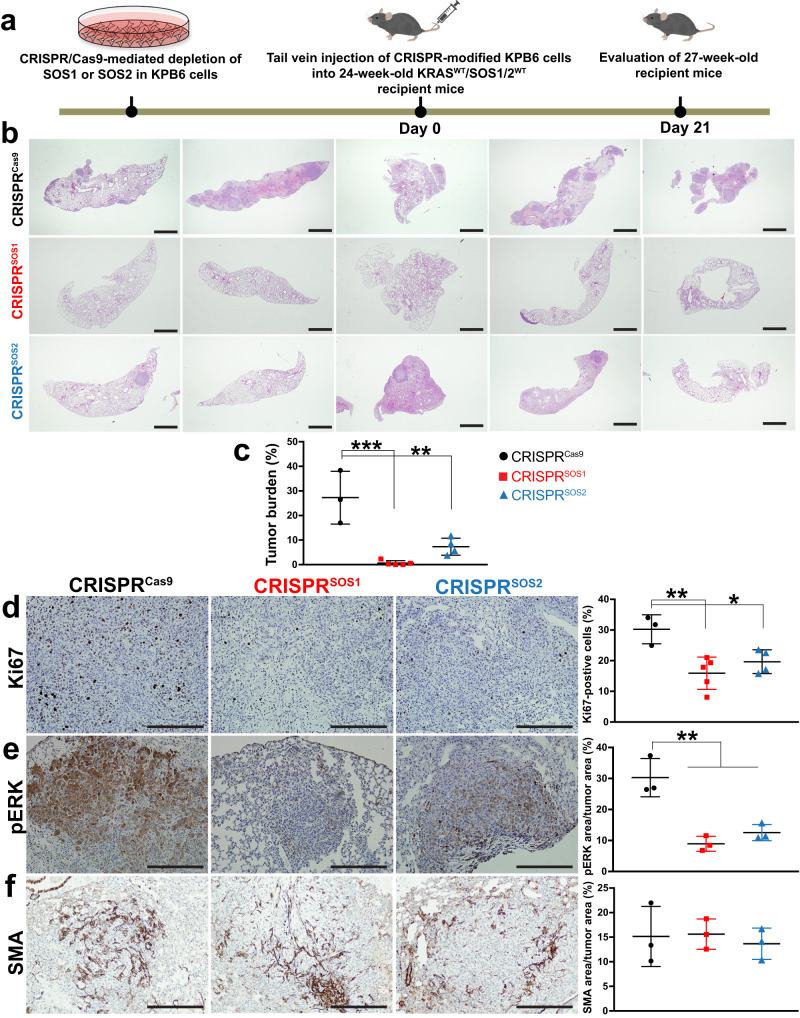
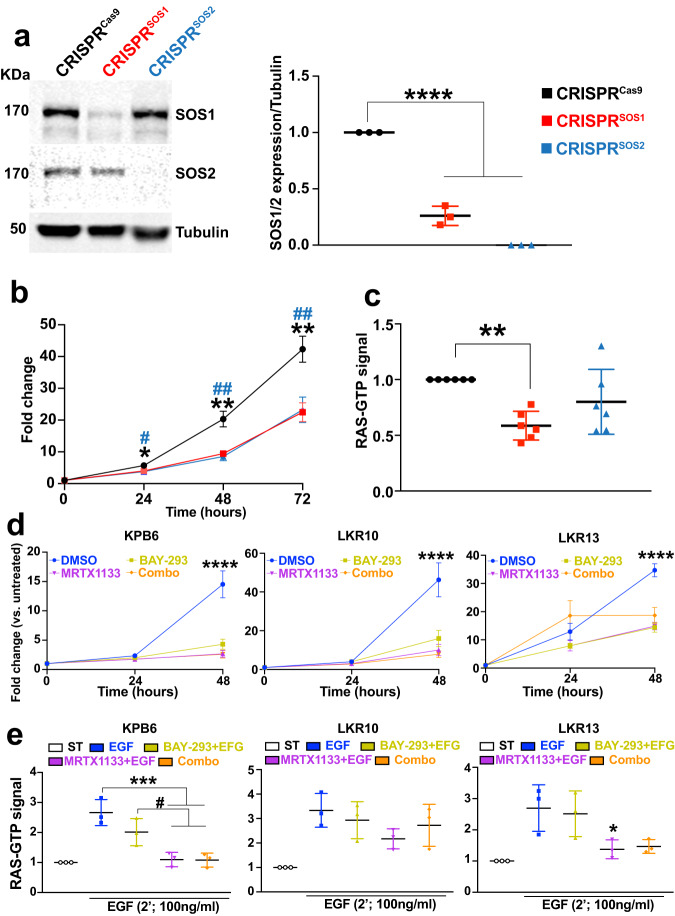
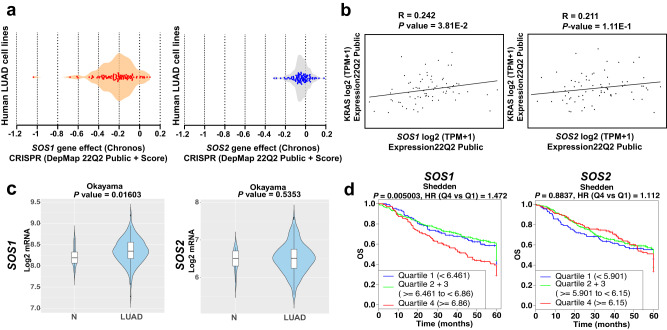
The impact of genetic ablation of SOS1 or SOS2 is evaluated in a murine model of KRASG12D-driven lung adenocarcinoma (LUAD). SOS2 ablation shows some protection during early stages but only SOS1 ablation causes significant, specific long term increase of survival/lifespan of the KRASG12D mice associated to markedly reduced tumor burden and reduced populations of cancer-associated fibroblasts, macrophages and T-lymphocytes in the lung tumor microenvironment (TME). SOS1 ablation also causes specific shrinkage and regression of LUAD tumoral masses and components of the TME in pre-established KRASG12D LUAD tumors. The critical requirement of SOS1 for KRASG12D-driven LUAD is further confirmed by means of intravenous tail injection of KRASG12D tumor cells into SOS1KO/KRASWT mice, or of SOS1-less, KRASG12D tumor cells into wildtype mice. In silico analyses of human lung cancer databases support also the dominant role of SOS1 regarding tumor development and survival in LUAD patients. Our data indicate that SOS1 is critically required for development of KRASG12D-driven LUAD and confirm the validity of this RAS-GEF activator as an actionable therapeutic target in KRAS mutant LUAD.


Conflict of interest statement

The authors declare no competing interests.

Figures

Fig. 1
Fig. 1. SOS1/2 genetic ablation protects from KRASG12D-driven LUAD in mice.
a Schematic illustration of the experimental strategy applied to all different genotypic groups. Animals of the indicated KRAS and SOS1/2 genotypes were equally treated with TMX after 1 month of age and then analyzed during the ensuing months at the timepoints indicated in the following panels. b Kaplan–Meier survival plots for SOS1/2WT (black), SOS1KO (red) and SOS2KO (blue) animals analyzed in our model of RASG12D-driven LUAD. n = 20 (SOS1/2WT), n = 25 (SOS1KO), n = 28 (SOS2KO); *P = 0.0107 vs SOS1/2WT. Log-rank (Mantel-Cox) test. c Percentage of O2 saturation in blood of 12-month-old SOS1/2WT/KRASWT and KRASG12D mice of the SOS1/2 genotypes. n = 4 independent mice per genotype. **P = 0.0097 vs SOS1/2WT/KRASG12D; ##P = 0.0068 vs SOS2KO. Data shown as mean ± SD. One-way ANOVA and Tukey’s test. d Total number of KRASG12D-mutant tumors present on the surface of the lungs of 1, 3, and 5 months-old SOS1/2WT, SOS1KO, or SOS2KO mice. n = 6 independent mice per genotype. Data shown as mean ± SD. At 3 months: **P = 0.0067 vs SOS1KO and **P = 0.0052 vs SOS2KO; at 5 months: **P = 0.0018 vs SOS1KO and *P = 0.0424 vs SOS2KO). One-way ANOVA and Tukey’s test. e Representative lung microCT scan images for each age and genotype. f Progression of LUAD tumor volume in the groups and timepoints indicated. n = 3 independent mice per genotype. Data expressed as mean ± SD. At 1 month: #P = 0.0201 vs SOS1KO and P = 0.0052 vs SOS2KO; at 5 months: *P = 0.0382 vs SOS1KO and #P = 0.0264 vs SOS2KO). One-way ANOVA and Tukey’s test. g Percentage distribution of the histopathological grades exhibited by KRASG12D lung tumors of the indicated genotypes and timepoints. Hyperproliferating Type II Pneumocytes (HPNII, black bars), adenoma (orange bars) or advanced grade adenoma (light blue bars). h, i KRASG12D-driven tumor progression examined in lungs of 1 to 12-month-old KRASG12D-mutant mice of the indicated genotypes. h Representative H&E-stained sections of lungs from animals of the indicated age and genotype. Scale bars, 1 mm. i Kinetics of tumor burden progression from 1-month-old to 12-month-old mice of the indicated genotypes. n = 4 independent mice per genotype and timepoint. Data shown as mean ± SD. At 3 months: *P = 0.0176 vs SOS2KO; ****P < 0.0001 vs SOS1KO and ##P = 0.0019 vs SOS2KO; at 5 months: ***P ≤ 0.001 vs SOS1KO and SOS2KO and ###P = 0.0008 vs SOS2KO; at 7 months: ***P = 0.0002 vs SOS1KO and *P = 0.0164 vs SOS2KO and #P = 0.0195 vs SOS2KO; at 9 months: ***P = 0.0002 vs SOS1KO and *P = 0.0195 vs SOS2KO and #P = 0.0243 vs SOS2KO; at 12 months: **P = 0.0019 vs SOS1KO. One-way ANOVA and Tukey’s test. Source data are provided as a Source data file.
Fig. 2
Fig. 2. SOS1 depletion reduces cell proliferation and ERK phosphorylation rates in KRASG12D lung tumors.
a, b Representative images of paraffin-embedded sections from lungs of 5-month-old, KRASG12D-mutant mice of the indicated SOS genotypes (SOS1/2WT, SOS1KO, and SOS2KO) after immunostaining against Ki67 (a) and pERK (b). The bar charts on the right side quantitate the percentage of Ki67-positive cells relative to total number of cells in the tumors (a) and the percentage of pERK-stained area in the tumor relative to total tumor area (b) in the samples. Scale bars, 100 μm. n = 3 independent mice per genotype in (a) and n = 4 independent mice per genotype in (b). Data expressed as mean ± SD; * vs SOS1/2WT; # vs SOS1KO. In (a) (*P = 0.0117 and #P = 0.0412) and in (b) (***P = 0.0006 and *P = 0.0266). One-way ANOVA and Tukey’s test. c SOS1 and SOS2 expression levels in lung tumors isolated from TMX-treated animals of the relevant SOS genotypes (SOS1/2WT, SOS1KO, SOS2KO). Left: mRNA quantification by means of RT-qPCR analysis using β-2-microglobulin as internal control for normalization. Right: Representative Western blots of SOS1 and SOS2 protein expression using vinculin as internal control for normalization. n = 3 independent samples per genotype. Data shown as mean ± SD. ****P < 0.0001 vs SOS1/2WT. One-way ANOVA and Tukey’s test. d Representative RAS-GTP assays and corresponding quantitative densitometric analyses performed in KRASG12D-lung tumors of 5-month-old, TMX-treated SOS1/2WT and SOS1/2-deficient mice. n = 3 independent samples per genotype. Data shown as mean ± SD. *P = 0.0146 and **P = 0.0044 vs SOS1/2WT. One-way ANOVA and Tukey’s test. Source data are provided as a Source data file.
Fig. 3
Fig. 3. SOS1 depletion modulates the tumor microenvironment in KRASG12D-driven LUAD.
ae Representative images of paraffin-embedded sections from KRASG12D-driven lung tumors extracted from 5-month-old, SOS1/2WT, SOS1KO, and SOS2KO mice after immunolabeling for SMA (a), CD68 (c), CD3 (d), and CD31 (e), or staining with Masson trichrome (b), as indicated. Scale bars: a, d, e 100 μm; b, c 50 μm; d inserts, 50 μm. Bar charts on the right side represent the percentage of total tumor area that was specifically stained for SMA (a), collagen (b), and CD31 (e) or the percentage of total tumor cells that were immunopositive for CD68 (c) in lungs of the indicated genotypes. n = 3 independent mice per genotype. Data shown as mean ± SD. *P < 0.05 vs SOS1/2WT; #P < 0.05 vs SOS1KO. In (a): *P = 0.035 and #P = 0.0146. In (b): *P = 0.0107 and #P = 0.0404. In (c): *P = 0.0488. One-way ANOVA and Tukey’s test. Source data are provided as a Source data file.
Fig. 4
Fig. 4. Impact of SOS1 ablation on preexisting KRASG12D-driven lung tumors.
a Representative microCT scanning image of the lungs of a TMX-untreated 4-month-old SOS1fl/fl/KRASG12D mouse (left) and the lungs of the same animal (right) after two additional months (6-month-old) of TMX treatment. The graph data points corresponding to each individual mouse are identified by a distinctive color in each case. bg Representative images of paraffin-embedded sections from the lungs of 6-month-old mice (SOS1fl/fl/KRASG12D, TMX-untreated, left side) and comparable counterpart lungs samples from 6-month-old mice treated with TMX for a two-months period (starting treatment at 4 months of age) that were stained with H&E (b) or immunostained for Ki67 (c), pERK (d), SMA (e), CD68 (f) and cleaved-caspase 3 CC3 (g) as indicated. Scale bars: b, 1 mm; c, d, g 100 μm; e, f 200 μm. n = 3 independent mice per genotype and experimental condition. The bar charts on the right side depict quantitative comparisons between the images on the left side pictures (green bars: lungs of TMX-untreated mice; red bars: lungs of TMX-treated mice for 2 months) and represent, respectively, the percentage of lung tumor volume (a), the percentage of lung tumor burden (b), the percentage of Ki67-positive cells in the tumor (c), the percentage of total lung tumor area that was immunostained for pERK (d) or for SMA (e), or the percentage of CD68-positive cells (f) and CC3-positive cells per 20X microscopy field (g). n = 3 independent mice per genotype and experimental condition. Data shown as mean ± SD. *P < 0.05 vs SOS1KO; **P < 0.01 vs SOS1KO. Two-tailed paired t-test was used for statistical analysis in panel a (P = 0.0173), whereas two-tailed unpaired t-test was employed to analyze the comparisons in panels (bg) (b: P = 0.0289; c: P = 0.0026; d: P = 0.0132; e: P = 0.0466; f: P = 0.0389). Source data are provided as a Source data file.
Fig. 5
Fig. 5. Nesting and progression of KPB6 lung tumor cells in the lungs of syngeneic mice devoid of SOS1 or SOS2.
a Schematic illustration of the experimental regime and timing of tail vein injection of native KPB6 cells into mice of the indicated genotypes. b Representative images of H&E-stained, paraffin-embedded sections from the 5 different lobes of the lungs of TMX-treated (starting 1 month earlier), 27-week-old, KRASWT, SOS1/2WT, SOS1KO, and SOS2KO. c Bar graph quantifying the total lung tumor burden measured in each of the three experimental groups analyzed. df Representative images of paraffin-embedded sections from the lungs of 27-week-old, KRASWT, SOS1/2WT, SOS1KO, and SOS2KO after immunolabeling for Ki67 (d), pERK (e), and SMA (f). Scale bars: b, 1 mm; df, 100 μm. The bar graphs on the right side depict the percentage of Ki67-positive cells (d) in the lung tumor, as well as the percentage of total tumor area that was positively immunostained for pERK (e) or SMA (f). n = 3 independent experiments per genotype. Data shown as mean ± SD. * vs SOS1/2WT and # vs SOS2KO. In (c): **P = 0.0011 and ##P = 0.0048. In (f): ***P = 0.0003 and ####P < 0.0001. One-way ANOVA and Tukey’s test Source data are provided as a Source data file.
Fig. 6
Fig. 6. Nesting and progression of KPB6 lung tumor cells devoid of SOS1 or SOS2 in the lungs of WT syngeneic mice.
a Schematic illustration of experimental regime and timing of tail vein injection of CRISPR/Cas9-modified KPB6 cells devoid of SOS1 or SOS2 into wild-type KRASWT/SOS1/2WT mice. b Representative images of H&E-stained, paraffin-embedded sections from the 5 different lobes of lungs of 27-week-old, SOS1/2WT/KRASWT mice at 3 weeks after receiving intravenous injection of 1 × 105 CRISPRCas9, CRISPRSOS1 and CRISPRSOS2 KPB6 cells. c Bar graph showing the relative percentage of lung tumor burden in each experimental group. d Representative images of paraffin-embedded sections from lung tumors of 27-week-old wild-type mice SOS1/2WT/KRASWT that were injected with CRISPRCas9, CRISPRSOS1 and CRISPRSOS2 cells, after immunolabeling for Ki67. df The graphs on the right side show the relative percentage Ki67-positive cells (d), pERK levels (e), and SMA-immunopositive CAFs (f) in the tumors detected in each of the indicates genotypes and experimental conditions in the three experimental groups. Data shown as mean ± SD. In (c): ***P = 0.0002 and **P = 0.0026. In (d): **P = 0.0062 and *P = 0.040. In (e): **P = 0.0017 vs SOS1KO and **P = 0.0045 vs SOS2KO. One-way ANOVA and Tukey’s test. c, d n = 3 independent mice for CRISPRCas9, n = 5 independent mice for CRISPRSOS1 groups and n = 4 independent mice for CRISPRSOS2 group. e, f n = 3 independent mice for each genotype. Scale bars: b 1 mm and df 100 μm. Source data are provided as a Source data file.
Fig. 7
Fig. 7. Effects of CRISPR-mediated SOS1 or SOS2 depletion in KPB6 cells.
a Representative WB images of lysates from KPB6 control cells expressing Cas9 (CRISPRCas9) and from derived, SOS1-silenced (CRISPRSOS1) and SOS2-silenced (CRISPRSOS2) cells, immunolabelled for SOS1, SOS2 or tubulin. The bar graph quantitates the relative expression level of SOS1 or SOS2 normalized to that of tubulin in each case. n = 3 independent samples per group. Data shown as mean ± SD. ****P < 0.0001 vs CRISPRSOS1/2-depleted KPB6 cells. One-way ANOVA and Tukey’s test. b Graph displaying growth curve of KPB6 cell cultures at 24, 48, and 72 h upon CRISPR-induced SOS1 or SOS2 ablation. n = 12 independent samples for CRISPRCas9 and n = 8 independent samples for CRISPRSOS1/2 groups. Data shown as mean ± SD. One-way ANOVA and Tukey’s test. At 24 h (*P = 0.00379 vs CRISPRSOS1 and #P = 0.00241 vs CRISPRSOS2); at 48 h (**P = 0.0020 vs CRISPRSOS1 and ##P = 0.0013 vs CRISPRSOS2) and at 72 h (**P = 0.0022 vs CRISPRSOS1 and ##P = 0.0078 vs CRISPRSOS2). c Relative levels of RAS-GTP in cellular extracts from steady-state cultures of KPB6 cells upon CRISPR-mediated SOS1 or SOS2 depletion. n = 6 independent samples per group. Data shown as mean ± SD. **P = 0.0038 vs CRISPRSOS1. One-way ANOVA and Tukey’s test. d Proliferative rates of cultures of the indicated KRASG12D-mutated cell lines upon treatment with DMSO (vehicle), BAY-293, MRTX1133 or combo (BAY-293 + MRTX1133) for the times indicated. n = 5 independent samples per group. Data shown as mean ± SD. ****P < 0.0001 vs drug-treated cells. One-way ANOVA and Tukey’s test. e Relative levels of RAS-GTP in extracts from serum-starved cultures of the indicated cell lines (white boxes) as well as EGF-stimulated cultures of the same cell lines after undergoing pretreatment with solvent vehicle (blue) or the indicated drugs, singly or in combination. n = 3 independent samples per group. Data shown as mean ± SD. *P < 0.05 (P = 0.0498 in LKR13 cells) or ***P < 0.001 (in KPB6 cells, P = 0.0009 and P = 0.0008, for MRTX + EGF or combo-treated groups, respectively) vs vehicle-treated, EGF-stimulated group, and #P < 0.05 (P = 0.0354 and P = 0.0316, for MRTX + EGF or combo-treated groups, respectively) vs BAY293 + EGF group. One-way ANOVA and Tukey’s test. Source data are provided as a Source data file.
Fig. 8
Fig. 8. In silico assessment of the functional relevance of SOS1 for human LUAD.
a hSOS1 and hSOS2 gene dependency score of human LUAD cell lines featured in the CRISPR library of the DepMap portal. b Evaluation of the correlation between hKRAS gene expression level and that of hSOS1 and hSOS2 in human LUAD cell lines gathered in the DepMap portal library. Pearson’s correlation (R) and P values are shown in each graph. c Violin plots comparing hSOS1 and hSOS2 gene between non-tumoral (N; cohort size: 20) and LUAD specimens (cohort size: 226) in the Cancertool Okayama dataset. The Y-axis represents the Log2-normalized gene expression (fluorescence intensity values for microarray data or, sequencing reads values obtained after gene quantification with RSEM and normalization using Upper Quartile in case of RNAseq). The white boxes represent the interquartile range of the data. Minima and maxima in the boxes indicate the first quartile and the third quartile, respectively, whereas the center indicates the median. The whiskers represent the upper and the lower adjacent values. Outside points (traditionally classified as mild and severe outliers) can be also observed. A Student t-test is performed in order to compare the mean gene expression between two groups. d Kaplan–Meier curves showing the overall survival (OS) of patient groups selected in the Cancertool Shedden dataset, according to the quartile expression of the hSOS1 or hSOS2 genes. Quartiles represent ranges of expression that divide the set of values into quarters. Quartile color code: Q1 (Blue), Q2 + Q3 (Green), Q4 (Red). Each curve represents the percentage (Y-axis) of the population that exhibits recurrence of the disease along time (X-axis, in months) for SOS1 or SOS2 expression distribution quartile. Vertical ticks indicate censored patients. Quartile color code: Q1 (blue), Q2 plus Q3 (green), Q4 (red).

Similar articles

Cited by

References

    1. Rocco D, Della Gravara L, Battiloro C, Maione P, Gridelli C. The treatment of advanced lung adenocarcinoma with activating EGFR mutations. Expert Opin. Pharmacother. 2021;22:2475–2482. - PubMed
    1. Nakajima EC, et al. FDA approval summary: sotorasib for KRAS G12C-mutated metastatic NSCLC. Clin. Cancer Res. 2021;28:1482–1486. - PMC - PubMed
    1. Rosen N. Finally, effective inhibitors of mutant KRAS. N. Engl. J. Med. 2021;384:2447–2449. - PubMed
    1. Punekar SR, Velcheti V, Neel BG, Wong KK. The current state of the art and future trends in RAS-targeted cancer therapies. Nat. Rev. Clin. Oncol. 2022;19:637–655. - PMC - PubMed
    1. Awad MM, et al. Acquired resistance to KRAS G12C inhibition in cancer. N. Engl. J. Med. 2021;384:2382–2393. - PMC - PubMed

Publication types