. 2023 Sep 20;14(1):5844.
doi: 10.1038/s41467-023-41495-0.

Chronic cough relief by allosteric modulation of P2X3 without taste disturbance

Affiliations

Chronic cough relief by allosteric modulation of P2X3 without taste disturbance

Chang-Run Guo et al. Nat Commun. .

Abstract

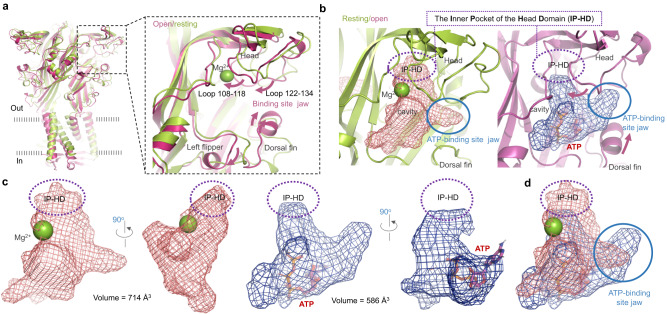
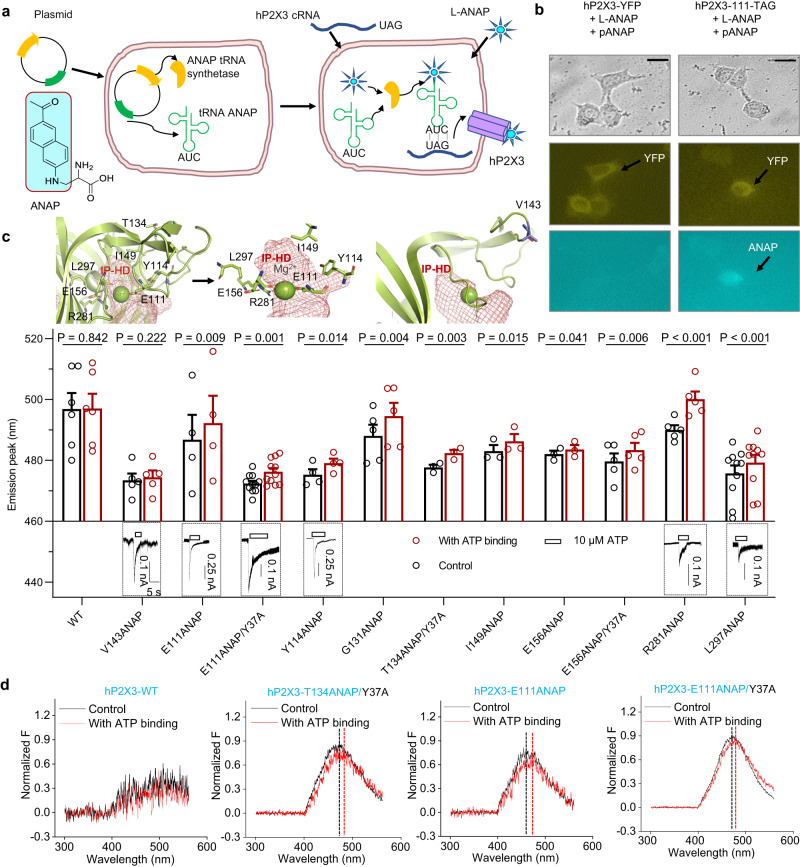
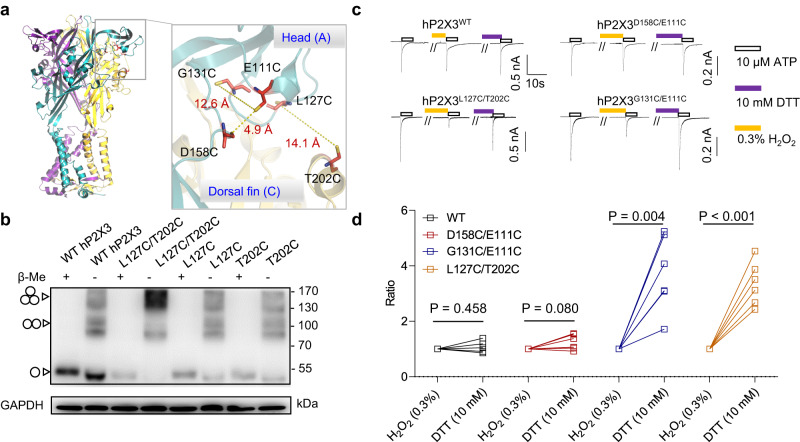
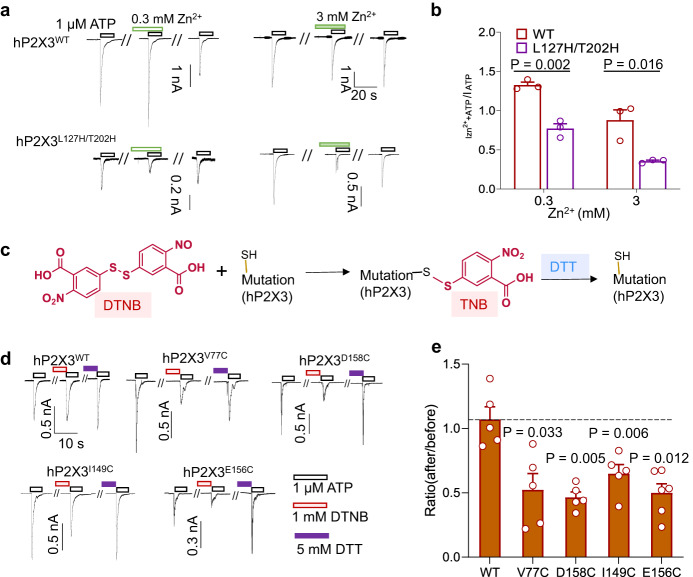
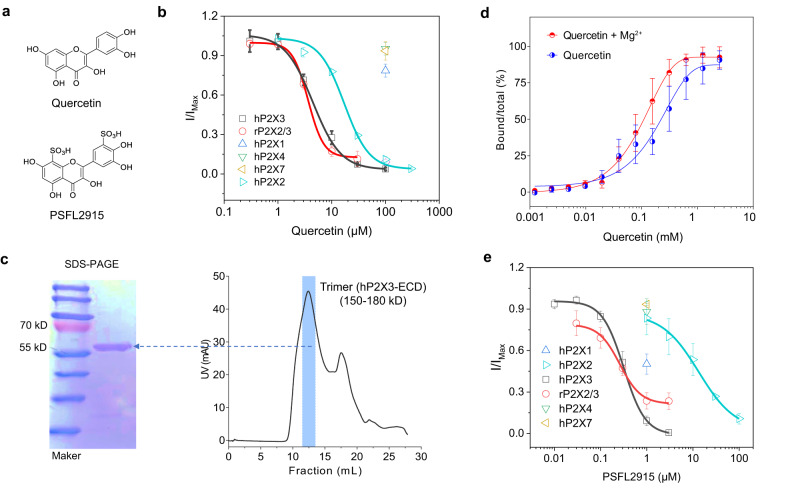
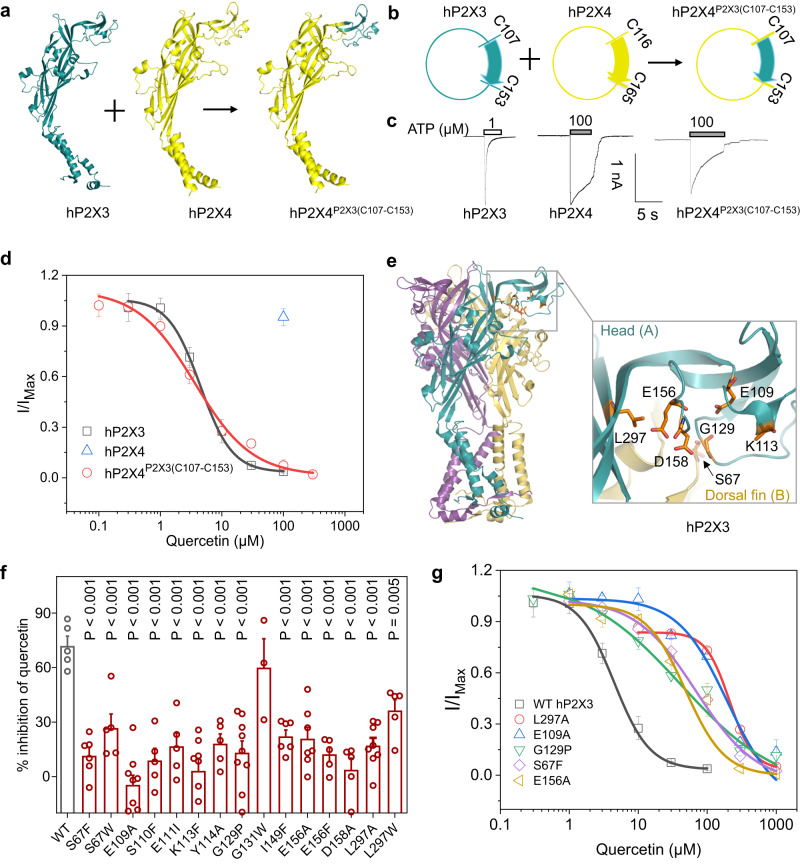
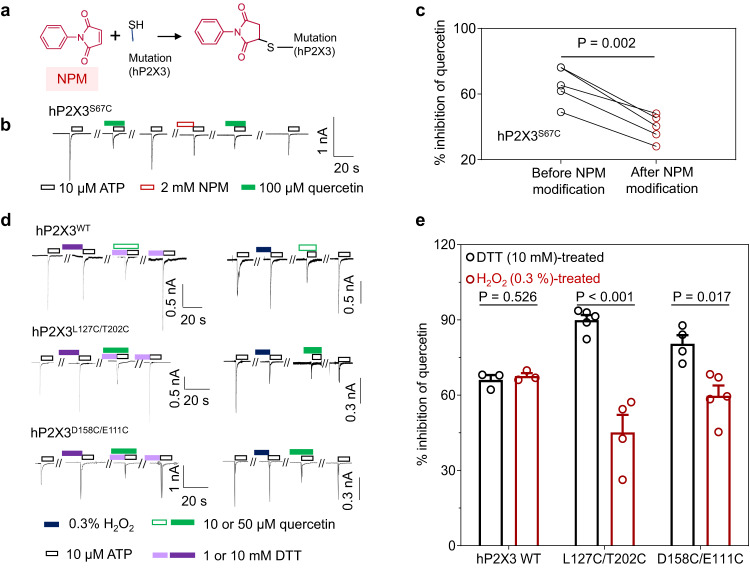
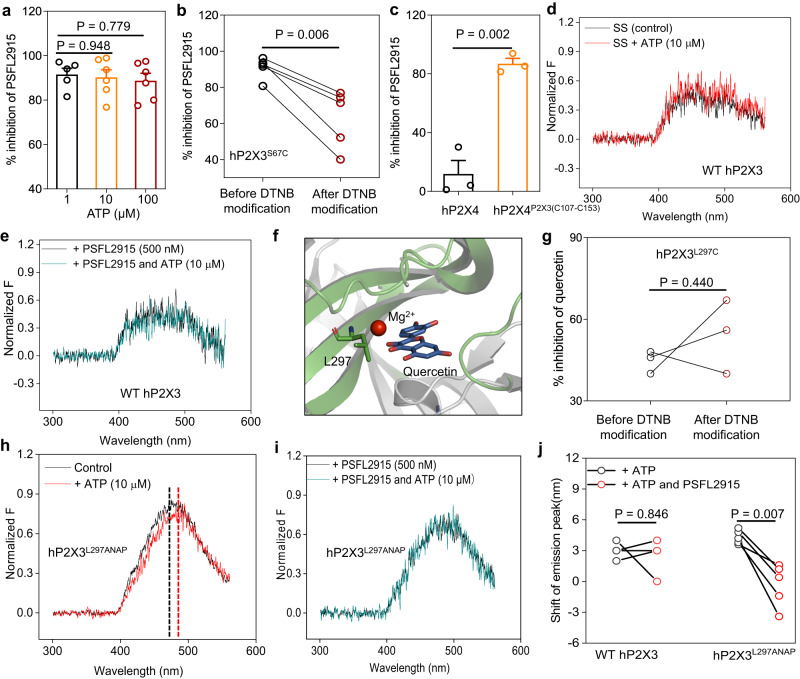
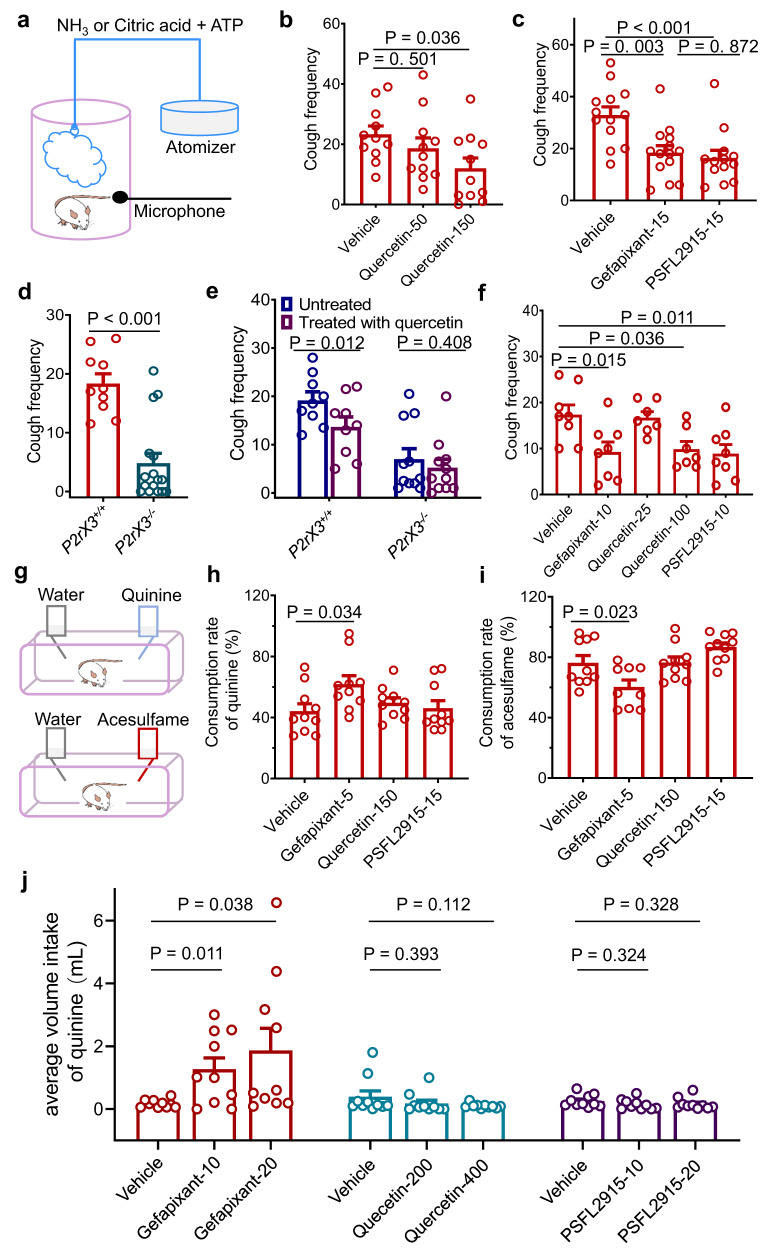
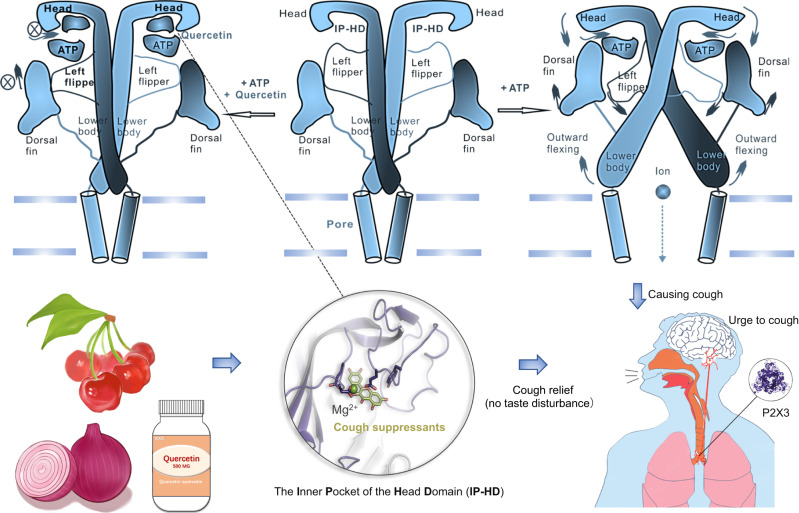
P2X receptors are cation channels that sense extracellular ATP. Many therapeutic candidates targeting P2X receptors have begun clinical trials or acquired approval for the treatment of refractory chronic cough (RCC) and other disorders. However, the present negative allosteric modulation of P2X receptors is primarily limited to the central pocket or the site below the left flipper domain. Here, we uncover a mechanism of allosteric regulation of P2X3 in the inner pocket of the head domain (IP-HD), and show that the antitussive effects of quercetin and PSFL2915 (our nM-affinity P2X3 inhibitor optimized based on quercetin) on male mice and guinea pigs were achieved by preventing allosteric changes of IP-HD in P2X3. While being therapeutically comparable to the newly licensed P2X3 RCC drug gefapixant, quercetin and PSFL2915 do not have an adverse effect on taste as gefapixant does. Thus, allosteric modulation of P2X3 via IP-HD may be a druggable strategy to alleviate RCC.


Conflict of interest statement

The authors declare no competing interests.

Figures

Fig. 1
Fig. 1. Shrinkage of the internal pocket of the head domain (IP-HD) is one of the major conformational changes of human P2X3 (hP2X3) from the resting to open states.
a Side view and zoomed-in view of superimposed structures of the open (light purple, PDB ID: 5SVK) and resting (green, PDB ID: 5SVJ) states of the human P2X3 (hP2X3) receptor. b Side view of the cavity formed by the left flipper (LF), dorsal fin (DF), and head domains in the open (blue) and resting (brick red) states. The IP-HD (purple dashed circles) and ATP-binding site jaw (blue solid circle) are the main changing regions from the resting to the open state. c The volumes of the IP-HD in resting (brick red) and open (blue) states. d Transition from the resting to the open state. The volume of IP-HD (purple dashed circles), but not the ATP-binding site jaw (blue solid circle), shrinks significantly.
Fig. 2
Fig. 2. ATP induces conformational changes in IP-HD as revealed by fluorescent unnatural amino acids (flUAA) incorporation and voltage-clamp fluorometry (VCF).
a Chemical structure of ANAP and strategy for incorporating L-ANAP into the P2X3 receptor. Plasmids containing ANAP tRNA synthetase and the corresponding tRNAs, as well as plasmids carrying the genes encoding the receptor, were transiently transfected into HEK293T cells, and then cultured in ANAP-containing medium for at least 24 h to ensure that ANAP was integrated into the proper location of the receptor. b Representative images of negative control cells (no pANAP vector added) and positive cells (ANAP-integrated P2X3). Fluorescence of yellow fluorescent protein (YFP) was detected only when cells were transfected with both pANAP and P2X3 receptor plasmids. Pseudo-color was used in ANAP and YFP (scale bar, 20 μm). The experiment was repeated thrice with similar results. c Location of selected sites in the IP-HD of P2X3 and the negative control (upper panel), their responses to saturating ATP (lower panel), and a summary of the shift of the peak of ANAP emission wavelengths after ATP administration (middle), Each circle represents an independent cell; n = 3 (T134ANAP/Y37A, I149ANAP, and E156ANAP), 4 (E111ANAP and Y114ANAP), 5 (V143ANAP, G131ANAP, E156ANAP/Y37A, and R281ANAP), 6 (WT), 10 (L297ANAP) or 11 (E111ANAP/Y37A). Data are expressed as mean ± SEM. P value was calculated from a paired, two-tailed t test. d Representative emission spectra of cells that expressed WT P2X3 and some of its ANAP-incorporated mutants (black, bath solution; red, solution containing 10 μM ATP). Source data are provided as a Source Data file.
Fig. 3
Fig. 3. Tightening of IP-HD is essential for ATP-induced P2X3 receptor activation.
a Zoomed-in view of IP-HD. Mutated residues around IP-HD are indicated with sticks for emphasis. b Homo-oligomers of hP2X3 with double mutations L127C (in the head domain of one subunit) and T202C (in the DF domain of a neighboring subunit) showed predominantly as trimers in non-reducing Western blots. Cells transfected with WT P2X3 and the cysteine substitution mutants as indicated were lysed in buffers with and without β-ME (1%, 10 mM). Positions corresponding to the sizes of monomeric, dimeric, and trimeric P2X3 subunits are marked with arrowheads, respectively. The experiment was repeated thrice with similar results. c, d Representative currents (c) and pooled data (d) recorded from cells transfected with D158C/E111C (n = 6), L127C/T202C (n = 6), G131C/E111C (n = 6), and wild-type (WT, n = 5) hP2X3 receptors. Cells were clamped at −60 mV and currents were induced by ATP (10 μM) at 7 min intervals. H2O2 (0.3%) and dithiothreitol (DTT, 10 mM) were used to promote and disrupt the disulfide bond, respectively. Data in  d represent the ratio of ATP-evoked current after to before the DTT treatment. Each line represents an independent cell. One sample two-tailed t test against the value 1. Source data are provided as a Source Data file.
Fig. 4
Fig. 4. Engineered zinc bridges and DTNB covalent occupancy affect the activation of P2X3 receptors.
a, b Representative currents (a) and pooled data (b) recorded from cells transfected with WT hP2X3 receptors and its L127H/T202H mutant. Currents were evoked by 1 μM ATP at 7 min intervals. Zn2+ was applied at 0.3 mM (left) or 3 mM (right) as indicated. Data in b represent the ratio of ATP-evoked currents after to before the Zn2+ treatment. Each circle represents an independent cell, n = 3. P value was calculated from an unpaired, two-tailed t test. (c) Chemical structure of DTNB and its modification of cysteine at the mutation site. d, e Representative currents (d) and pooled data (e) recorded from cells transfected with WT P2X3 (n = 5) and its V77C (n = 5), D158C (n = 5), I149C (n = 5), and E156C (n = 6) mutants. Currents were evoked by 1 μM ATP at 7 min intervals. DTNB (1 mM) and DTT (5 mM) were applied as indicated. Data in e represent the ratio of ATP-evoked currents after to before the DTNB treatment. Each circle represents an independent cell. One sample t test against value 1, paired two-tailed t test. All summary data are expressed as mean ± SEM. Source data are provided as a Source Data file.
Fig. 5
Fig. 5. Quercetin and its derivative PSFL2915 selectively inhibit P2X3.
a Chemical structures of quercetin and PSFL2915. b Concentration-response curves of homomeric P2X2 and P2X3, and heteromeric P2X2/3 receptors to quercetin. Currents were evoked by 10 µM ATP for homomeric P2X2, and 1 µM ATP for homomeric P2X3 and heteromeric P2X2/3. Data were normalized to that in the absence of quercetin. Each solid line is a fit of the Hill 1 equation. n = 3 (0.3, 1, 30, and 100 μM) or 4 (3 and 10 μM) independent cells for hP2X3; n = 3 (1, 10, 30 and 300 μM), 4 (3 μM) or 7 (100 μM) independent cells for hP2X2; n = 3 (0.3, 1, and 10 μM) or 4 (3 and 30 μM) independent cells for rP2X2/3. In addition, ATP-evoked currents of P2X1 (n = 6), P2X4 (n = 6), and P2X7 (n = 3 independent cells) were tested in the presence of 100 µM quercetin. c Size-exclusion chromatography of the trimer of the extracellular domain of hP2X3 (hP2X3-ECD) using a GL column (right), which was then collected for SDS-PAGE (left). The experiment was repeated thrice with similar results. d Binding of quercetin to hP2X3-ECD was measured by microscale thermophoresis (MST) in standard treated capillaries with and without Mg2+ (n = 3). e Concentration-response curves of P2X2 and P2X3 homomeric receptors and P2X2/3 heteromeric receptors to PSFL2915. n = 3 (0.01, 0.1, and 3 μM), 4 (0.3 and 1 μM) or 5 (0.03 μM) independent cells for hP2X3; n = 3 (1, 30 and 100 μM) or 4 (3 and 10 μM) independent cells for hP2X2; n = 3 (1 μM), 4 (0.03 and 3 μM), 5 (0.3 μM) or 6 (0.1 μM) independent cells for rP2X2/3. Similar to b, but PSFL2915 was used. hP2X1 (n = 4), hP2X4 (n = 3) and hP2X7 (n = 3 independent cells) were tested with 1 µM PSFL2915. Each solid line is a fit of the Hill 1 equation. All summary data are expressed as mean ± SEM. Source data are provided as a Source Data file.
Fig. 6
Fig. 6. Quercetin inhibits the activation of hP2X3 via acting at IP-HD.
a, b Swapping the IP-HD of hP2X3 to hP2X4 allows hP2X4 to acquire inhibition by quercetin. C116-C165 of hP2X4 was replaced by the corresponding C107-C153 fragment of hP2X3 to produce the chimera hP2X4P2X3 (C107-C153). c Representative currents evoked by 1 µM ATP for hP2X3, and 100 µM ATP for hP2X4 and hP2X4P2X3(C107-C153). d Concentration-response curves to quercetin of hP2X3 and hP2X4P2X3(C107-C153). hP2X4 was tested at 100 µM quercetin, each solid line was a fit of the Hill 1 equation. n = 3 (0.3, 1, 30 and 100 μM) or 4 (3 and 10 μM) independent cells for hP2X3; n = 6 independent cells for hP2X4; n = 3 (0.1, 100, and 300 μM), 5 (0.3 μM) or 7 (1, 3, 10, and 30 μM) independent cells for hP2X4P2X3 (C107-C153). e Zoomed-in view of the IP-HD of hP2X3. Residues around this pocket are indicated with sticks for emphasis. f Effect of quercetin (10 μM) on ATP (1 μM)-induced activation of hP2X3-WT and the indicated mutants. Each circle represents an independent cell; n = 3 for G131W; n = 5 for WT, S67W, S110F, E111I, Y114A, E156F, D158A, and L297W; n = 6 for S67F and I149F; n = 7 for E156A; n = 8 for K113F and L297A; n = 9 for E109A and G129P. P value was compared to WT, one-way ANOVA followed by Dunnett’s multiple comparisons test, F (15, 80) = 8.733. g Concentration-response curves to quercetin of WT hP2X3 and several of its mutants (solid lines were fits of the Hill 1 equation). n = 3 (0.3, 1, 30 and 100 μM) or 4 (3 and 10 μM) independent cells for WT; n = 3 (1, 3, 10, 100, 300, and 1000 μM) or 4 (30 μM) independent cells for S67F; n = 3 (3, 10, 30, and 100μM) or 4 (1, 300, and 1000 μM) independent cells for E109A; n = 3 (0.3, 30, and 1000 μM), 4 (1 and 300 μM), 5 (3 μM) or 6 (10 and 100 μM) independent cells for G129P; n = 3 (1000 μM), 4 (3, 100, and 300 μM), 5 (10 and 30 μM) or 6 (1 μM) independent cells for E156A; n = 3 (30, 300, and 1000 μM), 4 (10 μM) or 5 (100 μM) independent cells for L297A. All summary data are expressed as mean ± SEM. Source data are provided as a Source Data file.
Fig. 7
Fig. 7. NPM covalent occupancy and disulfide crosslinking affect the inhibitory effect of quercetin on hP2X3.
a Chemical structure of NPM and its modification of cysteine at the mutation site. b Representative currents recorded from cells transfected with P2X3S67C receptors. Cells were voltage-clamped at −60 mV and currents were evoked by ATP (10 μM) at 7 min intervals. NPM (2 mM) and quercetin (100 μM) were applied as indicated. c Pooled data for experiments in b. The inhibition rates of quercetin before and after the NPM treatments for individual cells are connected with lines. Each line represents an independent cell, n = 5. P value was calculated from a paired, two-tailed t test. d Representative currents recorded from cells transfected with WT hP2X3 and its double cysteine mutants, D158C/E111C and L127C/T202C. ATP, H2O2, DTT, and quercetin were applied as indicated. e Pooled data for experiments in d. Each circle represents an independent cell, n = 3 for WT hP2X3, n = 5 for L127C/T202C (DTT treated), n = 4 for L127C/T202C (H2O2 treated), n = 4 for D158C/E111C (DTT treated), n = 5 for D158C/E111C (H2O2 treated). P value was calculated from an unpaired, two-tailed t test. All summary data are presented as mean ± SEM. Source data are provided as a Source Data file.
Fig. 8
Fig. 8. PSFL2915 blocks the conformational changes of IP-HD in P2X3 induced by ATP binding.
a Effect of PSFL2915 (1 μM) on ATP (1, 10, 100 μM)-induced activation of WT hP2X3. Each circle represents an independent cell. n = 5 (1 μM) or 6 (10 and 100 μM); one-way ANOVA and Dunnett’s multiple comparison test, F (2, 14) = 0.8142. Data are expressed as mean ± SEM. b DTNB (2 mM) modification reduced the inhibition of hP2X3S67C by PSFL2915 (1 μM). Each line represents an independent cell, n = 5. P value was calculated from a paired, two-tailed t test. c Effect of PSFL2915 (1 μM) on ATP (100 μM) induced activation of hP2X4 and hP2X4P2X3 (C107-C153). Each circle represents an independent cell; n = 3. P value was calculated from an unpaired, two-tailed t test. Data are expressed as mean ± SEM. d, e Representative emission spectra in the absence and presence of ATP (10 µM) for WT hP2X3. f Zoomed-in view of the location of L297 and bound quercetin. g DTNB (2 mM) modification did not reduce the inhibition rate of hP2X3L297C by quercetin (10 μM). Each line represents an independent cell, n = 3; paired two-tailed t test. h, i Representative emission spectra in the absence and presence of ATP (10 µM) for the ATP-induced shift of the peak emission wavelengths for hP2X3L297ANAP. d, e, h, i PSFL2915 (500 nM) was applied as indicated. Black, control; red, emission spectrum in the presence of 10 μM ATP; dark cyan, emission spectra in the presence of 10 μM ATP and 500 nM PSFL2915. j Pooled data for experiments in d, e, h, i. Each line represents an independent cell; n = 5. P value was calculated from a paired, two-tailed t test. Source data are provided as a Source Data file.
Fig. 9
Fig. 9. Quercetin and PSFL2915 reduce cough in C57BL/6 mice and guinea pigs without taste impairments.
a Schematic diagram of the experimental setup. b Cough frequency in mice administered with vehicle (0.5% CMC-Na) or quercetin (50 or 150 mg/kg, b.i.d.). Coughing was induced by NH3. n = 11, One-way ANOVA and Dunnett’s multiple comparison tests, F (2, 30) = 3.070. c Cough frequency in mice administered vehicle (n = 13), gefapixant (15 mg/kg, b.i.d., n = 14), or PSFL2915 (15 mg/kg, b.i.d., n = 13). Coughing was induced by NH3 (0.1%). One-way ANOVA followed by Tukey’s multiple comparisons test, F (2, 37) = 9.467. d Cough frequency of P2rX3+/+ (n = 10) and P2rX3−/− (n = 16) mice that received NH3, unpaired two-tailed t test. e Cough frequency P2rX3+/+ (n = 9) and P2rX3−/− (n = 11) mice untreated or treated with quercetin (150 mg/kg, b.i.d.) before the exposure to NH3. Paired two-tailed t test. f Cough frequency in guinea pigs treated with vehicle (n = 8), gefapixant (10 mg/kg, b.i.d., n = 8), PSFL2915 (10 mg/kg, b.i.d., n = 8), or quercetin (25 or 100 mg/kg, b.i.d., n = 7). Coughing was induced by citric acid and ATP. One-way ANOVA followed by Dunnett’s multiple comparisons test, F (4, 33) = 4.918. g Schematic diagram of the two-bottle preference test setup. h, i Two-bottle preference tests of mice. Compared to vehicle control mice (n = 10), gefapixant (5 mg/kg, b.i.d.) treated mice drank more bitter quinine (n = 10) and less sweetener acesulfame (n = 9), whereas PSFL2915 (15 mg/kg, b.i.d., n = 10) or quercetin (150 mg/kg, b.i.d., n = 10) treatment resulted neither increased quinine intake nor decreased acesulfame intake. One-way ANOVA followed by Dunnett’s multiple comparisons test, F (3, 36) = 2.762 (h) and F (3, 35) = 7.141 (i). j Two-bottle preference tests in rats. Rats treated with gefapixant (10 and 20 mg/kg) drank more quinine solution compared to vehicle controls, whereas PSFL2915 (10 and 20 mg/kg) or quercetin (200 and 400 mg/kg) treatments did not result in increased quinine intake. Paired two-tailed t test; n = 10. All summary data are expressed as mean ± SEM, and each circle represents an independent animal. Source data are provided as a Source Data file.
Fig. 10
Fig. 10. Conformational changes of IP-HD during P2X3 receptor channel gating, and schematic diagram of the mechanism of inhibition by quercetin and PSFL2915.
Tightening of IP-HD is essential for P2X3 receptor activation, and quercetin from natural products inhibits P2X3 receptor activation by blocking the tightening of IP-HD. This likely underlies the main mechanism of quercetin and PSFL2915 in cough relief.

Similar articles

Cited by

References

    1. Kennedy C. That was then, this is now: the development of our knowledge and understanding of P2 receptor subtypes. Purinergic Signal. 2021;17:9–23. doi: 10.1007/s11302-021-09763-0. - DOI - PMC - PubMed
    1. Illes P, et al. Update of P2X receptor properties and their pharmacology: IUPHAR Review 30. Br. J. Pharmacol. 2021;178:489–514. doi: 10.1111/bph.15299. - DOI - PMC - PubMed
    1. Kim JY, et al. AZD-9056, a P2X7 receptor inhibitor, suppresses ATP-induced melanogenesis. J. Dermatol. Sci. 2020;100:227–229. doi: 10.1016/j.jdermsci.2020.09.008. - DOI - PubMed
    1. Ali Z, et al. Pharmacokinetic and pharmacodynamic profiling of a P2X7 receptor allosteric modulator GSK1482160 in healthy human subjects. Br. J. Clin. Pharmacol. 2013;75:197–207. doi: 10.1111/j.1365-2125.2012.04320.x. - DOI - PMC - PubMed
    1. Cui W, et al. P2X3-selective mechanism of Gefapixant, a drug candidate for the treatment of refractory chronic cough. Comput. Struct. Biotecnol. J. 2022;20:1642–1653. doi: 10.1016/j.csbj.2022.03.030. - DOI - PMC - PubMed

Publication types