. 2023 Sep 20;14(1):5848.
doi: 10.1038/s41467-023-41337-z.

NET4 and RabG3 link actin to the tonoplast and facilitate cytoskeletal remodelling during stomatal immunity

Affiliations

NET4 and RabG3 link actin to the tonoplast and facilitate cytoskeletal remodelling during stomatal immunity

Timothy J Hawkins et al. Nat Commun. .

Abstract

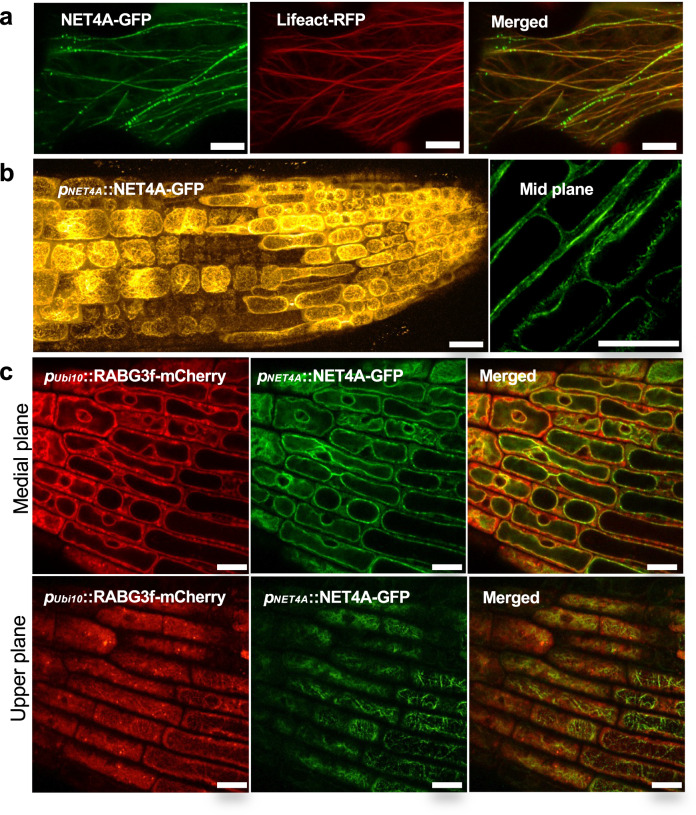
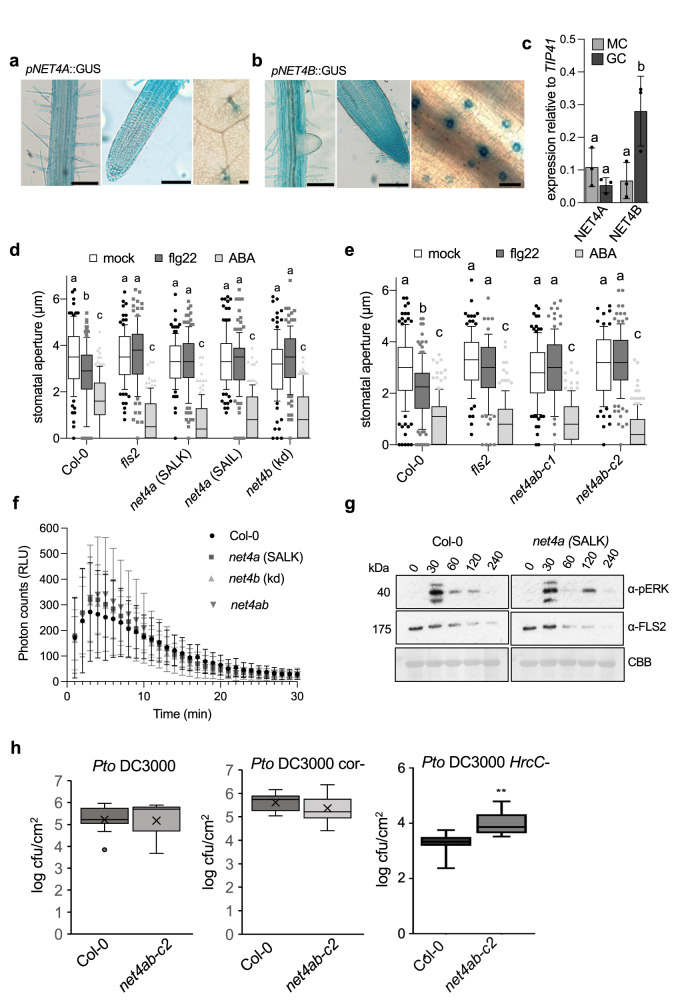
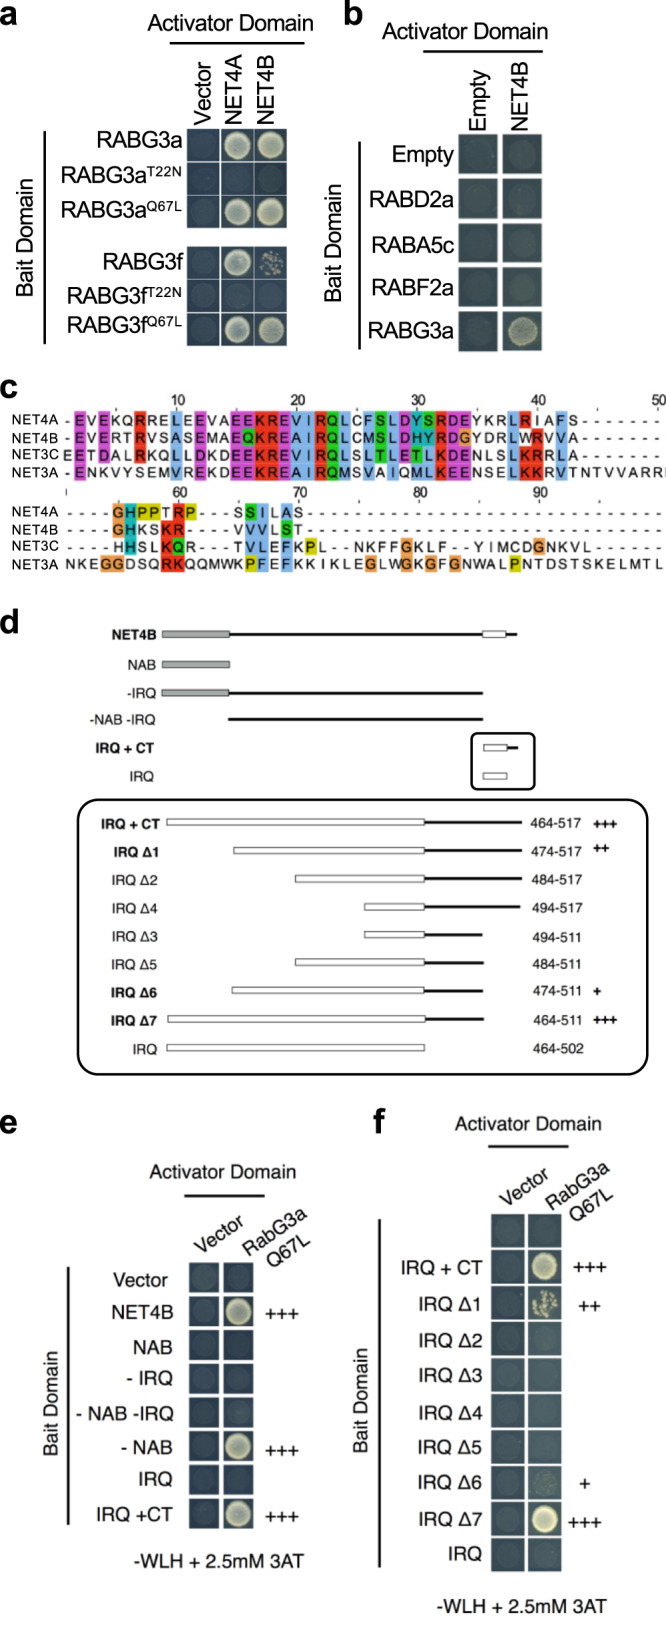
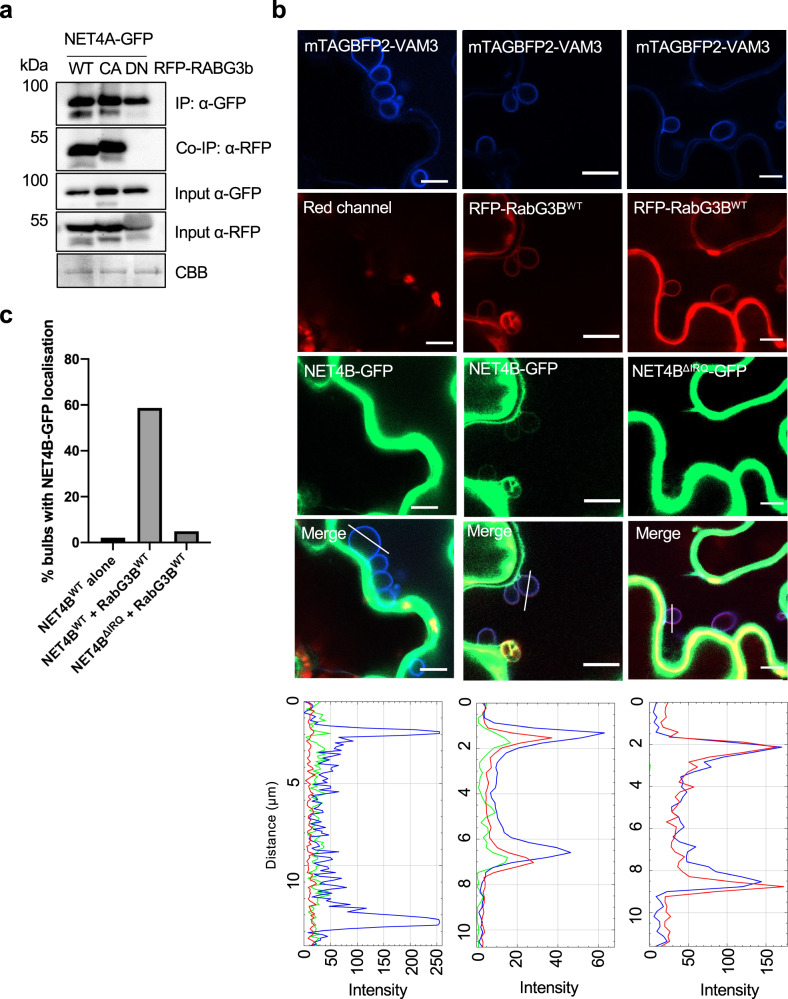
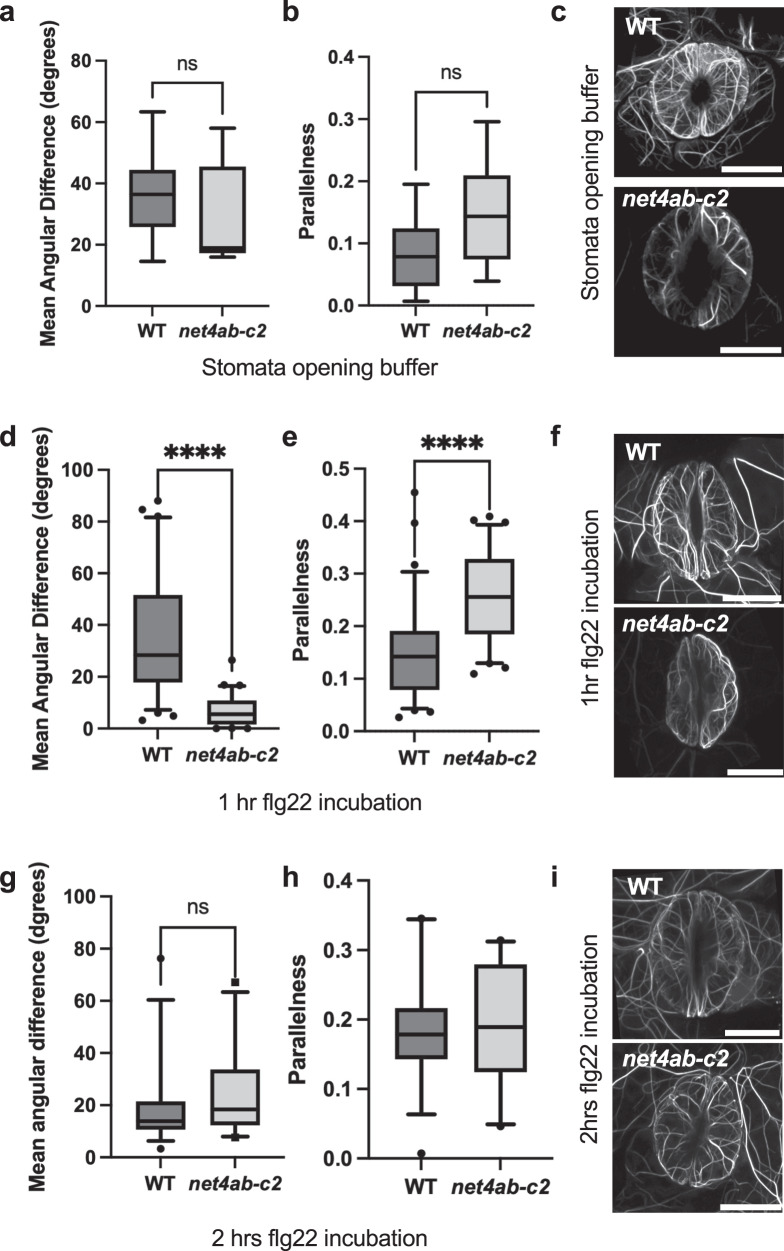
Members of the NETWORKED (NET) family are involved in actin-membrane interactions. Here we show that two members of the NET family, NET4A and NET4B, are essential for normal guard cell actin reorganization, which is a process critical for stomatal closure in plant immunity. NET4 proteins interact with F-actin and with members of the Rab7 GTPase RABG3 family through two distinct domains, allowing for simultaneous localization to actin filaments and the tonoplast. NET4 proteins interact with GTP-bound, active RABG3 members, suggesting their function being downstream effectors. We also show that RABG3b is critical for stomatal closure induced by microbial patterns. Taken together, we conclude that the actin cytoskeletal remodelling during stomatal closure involves a molecular link between actin filaments and the tonoplast, which is mediated by the NET4-RABG3b interaction. We propose that stomatal closure to microbial patterns involves the coordinated action of immune-triggered osmotic changes and actin cytoskeletal remodelling likely driving compact vacuolar morphologies.


Conflict of interest statement

The authors have no competing interests.

Figures

Fig. 1
Fig. 1. NET4 proteins decorate actin filaments and localise to the tonoplast.
a Confocal microscopy of N. benthamiana leaves transiently expressing NET4A-GFP and Lifeact-RFP; scale bars = 10 μm. b Confocal microscopy of transgenic Arabidopsis lines expressing NET4A-GFP under its native promoter. NET4A-GFP localises to filaments and the tonoplast membrane; scale bars = 20 μm. c Confocal microscopy of transgenic Arabidopsis lines co-expressing pNET4A::NET4A-GFP and pUbi10::mCherry-RABG3f. NET4A-GFP and mCherry-RABG3f co-localise at the tonoplast in planta; scale bars = 10 μm. All experiments were repeated at least thrice with similar results.
Fig. 2
Fig. 2. NET4 proteins co-localize, interact with each other and themselves.
a Confocal micrographs of N. benthamiana leaf epidermal cells transiently co-expressing NET4A-GFP and NET4B-RFP. Shown are single plane confocal images capturing GFP fluorescence (green), RFP fluorescence (red) and overlaid signals (yellow); scale bars = 20 μm. The experiment was repeated at least thrice with similar results. b Yeast-two-hybrid analysis of the indicated constructs indicate homo- and heterodimer interactions of NET4A and NET4B (EV = empty vector). The experiment was repeated at least thrice with similar results. c Co-immunoprecipitation (Co-IP) assay of NET4A-GFP with NET4B-RFP. Fusion proteins were co-expressed in N. benthamiana, immunoprecipitated (IP) using GFP-trap beads and detected using fluorophore fusion specific antibodies (GFP and RFP). 1% of the input is shown as loading control. Blots are representative of two independent experiments. d FRET-FLIM analysis of NET4A-GFP and NET4B-RFP interaction. FLIM (TCSPC) confocal images of N. benthamiana leaf epidermal cells co-expressing both NET4 proteins. Data shown using lifetime LUT. e Graph of fluorescence lifetime values of donor alone and donor + acceptor. The significant reduction in lifetime of the donor in the presence of the acceptor indicates energy transfer and a physical interaction; n = 10, p < 0.0001 Mann Whitney t-test; errors bars represent SD. The experiment was repeated at least twice with similar results.
Fig. 3
Fig. 3. net4 mutants are impaired in flg22- but not ABA-induced stomatal closure and other PTI responses.
a, b GUS-stained tissues of stable transgenic Arabidopsis NET4A and NET4B promoter-driven GUS reporter line seedlings. Scale bars (a) = 100 µm (right), 100 µm (middle), 50 µm (left); scale bars (b) = 100 µm (right), 100 µm (middle), 20 µm (left). The experiments were repeated at least thrice with similar results. c Transcript levels of NET4A and NET4B were quantified in guard cells (GC)-enriched samples or whole cell samples (MC), respectively, relative to TIP41. Bars represent mean values ± SEM of 3 replicates (ANOVA with Bonferroni’s Multiple Comparison Test). Different letters indicate significantly different values at p < 0.05. The experiment was repeated twice with similar results. d, e Stomatal aperture measurements in net4a and net4b single and net4ab-c1 and -c2 CRISPR-Cas double mutants compared with Col-0 and fls2. Stomatal apertures measured 2 h after treatment with 20 µM flg22 and 10 µM ABA. Box plots of the values are shown with whiskers from the 5th to 95th percentiles, the line in the box shows the median (d: Col-0 (mock) n = 93 stomata, Col-0 (flg22) n = 115, Col-0 (ABA) n = 114, fls2 (mock) n = 100, fls2 (flg22) n = 102, fls2 (ABA) n = 112, net4a SALK (mock) n = 118, net4a SALK (flg22) n = 128, net4a SALK (ABA) n = 125, net4a SAIL (mock) n = 115, net4a SAIL (flg22) n = 126, net4a SAIL (ABA) n = 124, net4b kd (mock) n = 105, net4b kd (flg22) n = 107, net4b kd (ABA) n = 120; e: Col-0 (mock) n = 131 stomata, Col-0 (flg22) n = 124, Col-0 (ABA) n = 123, fls2 (mock) n = 123, fls2 (flg22) n = 92, fls2 (ABA) n = 128, net4ab-c1 (mock) n = 113, net4ab-c1 (flg22) n = 115, net4ab-c1 (ABA) n = 110, net4ab-c2 (mock) n = 83, net4ab-c2 (flg22) n = 124, net4ab-c2 (ABA) n = 133 stomata. Different letters indicate significantly different values at p < 0.0001 (2-way ANOVA, multiple comparisons). Both experiments were repeated twice with similar results. f ROS production measured as relative luminescence units (RLU) in the indicated genotypes treated with 100 nM flg22 over time. Graph represents ±SEM; n = 12 leaf discs. Experiment is representative for two independent experiments with similar results. g Flg22-induced activation of MAPK in the indicated genotypes and time points. MAPK activation is revealed with anti-pERK antibodies. For control, FLS2 abundance and Coomassie brilliant blue (CBB) staining is shown. The experiment was repeated twice with similar results. h Infection analysis of the net4ab-c2 crispr double mutants compared with wild type Col-0. Plants were surface inoculated with P. syringae pv. tomato (Pto) DC3000 wild type bacteria (OD600 = 0.02), a strain defective in coronatine production (cor-) (OD600 = 0.2), and a strain defective in Type-3-secretion of effectors (Hrc-) (OD600 = 0.2). In planta bacterial growth was determined as colony forming units (cfu) at 3 dpi. Bar graphs represent mean values ± SEM of n = 8; p ≤ 0.01 (**). Experiments are representative for at least two independent experiments with similar results.
Fig. 4
Fig. 4. NET4 proteins interact with RabG3 GTPases in an activation- and motif-dependent manner.
a Yeast-two-hybrid analysis of NET4A and NET4B indicate interactions with constitutive active (CA = Q67L) but not dominant-negative (DN = T22N) RABG3 members. b Yeast-two-hybrid analysis of NET4A and NET4B shows no interactions with members of other Rab GTPase families than RABG3. c Sequence alignment of IRQ domains including the C-terminus (CT). Of all NET family members, IRQ domains are only found in NET4A, NET4B, NET3A and NET3C. d Overview of truncated NET4B proteins used to identify the minimal interaction domain required for interaction with RABG3 proteins. e, f Yeast-two-hybrid analysis of the indicated truncated NET4B proteins with constitutive active (CA = Q67L) RABG3a; NAB = NET actin binding domain; IRQ = conserved sequence motif; CT = C-terminus. All experiments were repeated at least twice with similar results.
Fig. 5
Fig. 5. rabg3b mutants are impaired in robust flg22-induced stomatal closure.
a Transcript levels of RABG3 family members were quantified in guard cells (GC)-enriched samples or mesophyll cells (MC), respectively, relative to TIP41. Bars represent mean values ± SEM of 3 biological replicates (ANOVA with Bonferroni’s Multiple Comparison Test). b Stomatal aperture measurements in rabg3 and rabg2 mutants, Col-0 and fls2. Apertures measured 2 h after treatment with 20 µM flg22 or 10 µM ABA. Box plots of the values are shown with whiskers from the 5th to 95th percentiles, the line in the box shows the median (Col-0 (mock) n = 76 stomata, Col-0 (flg22) n = 86, Col-0 (ABA) n = 105, fls2 (mock) n = 82, fls2 (flg22) n = 69, fls2 (ABA) n = 105, rabg3a (mock) n = 91, rabg3a (flg22) n = 104, rabg3a (ABA) n = 117, rabg3b (mock) n = 79, rabg3b (flg22) n = 101, rabg3b (ABA) n = 99, rabg3c (mock) n = 77, rabg3c (flg22) n = 91, rabg3c (ABA) n = 99, rabg3d (mock) n = 91, rabg3d (flg22) n = 84, rabg3d (ABA) n = 99, rabg3e (mock) n = 91, rabg3e (flg22) n = 80, rabg3e (ABA) n = 99, rabg3f (mock) n = 91, rabg3f (flg22) n = 83, rabg3f (ABA) n = 99, rab2g (mock) n = 105, rab2g (flg22) n = 105, rab2g (ABA) n = 99 stomata). Different letters indicate significantly different values at p < 0.0001 (2-way ANOVA, multiple comparisons). The experiment was repeated twice with similar results. c, d Stomatal apertures measured in the indicated genotypes 1 and 2 h after treatment with 20 µM flg22. Box plots of the values are shown with whiskers from the 5th to 95th percentiles, the line in the box shows the median (c: Col-0 (mock) n = 106 stomata, Col-0 (flg22 1 h) n = 110, Col-0 (flg22 2 h) n = 114, fls2 (mock) n = 78, fls2 (flg22 1 h) n = 92, fls2 (flg22 2 h) n = 86, rabg3b (mock) n = 100, rabg3b (flg22 1 h) n = 112, rabg3b (flg22 2 h) n = 116 stomata); (d: Col-0 (mock) n = 100 stomata, Col-0 (flg22 1 h) n = 116, Col-0 (flg22 2 h) n = 91, fls2 (mock) n = 100, fls2 (flg22 1 h) n = 110, fls2 (flg22 2 h) n = 104, net4a SALK (mock) n = 122, net4a SALK (flg22 1 h) n = 125, net4a SALK (flg22 2 h) n = 125, net4a SAIL (mock) n = 99, net4a SAIL (flg22 1 h) n = 102, net4a SAIL (flg22 2 h) n = 125, net4b kd (mock) n = 113, net4b kd (flg22 1 h) n = 99, net4b kd (flg22 2 h) n = 110 stomata). Different letters indicate significantly different values at p < 0.0001 (2-way ANOVA, multiple comparisons). The experiment was repeated twice with similar results. e ROS production measured as relative luminescence units (RLU) in the indicated genotypes treated with 100 nM flg22 over time. Graph represents ±SEM; n = 3 leaf discs. The experiment was repeated twice with similar results f Flg22-induced activation of MAPK in the indicated genotypes and time points. MAPK activation is revealed with anti-pERK antibodies. For loading control, COXII abundance is shown. The experiment was repeated twice with similar results.
Fig. 6
Fig. 6. The RabGTPase activation status and the NET4 IRQ domain are determinants of the NET4-RabG3b association and localization.
a Co-immunoprecipitation (Co-IP) assay of NET4A-GFP with wild type (WT), constitutive active (CA) and dominant-negative (DN) RFP-RABG3b. 1% of the input is shown as loading control. The experiment was repeated at least twice with similar results. b Confocal microscopy of N. benthamiana leaves transiently expressing RFP-RABG3b, NET4B-GFP or NET4BΔIRQ-GFP and the tonoplast marker mTAGBFP2-VAM3; scale bar = 10 μm. Images of the blue, red and green channels as well as merged channels are shown. Bulb-like mTAGBFP2-VAM3-positive tonoplast invaginations were observed in some transformed cells. Transections across mTAGBFP2-VAM3-positive tonoplast invaginations used for fluorescence intensity measurements are indicated by white lines. The histograms show mTAGBFP2-VAM3, RFP-RABG3b and NET4B-GFP or NET4BΔIRQ-GFP fluorescent intensities depicted by blue, red, and green lines, respectively. At least 30 tonoplast invaginations from at least 10 cells were imaged per series. The experiment was repeated twice independently with similar results, from across which representative images have been used. c Quantification of mTAGBFP2-VAM3-positive tonoplast invaginations with NET4B-GFP localisation. In the absence of RFP-RabG3b, NET4B-GFP signal was observed at 2% of tonoplast invaginations. When co-expressed with RFP-RabG3b, NET4B-GFP signal was observed at 58.7% of tonoplast invaginations. NET4BΔIRQ-GFP was observed at 4.9% of tonoplast invaginations when co-expressed with RFP-RabG3b.
Fig. 7
Fig. 7. Guard cell actin dynamics are altered in net4 mutants.
a, b, d, e, g, h Quantification of actin cytoskeletal patterns of Lifeact-mNeonGreen-expressing Col-0 WT and net4ab-c2 plants in guard cells. ImageJ analysis using the LPIXEL Inc LPX plugin set. a, b Mean angular difference (a) and parallelness (b) of the actin cytoskeleton in untreated guard cells. d, e Mean angular difference (d) and parallelness (f) of the actin cytoskeleton in guard cells treated for 1 h with flg22. g, h Mean angular difference (g) and parallelness (h) of the actin cytoskeleton in guard cells treated for 2 h with flg22. Box plots of the values are shown with whiskers from the 5th to 95th percentiles, the line in the box shows the median; 1 h flg22 treatment: WT Col-0 n = 73, net4ab-c2 n = 64 guard cells, p < 0.0001 Mann Whitney t-test; 2 h flg22 treatment: WT Col-0 n = 38, net4ab-c2 n = 23 guard cells, p = 0.0777 ns Mann Whitney t-test; Stomata opening buffer: WT Col-0 n = 10, net4ab-c2 n = 7 guard cells, - angle p = 0.3638, parallelness p = 0.1088 ns Mann Whitney t-test. c, f, i Representative super-resolution Airyscan confocal images of Lifeact-mNeonGreen-positive actin filaments in Col-0 WT and net4ab-c2 untreated and treated for 1 and 2 hrs with flg22, respectively. Scale bars = 10 µm. The experiments were repeated at least thrice with similar results.

Similar articles

Cited by

References

    1. Deeks MJ, et al. A superfamily of actin-binding proteins at the actin-membrane nexus of higher plants. Curr. Biol. 2012;22:1595–1600. - PubMed
    1. Wang P, Hawkins TJ, Hussey PJ. Connecting membranes to the actin cytoskeleton. Curr. Opin. Plant Biol. 2017;40:71–76. - PubMed
    1. Hawkins TJ, Deeks MJ, Wang P, Hussey PJ. The evolution of the actin binding NET superfamily. Front. Plant Sci. 2014;5:254. - PMC - PubMed
    1. Wang P, Hussey PJ. NETWORKED 3B: a novel protein in the actin cytoskeleton-endoplasmic reticulum interaction. J. Exp. Botany. 2017;68:1441–1450. - PMC - PubMed
    1. Duckney P, et al. Actin-membrane interactions mediated by NETWORKED2 in Arabidopsis pollen tubes through associations with Pollen Receptor-Like Kinase 4 and 5. New Phytol. 2017;216:1170–1180. - PubMed

Publication types