. 2023 Sep 20;14(1):5835.
doi: 10.1038/s41467-023-40835-4.

A subset of viruses thrives following microbial resuscitation during rewetting of a seasonally dry California grassland soil

Affiliations

A subset of viruses thrives following microbial resuscitation during rewetting of a seasonally dry California grassland soil

Alexa M Nicolas et al. Nat Commun. .

Abstract

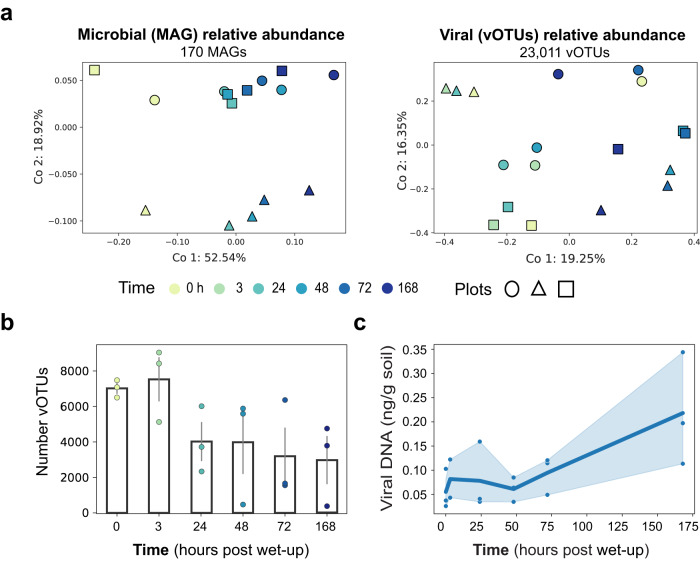
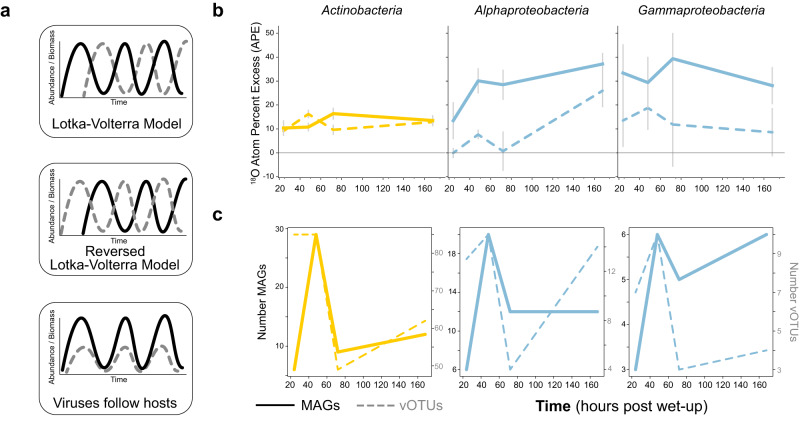
Viruses are abundant, ubiquitous members of soil communities that kill microbial cells, but how they respond to perturbation of soil ecosystems is essentially unknown. Here, we investigate lineage-specific virus-host dynamics in grassland soil following "wet-up", when resident microbes are both resuscitated and lysed after a prolonged dry period. Quantitative isotope tracing, time-resolved metagenomics and viromic analyses indicate that dry soil holds a diverse but low biomass reservoir of virions, of which only a subset thrives following wet-up. Viral richness decreases by 50% within 24 h post wet-up, while viral biomass increases four-fold within one week. Though recent hypotheses suggest lysogeny predominates in soil, our evidence indicates that viruses in lytic cycles dominate the response to wet-up. We estimate that viruses drive a measurable and continuous rate of cell lysis, with up to 46% of microbial death driven by viral lysis one week following wet-up. Thus, viruses contribute to turnover of soil microbial biomass and the widely reported CO2 efflux following wet-up of seasonally dry soils.


Conflict of interest statement

J.F.B. is a founder of Metagenomi. The remaining authors declare no competing interests.

Figures

Fig. 1
Fig. 1. Experimental overview describing the recovery of genomes from time-resolved cellular (metagenomes) and viral size-fraction metagenomes (viromes) following soil wet-up.
Triplicate sampled soil microcosms were destructively harvested before (0 h) or following addition of natural abundance water (H216O, shown in blue) (3h, 24, 48, 72, and 168 h) for the generation of viromes and metagenomes or with H218O, stable isotope-enriched water (shown in red), for metagenomics with quantitative stable isotope probing (qSIP). Below the depiction of the microcosms is a cartoon of a microbial cell and its genome before (blue) and after (red) incorporation of 18O-DNA. Microcosms fated for metagenomic sequencing did not include a 3 h time point. Sample prep for viromes, metagenomes, and qSIP metagenomics prior to shotgun sequencing is shown on the right.
Fig. 2
Fig. 2. Temporal compositional changes in microbial and viral communities following soil wet-up.
a PCoA plots of MAGs (left) and vOTUs (right) calculated based on Bray-Curtis dissimilarity colored by time with different marker shapes signifying distinct field plots (biological replicates). b Barplot of the mean total number of unique vOTUs per time point. Error bars (gray) show the standard error of mean across all three field plots, with underlying points colored by time. c Mean viral biomass approximated through time using total extracted virome DNA (ng) per gram of soil normalized by the total vOTU relative abundance. Points represent the calculated viral biomass per distinct microcosm. The shaded area around the line represents a 95% confidence interval.
Fig. 3
Fig. 3. Dynamics of isotope-enriched (growing) viruses and microbes through time following soil wet-up.
Viruses or vOTUs are represented in all plots by dotted lines, MAGs are depicted by solid lines. Colors represent taxonomic groups (yellow are Actinobacteria, blue are Proteobacteria). a Hypothetical models of viral predation on microbes: Lotka–Volterra model, reversed Lotka–Volterra, and a model in which viruses track changes in host abundance. b Mean 18O atom percent excess (APE) for MAGs and vOTUs through time post wet-up. Error bars represent standard error of genome APE means. c Number of unique MAGs and vOTUs per lineage detected as incorporating isotope at each time point post wet-up.
Fig. 4
Fig. 4. Relative abundance and richness of integrase-encoding vOTUs through time following soil wet-up.
vOTUs were split by whether they encode an integrase gene (red) or not (blue). Cartoon above illustrates integrase-encoding vOTUs (red hexagon) have the capacity for their genomes to integrate into their host’s chromosome or no integrase gene vOTUs (blue hexagon) may not be able to integrate their genome into a host’s genome. The cartoon depicts vOTUs as hexagons and shows, from a MAG-perspective, detection of an integrated virus or prophage in a host genome. a Relative abundance (percent of total sampled reads) of integrase-encoding or not integrase-encoding vOTUs. Shaded area around lines represents a 95% confidence interval. b Counts of integrase-containing and non-integrase-containing vOTUs. Error bars show the standard error of the mean number of vOTUs in each of three replicate microcosms. c The aggregated relative abundance through time of MAGs detected as containing an integrated virus (red) or not (blue). The shaded area around lines represents a 95% confidence interval. d The total number of MAGs per phylum shown in stacked bars the counts containing an integrated virus or prophage (red) and MAGs with no detected integrating virus (blue).
Fig. 5
Fig. 5. Viral response to wet-up and corresponding contribution to microbial mortality.
a Conceptual model of changes in viral richness (gray-blue) and biomass (green) over time. b Modeled contribution of viruses to microbial mortality where each line graphed represents an estimated cumulative percent contribution for a different viral burst size shown in the legend ranging from 1 virion per lysed microbial cell (darkest blue) to 200 virions per lysed microbial cell (lightest blue).

References

    1. Williamson KE, Fuhrmann JJ, Wommack KE, Radosevich M. Viruses in soil ecosystems: an unknown quantity within an unexplored territory. Annu. Rev. Virol. 2017;4:201–219. - PubMed
    1. Kuzyakov Y, Mason-Jones K. Viruses in soil: nano-scale undead drivers of microbial life, biogeochemical turnover and ecosystem functions. Soil Biol. Biochem. 2018;127:305–317.
    1. Emerson JB, et al. Host-linked soil viral ecology along a permafrost thaw gradient. Nat. Microbiol. 2018;3:870–880. - PMC - PubMed
    1. Paez-Espino, D. et al. Uncovering Earth’s Virome. Nature10.1038/nature19094 (2016). - PubMed
    1. Pratama AA, van Elsas JD. The ‘Neglected’ soil virome—potential role and impact. Trends Microbiol. 2018;26:649–662. - PubMed

Publication types