

Leptin receptor gene deficiency minimally affects osseointegration in rats
- PMID: 37730735
- PMCID: PMC10511412
- DOI: 10.1038/s41598-023-42379-5
Leptin receptor gene deficiency minimally affects osseointegration in rats
Abstract
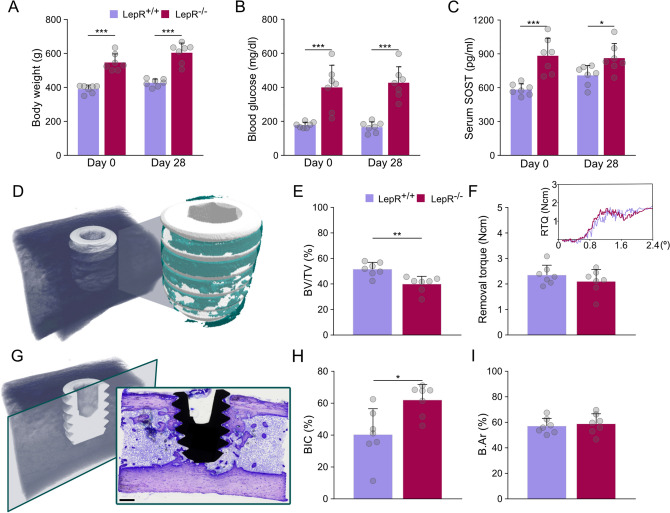
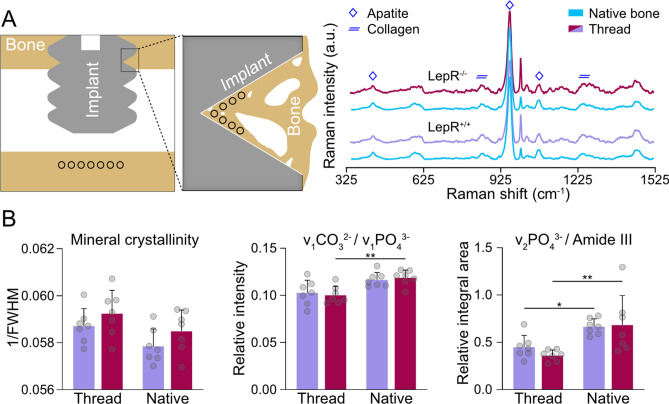
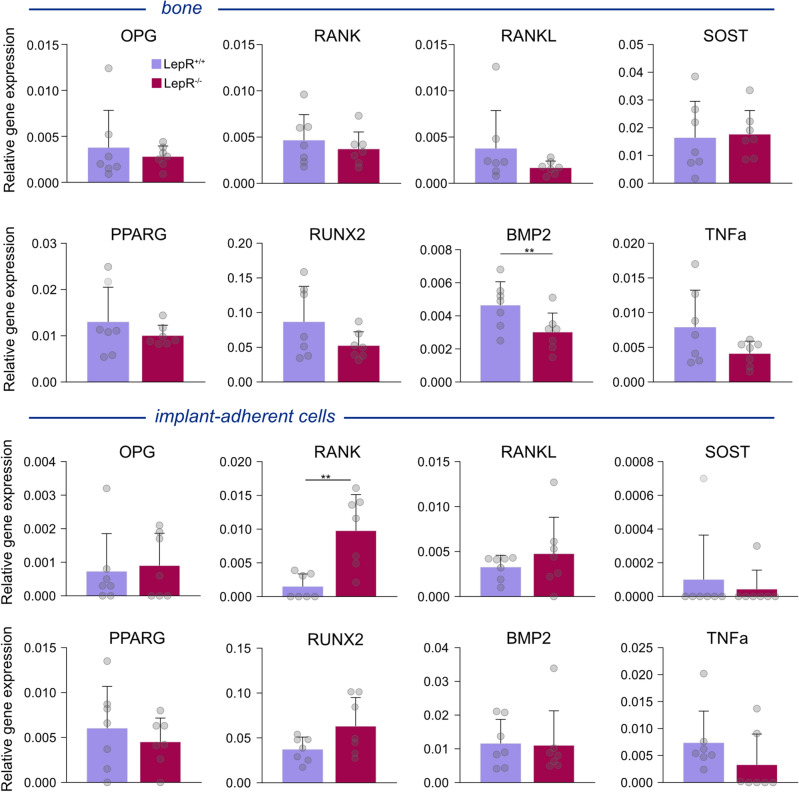
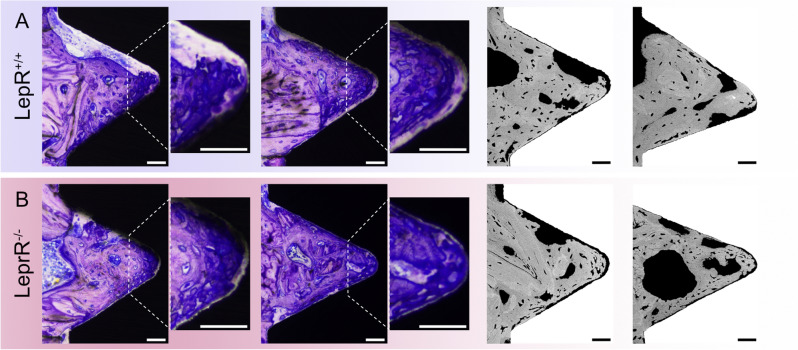
Metabolic syndrome represents a cluster of conditions such as obesity, hyperglycaemia, dyslipidaemia, and hypertension that can lead to type 2 diabetes mellitus and/or cardiovascular disease. Here, we investigated the influence of obesity and hyperglycaemia on osseointegration using a novel, leptin receptor-deficient animal model, the Lund MetS rat. Machined titanium implants were installed in the tibias of animals with normal leptin receptor (LepR+/+) and those harbouring congenic leptin receptor deficiency (LepR-/-) and were left to heal for 28 days. Extensive evaluation of osseointegration was performed using removal torque measurements, X-ray micro-computed tomography, quantitative backscattered electron imaging, Raman spectroscopy, gene expression analysis, qualitative histology, and histomorphometry. Here, we found comparable osseointegration potential at 28 days following implant placement in LepR-/- and LepR+/+ rats. However, the low bone volume within the implant threads, higher bone-to-implant contact, and comparable biomechanical stability of the implants point towards changed bone formation and/or remodelling in LepR-/- rats. These findings are corroborated by differences in the carbonate-to-phosphate ratio of native bone measured using Raman spectroscopy. Observations of hypermineralised cartilage islands and increased mineralisation heterogeneity in native bone confirm the delayed skeletal development of LepR-/- rats. Gene expression analyses reveal comparable patterns between LepR-/- and LepR+/+ animals, suggesting that peri-implant bone has reached equilibrium in healing and/or remodelling between the animal groups.
© 2023. Springer Nature Limited.
Conflict of interest statement
The authors declare no competing interests.
Figures


Similar articles
-
Bone structure and composition in a hyperglycemic, obese, and leptin receptor-deficient rat: Microscale characterization of femur and calvarium.Bone. 2023 Jul;172:116747. doi: 10.1016/j.bone.2023.116747. Epub 2023 Apr 5. Bone. 2023. PMID: 37028238
-
Differential effects of leptin receptor mutation on male and female BBDR Gimap5-/Gimap5- spontaneously diabetic rats.Physiol Genomics. 2010 Mar 3;41(1):9-20. doi: 10.1152/physiolgenomics.00186.2009. Epub 2009 Dec 8. Physiol Genomics. 2010. PMID: 19996157 Free PMC article.
-
Osseointegration of implants with superhydrophilic surfaces in rats with high serum levels of nicotine.Braz Dent J. 2023 Mar-Apr;34(2):105-112. doi: 10.1590/0103-6440202305096. Braz Dent J. 2023. PMID: 37194848 Free PMC article.
-
The effect of hyperglycaemia on osseointegration: a review of animal models of diabetes mellitus and titanium implant placement.Arch Osteoporos. 2016 Dec;11(1):29. doi: 10.1007/s11657-016-0284-1. Epub 2016 Sep 16. Arch Osteoporos. 2016. PMID: 27637755 Review.
-
Multimodal Analysis of the Tissue Response to a Bone-Anchored Hearing Implant: Presentation of a Two-Year Case Report of a Patient With Recurrent Pain, Inflammation, and Infection, Including a Systematic Literature Review.Front Cell Infect Microbiol. 2021 Mar 30;11:640899. doi: 10.3389/fcimb.2021.640899. eCollection 2021. Front Cell Infect Microbiol. 2021. PMID: 33859952 Free PMC article.
References
-
- World Health Organization. Obesity and Overweight. https://www.who.int/news-room/fact-sheets/detail/obesity-and-overweight (2021).
-
- International Diabetes Federation. IDF Diabetes Atlas. https://www.diabetesatlas.org (2021).
Publication types
MeSH terms
Substances
LinkOut - more resources
Full Text Sources
Medical
Molecular Biology Databases
Miscellaneous
