

Immunomodulatory contribution of mast cells to the regenerative biomaterial microenvironment
- PMID: 37730736
- PMCID: PMC10511634
- DOI: 10.1038/s41536-023-00324-0
Immunomodulatory contribution of mast cells to the regenerative biomaterial microenvironment
Abstract
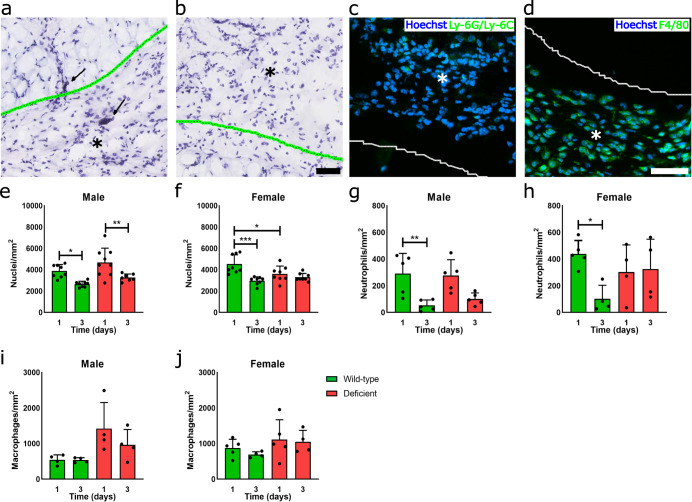
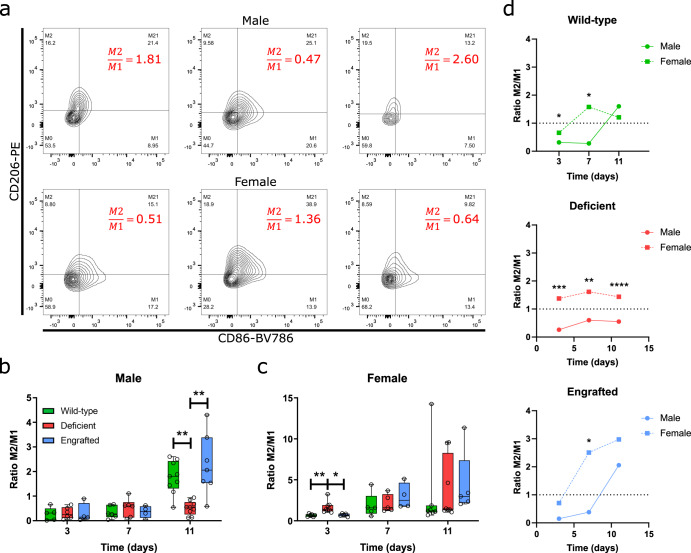
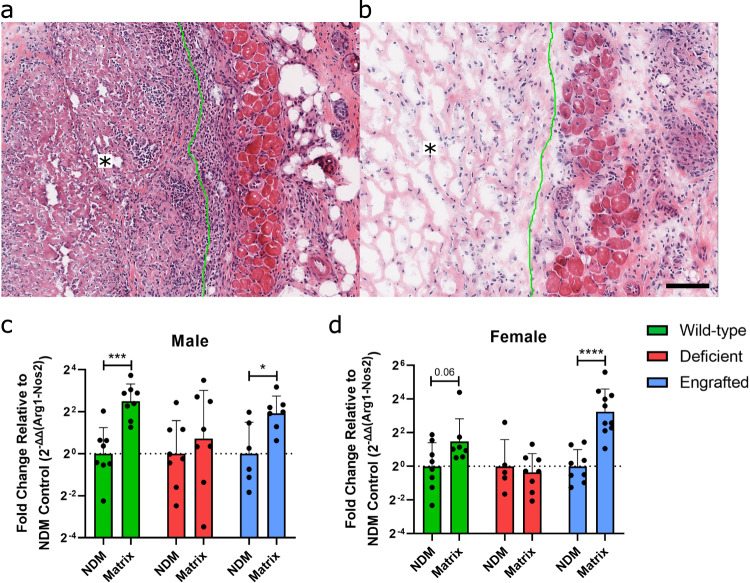
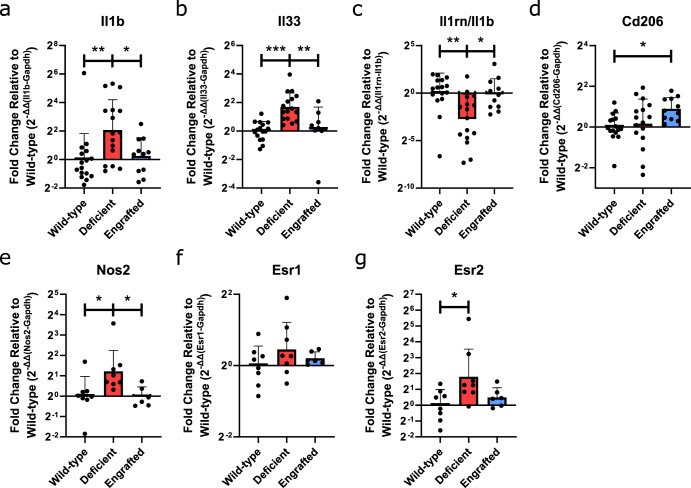
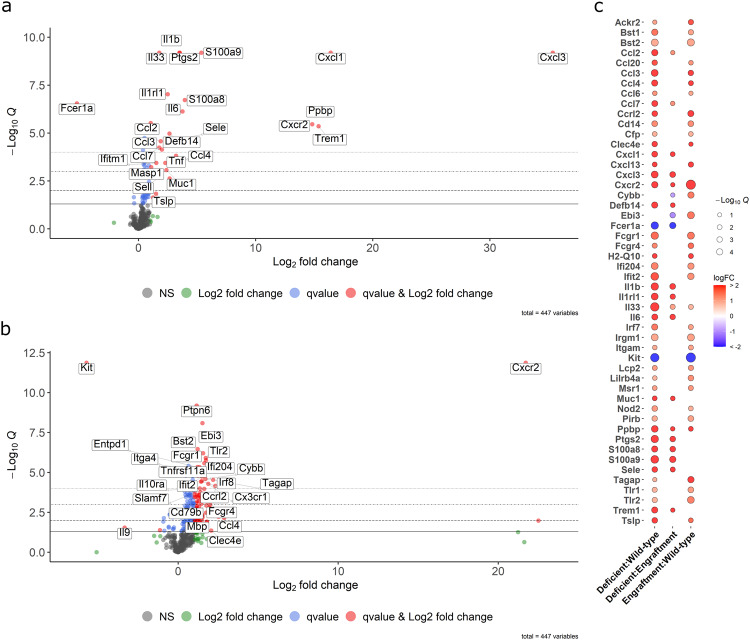
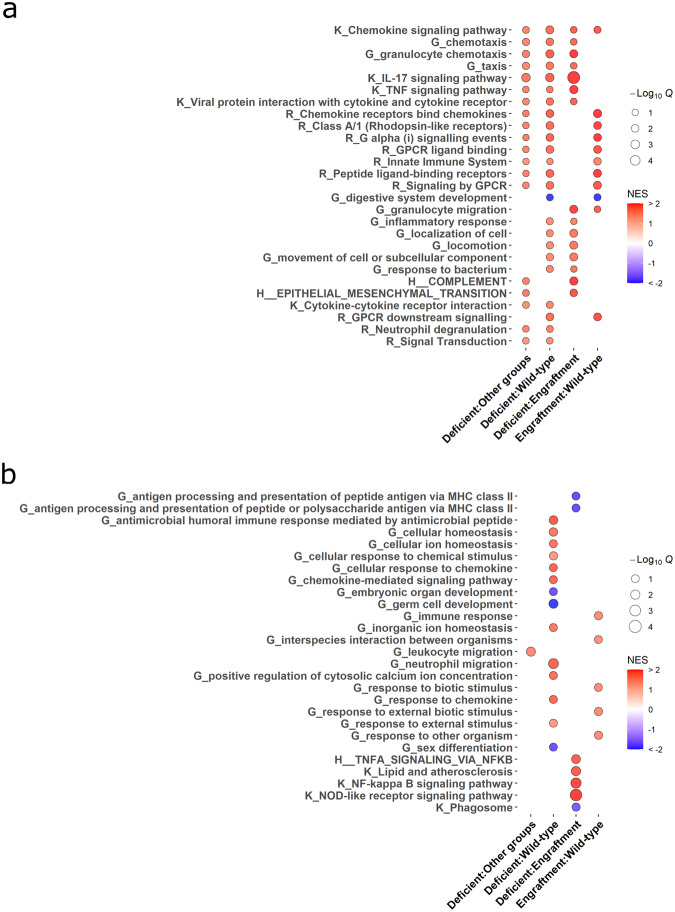
Bioactive immunomodulatory biomaterials have shown promise for influencing the immune response to promote tissue repair and regeneration. Macrophages and T cells have been associated with this response; however, other immune cell types have been traditionally overlooked. In this study, we investigated the role of mast cells in the regulation of the immune response to decellularized biomaterial scaffolds using a subcutaneous implant model. In mast cell-deficient mice, there was dysregulation of the expected M1 to M2 macrophage transition typically induced by the biomaterial scaffold. Polarization progression deviated in a sex-specific manner with an early transition to an M2 profile in female mice, while the male response was unable to properly transition past a pro-inflammatory M1 state. Both were reversed with adoptive mast cell transfer. Further investigation of the later-stage immune response in male mice determined a greater sustained pro-inflammatory gene expression profile, including the IL-1 cytokine family, IL-6, alarmins, and chemokines. These results highlight mast cells as another important cell type that influences the immune response to pro-regenerative biomaterials.
© 2023. Springer Nature Limited.
Conflict of interest statement
K.L.C. is a co-founder, consultant, board member, and holds an equity interest in Ventrix Bio, Inc, and is an Editor-in-Chief of
Figures
Similar articles
-
Phosphatidylserine liposome multilayers mediate the M1-to-M2 macrophage polarization to enhance bone tissue regeneration.Acta Biomater. 2022 Dec;154:583-596. doi: 10.1016/j.actbio.2022.10.024. Epub 2022 Oct 21. Acta Biomater. 2022. PMID: 36273800
-
Macrophage phenotypes in tissue repair and the foreign body response: Implications for biomaterial-based regenerative medicine strategies.Acta Biomater. 2021 Oct 1;133:4-16. doi: 10.1016/j.actbio.2021.03.038. Epub 2021 Mar 26. Acta Biomater. 2021. PMID: 33775905 Free PMC article. Review.
-
Sequential delivery of immunomodulatory cytokines to facilitate the M1-to-M2 transition of macrophages and enhance vascularization of bone scaffolds.Biomaterials. 2015 Jan;37:194-207. doi: 10.1016/j.biomaterials.2014.10.017. Epub 2014 Oct 23. Biomaterials. 2015. PMID: 25453950 Free PMC article.
-
Nano-particle mediated M2 macrophage polarization enhances bone formation and MSC osteogenesis in an IL-10 dependent manner.Biomaterials. 2020 May;239:119833. doi: 10.1016/j.biomaterials.2020.119833. Epub 2020 Jan 31. Biomaterials. 2020. PMID: 32062479
-
Inflammation-mediated matrix remodeling of extracellular matrix-mimicking biomaterials in tissue engineering and regenerative medicine.Acta Biomater. 2022 Oct 1;151:106-117. doi: 10.1016/j.actbio.2022.08.015. Epub 2022 Aug 13. Acta Biomater. 2022. PMID: 35970482 Review.
Cited by
-
Macrophage-associated biocompatibility of titanium revealed by analyzing foreign body reaction at bone-implant interface.J Adv Prosthodont. 2025 Jun;17(3):169-184. doi: 10.4047/jap.2025.17.3.169. Epub 2025 Jun 25. J Adv Prosthodont. 2025. PMID: 40687192 Free PMC article.
-
p16Ink4a-induced senescence in cultured mast cells as a model for ageing reveals significant morphological and functional changes.Immun Ageing. 2024 Nov 11;21(1):77. doi: 10.1186/s12979-024-00478-5. Immun Ageing. 2024. PMID: 39529115 Free PMC article.
-
Research Progress on the Preparation and Application of Decellularized Tendons.Curr Issues Mol Biol. 2025 Apr 6;47(4):251. doi: 10.3390/cimb47040251. Curr Issues Mol Biol. 2025. PMID: 40699650 Free PMC article. Review.
-
Navigating the Immunological Crossroads: Mesenchymal Stem/Stromal Cells as Architects of Inflammatory Harmony in Tissue-Engineered Constructs.Bioengineering (Basel). 2024 May 16;11(5):494. doi: 10.3390/bioengineering11050494. Bioengineering (Basel). 2024. PMID: 38790361 Free PMC article. Review.
-
On Connective Tissue Mast Cells as Protectors of Life, Reproduction, and Progeny.Int J Mol Sci. 2024 Apr 19;25(8):4499. doi: 10.3390/ijms25084499. Int J Mol Sci. 2024. PMID: 38674083 Free PMC article. Review.
References
-
- Christy AL, Brown MA. The multitasking mast cell: positive and negative roles in the progression of autoimmunity. J. Immunol. 2007;179:2673. - PubMed
-
- Amin K. The role of mast cells in allergic inflammation. Respir. Med. 2012;106:9–14. - PubMed
-
- Bhattacharya K, et al. Mast cell deficient W/Wv mice have lower serum IL-6 and less cardiac tissue necrosis than their normal littermates following myocardial ischemia-reperfusion. Int. J. Immunopathol. Pharm. 2007;20:69–74. - PubMed
Grants and funding
LinkOut - more resources
Full Text Sources
Miscellaneous
