. 2023 Sep 20;14(1):5837.
doi: 10.1038/s41467-023-41580-4.

VE-cadherin in arachnoid and pia mater cells serves as a suitable landmark for in vivo imaging of CNS immune surveillance and inflammation

Affiliations

VE-cadherin in arachnoid and pia mater cells serves as a suitable landmark for in vivo imaging of CNS immune surveillance and inflammation

Josephine A Mapunda et al. Nat Commun. .

Abstract

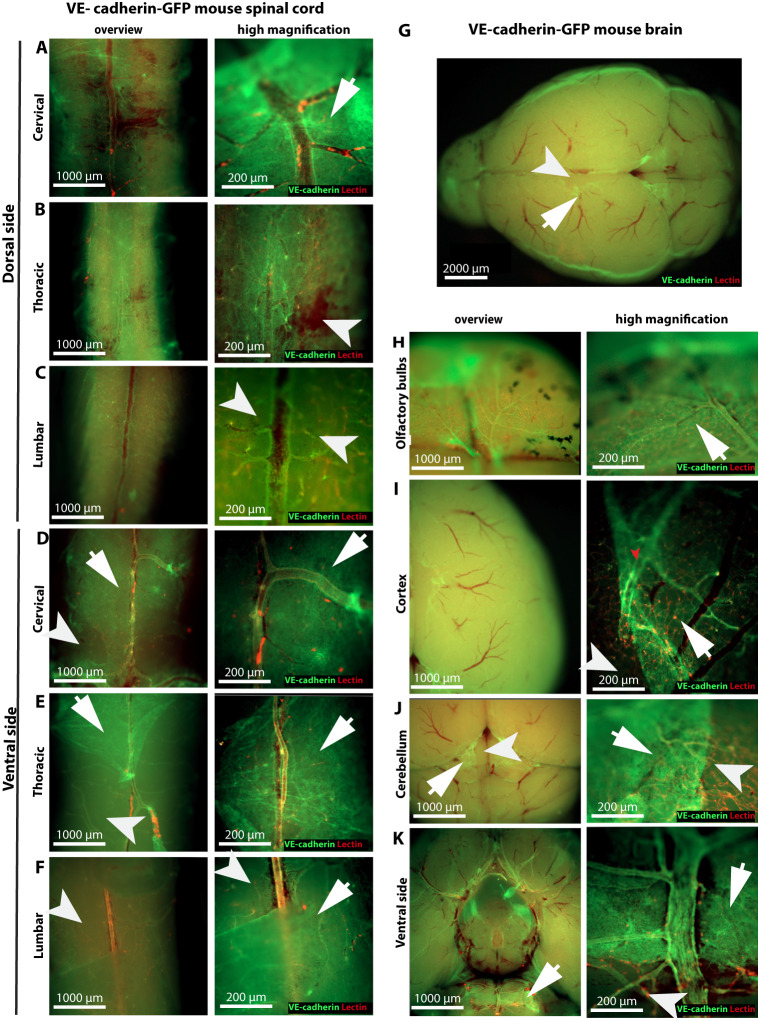
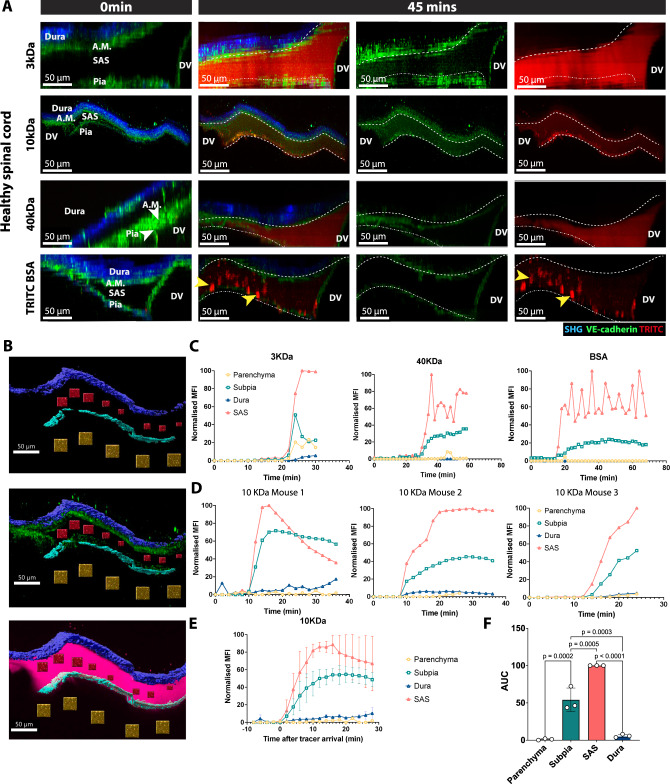
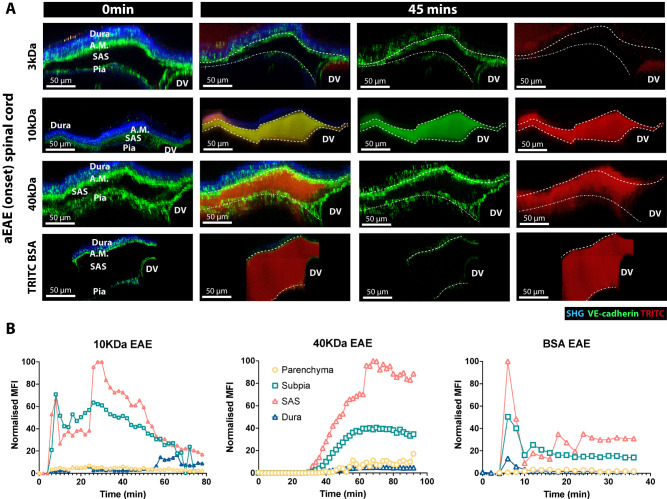
Meninges cover the surface of the brain and spinal cord and contribute to protection and immune surveillance of the central nervous system (CNS). How the meningeal layers establish CNS compartments with different accessibility to immune cells and immune mediators is, however, not well understood. Here, using 2-photon imaging in female transgenic reporter mice, we describe VE-cadherin at intercellular junctions of arachnoid and pia mater cells that form the leptomeninges and border the subarachnoid space (SAS) filled with cerebrospinal fluid (CSF). VE-cadherin expression also marked a layer of Prox1+ cells located within the arachnoid beneath and separate from E-cadherin+ arachnoid barrier cells. In vivo imaging of the spinal cord and brain in female VE-cadherin-GFP reporter mice allowed for direct observation of accessibility of CSF derived tracers and T cells into the SAS bordered by the arachnoid and pia mater during health and neuroinflammation, and detection of volume changes of the SAS during CNS pathology. Together, the findings identified VE-cadherin as an informative landmark for in vivo imaging of the leptomeninges that can be used to visualize the borders of the SAS and thus potential barrier properties of the leptomeninges in controlling access of immune mediators and immune cells into the CNS during health and neuroinflammation.


Conflict of interest statement

The authors declare no competing interests.

Figures

Fig. 1
Fig. 1. Pia mater and arachnoid mater cells can be identified by VE-cadherin-GFP expression.
A Schematic representation of the meningeal layers on the surface of the spinal cord. BL Representative images of the cervical spinal cord and brain as observed by 2P-IVM imaging of VE-cadherin GFP reporter mice via a cervical spinal cord window and skull thinning preparation, respectively. The dura mater is visible by the second-harmonic generation (blue) due to its richness in collagen type 1. VE-cadherin-GFP is shown in green. The subarachnoid space (SAS) is bordered by the VE-cadherin-GFP+ arachnoid and pia mater. VE-cadherin-GFP also marks blood vessels. The lumen of the spinal cord blood vessels is visible in red (B, DG) due to systemic injection of TRITC-BSA. In the skull thinning preparation (IL) the SAS is visible in red due to a cisterna magna injection of 10 kDa-TRITC dextran. Data are representative of three different mice. B YZ MIP of the 2P-IVM of the cervical spinal cord. Below the dura mater, a GFP signal is visible at the expected level of the arachnoid mater. The SAS is breached by VE-cadherin-GFP+ trabeculae (white arrowhead). A GFP signal can be seen below the SAS at the expected level of the pia mater. The lumen of the dorsal vein (DV) and subarachnoid blood vessels (red) ensheathed by VE-cadherin-GFP+ endothelial cells are visible. C YZ maximum intensity projection (MIP) of 2P-IVM of the meningeal layers on the surface of the brain of a VE-cadherin-GFP mouse. Within the dura mater, VE-cadherin-GFP+ blood vessels are visible. Below the dura mater, a GFP signal highlights the expected level of the arachnoid mater (AM). The VE-cadherin GFP signal can also be seen at the expected level of the pia mater. D Cervical spinal cord window preparation. YZ MIP of 2P-IVM of the meningeal layers on the surface of the spinal cord of a VE-cadherin-GFP mouse highlighting the arachnoid (A.M.) and pia mater (P.M). E XY MIP of the meningeal layers of the spinal cord. VE-Cadherin GFP+ AJs on the endothelial cells are visible on the walls of the dorsal vein and branching vessels. The blood vessel lumen is visible in red. Additional VE-cadherin GFP signal is visible outside the blood vessels. F XY MIP of the arachnoid mater level of the spinal cord from the region highlighted as A.M. from D. VE-cadherin GFP+ signal with junctional properties and no distinct cellular morphology that is not associated with blood vessels (red) is seen. G XY MIP of the pia mater from the region highlighted as P.M. from D. Large cells with VE-cadherin GFP+ AJ not associated with blood vessels (in red) are visible. H The skull thinning preparation and a schematic representation of the imaged anatomical location of the brain surface is shown. YZ MIP of 2P-IVM of the meningeal layers on the surface of the brain of a VE-cadherin-GFP mouse highlighting the dura, arachnoid (A.M.), and pia mater (P.M). I XY MIP of the meningeal layers of the surface of the brain is shown. VE-cadherin-GFP+ blood vessels are visible. Additional VE-cadherin GFP signal is visible outside the blood vessels. Perivascular red tracer is visible in the SAS. J XY MIP of the dura mater of the brain from the region. Remnants of the skull bone and the dura mater are visualized by the second-harmonic generation (blue). The VE-cadherin GFP+ AJs in the blood vessels of the dura mater are visible. White arrowheads point to non-endothelial VE-cadherin-GFP+ cells directly below the second-harmonic generation, possibly representing individual dural border cells. K XY MIP of the arachnoid and pia mater of the brain from the region highlighted as A.M. + P.M. VE-cadherin-GFP+ AJs in the blood vessels is also clearly visible. VE-cadherin-GFP+ signal with no association with blood vessels is also visible. Cisterna magna infusion of a 10 kDa TRITC-Dextran allows for visualization of the SAS along a meningeal artery. L 2P-IVM imaging after skull thinning in a VE-cadherin-GFP mouse cisterna magna infused with a 10kDa-TRITC dextran (red) and systemically injected with a 10kDa-AF647 dextran (white). The VE-cadherin-GFP+ signal is shown in green. Second-harmonic generation is shown in blue. DV dorsal vein, A.M. arachnoid mater, P.M. pia mater, SAS subarachnoid space, BV blood vessel.
Fig. 2
Fig. 2. VE-cadherin-GFP expression is detected in meningeal layers covering the entire CNS.
Representative images of ex vivo imaging of the leptomeningeal layers covering the different regions of the brain and spinal cord of a VE-cadherin GFP knock-in reporter mouse taken with an epifluorescence microscope. VE-cadherin GFP is visible in green. Tomato lectin was injected intravenously to visualize the blood vessels (in red). The region covered by the meninges is highlighted by a white arrow. A white arrowhead highlights regions where the meninges are ripped off. Data are representative of three different mice. AF Overviews (left) and high magnification (right) representative images of VE-cadherin GFP+ meningeal layers covering the A dorsal and D ventral cervical, B dorsal and E ventral thoracic, and C dorsal and F ventral lumbar regions of the spinal cord that is not associated with blood vessels (in red). G Representative image of an overview of the VE-cadherin GFP+ meningeal layer covering the whole brain surface dorsally. Blood vessels are visible in red. HK Overviews (left) and high magnification (right) representative images of VE-cadherin GFP+ meningeal layer covering the dorsal side of H the olfactory bulbs I the cortex J the cerebellum, and K ventral side of the brain, which is not associated with blood vessels (red).
Fig. 3
Fig. 3. VE-cadherin is not restricted to endothelial cell junctions.
Confocal imaging of 100 μm thick brain and spinal cord sections of a healthy VE-cadherin GFP knock-in reporter mouse and 20 μm thick brain and spinal cord sections of wild-type C57BL/6 J. PECAM-1 (red) and/or VE-cadherin (yellow) immunostaining was performed. DAPI (blue) stains the nucleus. Magnification ×40. AD XY MIP of the overview (left) and zoomed-in (right) representative images of the meningeal layers of the AC spinal cord and BD brain. A, B Endogenous VE-cadherin GFP+ signal in the endothelial AJs of the meningeal and parenchymal blood vessels is seen in green. Additional VE-cadherin GFP signal is visible outside the blood vessel walls (red) on the surface of the brain and spinal cord. C, D VE-cadherin staining in the endothelial AJs of the meningeal and parenchymal blood vessels is seen in yellow. Additional VE-cadherin staining (yellow) is visible outside the blood vessel walls (red) on the surface of the brain and spinal cord. Images are representative of a total of three mice imaged in a total of three experiments.
Fig. 4
Fig. 4. VE-cadherin expression in meningeal cells of the brain and spinal cord.
Confocal microscopic images of 100-μm (A, B) and 20-μm (C) sections of the spinal cord and brain of healthy VE-cadherin-GFP knock-in reporter mice after immunostaining for known markers for the arachnoid (E-cadherin, ALCAM, ER-TR7) and pia mater (ER-TR7 and ALCAM). DAPI (blue) stains the nucleus. Magnification ×40 (A, B) and ×63 (C). A, B XY MIP of the overview (left) and zoomed-in (right) stained spinal cord and brain sections. In the overview images, staining for ER-TR7 and ALCAM can be seen in meningeal layers over the surface of the brain and spinal cord. A In the zoomed-in images (right), the VE-cadherinGFP signal overlaps ER-TR7 staining (red) in the arachnoid mater (A.M.) and pia mater. A layer of ER-TR7-positive cells (red) also covers pial blood vessels (green) entering the CNS parenchyma. Data are representative of three independent experiments. B VE-cadherin GFP signal in the arachnoid and pia mater overlaps ALCAM staining (red) over the brain and the spinal cord. Scale bars of the whole spinal cord and brain section overviews = 1000 µm and 2000 µm, respectively, zoomed-in (right) = 50 and 100 µm as indicated. Data are representative of three independent experiments. C VE-cadherin-GFP (green) signal of the arachnoid mater is juxtaposed to E-cadherin (magenta) immunoreactivity of decalcified vertebral column and head. No E-cadherin immunoreactivity is visible in the pia mater. White asterisks mark vessel lumens. Optical section = 0.16 µm. MIP maximal intensity projection. Scale bars = 5 and 10 µm as indicated. Data are representative of six independent experiments. A.M. = arachnoid mater.
Fig. 5
Fig. 5. VE-cadherin at adherens junctions between cells of the arachnoid and pia mater.
A, B Representative images of 20-µm coronal frozen sections of the brain of a healthy VE-cadherin-GFP reporter mouse perfused with tomato lectin-DyLight 594 (red), acquired with a confocal laser scanning microscope equipped with the Airyscan detector. Brains were cut ~1 mm caudal to the bregma. Immunostaining for α-catenin (A) and β-catenin (B) is magenta. Colocalization of the VE-cadherin-GFP signal (green) with α-catenin or β-catenin immunoreactivity (magenta) in the leptomeninges is white. Optical section = 0.16 µm. MIP, maximal intensity projection. Scale bars = 10 µm (left 2 columns); 2 µm (right 3 columns of zoomed-in images). Images are representative of three independent experiments. C Representative image of a 50-µm transverse frozen section of the decalcified head of a healthy VE-cadherin-GFP (green) reporter mouse perfused with tomato lectin-DyLight 594 (red), acquired with a confocal laser scanning microscope. Continuous linear patterns of VE-cadherin-GFP+ junctions in vascular endothelial cells (yellow arrowheads) differ from the more punctate pattern of VE-cadherin-GFP+ junctions between leptomeningeal cells (white arrowheads). Longitudinally oriented arterial endothelial cells, aligned with the direction of blood flow, are readily distinguished from polygonal endothelial cells in a venule. The XY MIP image was compiled from 20 optical sections, each 0.17 µm thick. Scale bar = 10 µm. Images are representative of three independent experiments. D TEM image of the cellular layers of the arachnoid with intercellular junctions marked by colored arrowheads. Tight junctions (zonula occludens), adherens junctions (intermediate junctions or zonula adherens), and gap junctions were identified by criteria described in the Methods. Blue arrowheads mark the basement membrane of a region of inner arachnoid cells facing a wide intercellular space. Subarachnoid and subdural spaces are labeled accordingly. Scale bar = 2 µm. Image is representative of TEM images of arachnoid from three mice.
Fig. 6
Fig. 6. VE-cadherin+/Prox1+ cells in a layer of arachnoid mater.
A, B Images of thin (10 µm) coronal cryosections of decalcified thoracic spinal cord (A) and head (B) of VE-cadherin-GFP; Prox1-tdTomato double reporter mice, acquired by confocal laser scanning microscopy. The VE-cadherin-GFP signal (green) is visible in the arachnoid mater, pia mater, and blood vessel endothelial cells. The Prox1-tdTomato signal (white) overlaps the VE-cadherin-GFP signal in the arachnoid. No Prox1-tdTomato signal is evident in the pia mater. E-cadherin immunostaining (magenta) is adjacent to but does not overlap the Prox1-tdTomato signal. White arrowheads mark the VE-cadherin-GFP signal in adherens junctions of vascular endothelial cells. Yellow arrowheads mark the more delicate VE-cadherin-GFP signal in adherens junctions of the leptomeninges. White asterisks mark vessel lumens. Decalcified heads were cut ~2.5 mm caudal to the bregma. Scale bars = 10 µm. CE Images of 2P-IVM of VE-cadherin-GFP; Prox1-tdTomato double reporter mice made through a cervical spinal cord window (C, D) or after skull thinning (C, E). VE-cadherin-GFP (green) at junctions is visible in the arachnoid and pia mater and in blood vessel endothelial cells over the brain and spinal cord. Prox1-tdTomato (red) is visible in the arachnoid mater in both locations but in the pia mater only over the spinal cord. The second-harmonic generation signal (blue) in skull thinning preparation (C) shows remnants of skull bone and dura mater. C YZ MIP of the cervical spinal cord and brain. D, E XY MIP of the cervical spinal cord (D) and skull thinning (E) preparation. XY MIP from full 100-µm Z-stacks are shown in the first row. Spinal cord (D) and brain (E) cross-sections cropped to show two distinct regions defined by dashed lines in C. F YZ MIP images of brain in a skull thinning preparation of a VE-cadherin-GFP; Prox1-tdTomato mouse injected intravenously with 10kDa-AF647-Dextran (white). Representative of images from three different mice. Second-harmonic generation is shown in blue. DV dorsal vein, A.M. arachnoid mater, P.M. pia mater, SAS subarachnoid space; BV blood vessel.
Fig. 7
Fig. 7. Visualization of CNS zonation created by leptomeningeal barriers in healthy VE-cadherin GFP reporter mice in vivo.
A Representative images of the spinal cord window 2P-IVM imaging of a healthy VE-cadherin-GFP knock-in reporter mice. Before the spinal cord window preparation, a tracer-filled cannula was implanted into the cisterna magna. During 2P-IVM, the mice were infused with 2.5 µl of either 3 kDa, 10 or 40 kDa TRITC dextran, or TRITC BSA at a rate of 1 µl/min using a syringe pump. XY time-lapse sequence of a 400 µm × 400 μm scan field at a depth of 160–220 µm and 81–111 z-projections with 2 µm spacing were acquired for 45 mins (spinal cord). The dura mater is visible in blue due to the second-harmonic generation of the collagen type 1 fibers in the dura. Arachnoid mater (A.M.) and pia mater are visible in green due to the VE-cadherin-GFP expression. Infused tracer is seen in red. YZ MIP of the meningeal layers of the spinal cord of a healthy VE-cadherin GFP knock-in reporter mouse is shown. At 0 min, no tracer (red) was seen. At 45 mins, the 3KDa, 10 kDa, and 40 kDa TRITC dextran and TRITC BSA (red) crossed the pia mater but not the arachnoid mater. Yellow arrowheads highlight phagocytic cells in SAS that have taken up BSA. Images are representative of three independent experiments per tracer. B YZ MIP of the spinal cord meningeal layers of a VE-cadherin GFP knock-in reporter mouse showing the segmented volumes for longitudinal quantification of the fluorescence intensity of the cisterna magna injected TRITC tracers (magenta). Dura mater (dark blue) and subpial compartment (light blue) are segmented based on the second-harmonic generation signals. SAS (red) and spinal cord parenchyma (dark yellow) are segmented as cubes distributed in between the two VE-cadherin-GFP layers (green) or 20–50 µm under the VE-cadherin-GFP+ pia mater, respectively. C VE-cadherin-GFP knock-in mice were infused with 3-, 40-kDa-TRITC, and TRITC-BSA tracers into the cisterna magna and 2P-IVM was performed over time. Graphs show the longitudinal quantification of the mean fluorescence intensity of the injected tracer in the segmented volumes from the spinal cord meningeal cross-section shown in B. Data are normalized to the highest MFI value detected in the SAS after background signal subtraction. Background signal was determined as the average fluorescence signal measured in all segmented volumes prior to tracer injection. Each graph shows the full quantification of one mouse. Source data are provided as a Source Data file. D VE-cadherin-GFP mice were injected via the cisterna magna with 10-kDa-TRITC tracers and 2P-IVM was performed over time. Graphs show the longitudinal quantification of the mean fluorescence intensity of the injected tracer in the segmented volumes from the spinal cord meningeal cross-section shown in B. Data are normalized to the highest MFI value detected in the SAS after background signal substruction. Background signal was determined as the average fluorescence signal measured in all segmented volumes prior to tracer injection. Each graph shows the quantification of one individual mouse. Source data are provided as a Source Data file. E, F Graphs in D were combined after matching the dynamics of tracer arrival in the SAS of the field of view (FOV) (E). Area under the curve (AUC) was calculated in the different segmented volumes for the first 12 min after tracer arrival in the FOV. Data were pooled from three independent experiments and are shown as mean ± SD. Source data are provided as a Source Data file. F Data were pooled from three independent experiments and analyzed using one-way ANOVA with Tukey’s multiple comparisons test. Data are shown as mean ± SD. Source data are provided as a Source Data file. DV dorsal vein, A.M. arachnoid mater.
Fig. 8
Fig. 8. The VE-cadherin-GFP reporter mouse allows for in vivo visualization of alterations in leptomeningeal CNS zonations during neuroinflammation.
A Representative images of the spinal cord window 2P-IVM imaging of VE-cadherin-GFP knock-in reporter mice suffering from aEAE. Before a spinal cord window preparation, a tracer-filled cannula was implanted into the cisterna magna. During 2P-IVM, the mice were infused with 2.5 µl of either 3 kDa or 10 kDa, or 40 kDa TRITC dextran or TRITC BSA at a rate of 1 µl/min using a syringe pump. XY time-lapse sequence of a 400 µm × 400 μm scan field at a depth of 160–220 µm and 81–111 z-projections with 2 µm spacing were acquired for 45 mins. The dura mater is visible in blue due to the second-harmonic generation of the collagen type 1 fibers in the dura. Arachnoid mater (A.M., highlighted by a dashed line) and pia mater (highlighted by a dashed/dotted line) are visible in green due to the VE-cadherin expression. Injected tracer is seen in red. YZ MIP of the meningeal layers of the spinal cord of a VE-cadherin GFP knock-in reporter mouse suffering from aEAE imaged at the onset of the disease (days 13–15 p.i., clinical score +) are shown. At 0 min, no tracer (red) is seen. At 45 min, the 3KDa TRITC dextran (red) is seen in the dorsal vein (DV) and above the dura mater (blue), The 10- and 40-kDa TRITC dextran as well as the TRITC-BSA tracer (red) crossed the pia mater but not the arachnoid mater. Images are representative of three mice per tracer. B Graphs show the longitudinal quantification of the mean fluorescence intensity of the injected tracer in the segmented volumes from the spinal cord meningeal cross-sections shown in Fig. 7B. Data are normalized to the highest MFI value observed in the SAS after background signal substruction. Background signal was determined as the average of fluorescence signals observed in all segmented volumes prior to tracer injection. Each graph shows the full quantification of one mouse. Source data are provided as a Source Data file.
Fig. 9
Fig. 9. The VE-cadherin-GFP knock-in mouse allows for visualization of dynamic alterations of CSF spaces in health and under neuroinflammation.
A Representative cross-section images of the spinal cord meninges from healthy VE-cadherin GFP reporter mice and VE-cadherin-GFP mice suffering from aEAE at the onset of disease prior and post cisterna magna injection of tracers. The SAS was defined as the space bordered by VE-cadherin GFP signal (white) from the arachnoid mater (A.M.), the pia mater and from the endothelial cells of the dorsal vein (DV). Images are representative from 11 independent experiments per condition. BC Quantification of the SAS area in cross-section images of the spinal cord meninges from healthy. B VE-cadherin-GFP reporter mice and VE-cadherin-GFP mice suffering from aEAE at the onset of disease (C) prior and post cisterna magna injections of tracers. SAS area is defined as the space bordered by VE-cadherin GFP signal (white) from the arachnoid mater (A.M.), pia mater and from the endothelial cells of the dorsal vein (DV). Data were pooled from 11 independent experiments and analyzed using two-sided paired parametric T-test, and are represented as mean ± SD. Source data are provided as a Source Data file. D Quantification of the SAS area in cross-section images of the spinal cord meninges from healthy VE-cadherin-GFP reporter mice and VE-cadherin-GFP mice suffering from aEAE at the onset of disease prior cisterna magna injections of tracers. SAS area is defined as the space bordered by VE-cadherin GFP signal (white) from the arachnoid mater (A.M.), pia mater, and from the endothelial cells of the dorsal vein (DV). Data were pooled from 11 independent experiments per condition and analyzed using two-sided parametric T test, and are represented as mean ± SD. Source data are provided as a Source Data file. E Representative images of the spinal cord window 2P-IVM imaging of a VE-cadherin-GFP knock-in reporter mouse suffering from EAE at the onset (day 14 p.i., clinical score +) and at the chronic phase (day 25 p.i., clinical score +). The dura mater is visible in blue due to the second-harmonic generation of the collagen type 1 fibers in the dura. VE-cadherin-GFP is visible in green. Fluorescent Dextran was injected intravenously to visualize the blood vessels (red). At both time points, the dura mater (blue), arachnoid mater (A.M.), and pia mater are seen. A large SAS with trabeculae (white arrowhead) between the arachnoid mater and pia mater is visible. At the onset timepoint, a subpial space (SP) is visible between the dorsal vein (DV) and the pia mater (highlighted by a white arrow). Images are representative of seven mice per condition.
Fig. 10
Fig. 10. The VE-cadherin GFP reporter mouse allows for visualization of immune cell trafficking across the leptomeninges in vivo during health and neuroinflammation.
Representative images of spinal cord window 2P-IVM imaging of a VE-cadherin-GFP knock-in reporter mouse suffering from a CD8+ T-cell-mediated neuroinflammatory disease. On day 7 after viral infection, the mice were injected intravenously with a fluorescently labeled anti-endoglin antibody (white) to highlight the blood vessel lumen (BV). The dura mater is visible in blue due to the second-harmonic generation of the collagen type 1 fibers in the dura. OT-I CD8+ T cells are depicted in red. A X–Y MIP of the pia mater. White arrowhead shows an OT I CD8+ T cell (red) that has crossed the pia mater, and white arrow highlights one above the pia mater. See also Supplementary Movie 9. Data are representative of ten independent experiments. B, C YZ MIP of the meningeal layers of the spinal cord. The arachnoid mater (A.M.) and pia mater are visible in green due to VE-cadherin-GFP expression. OT I CD8+ T cells (red) are visible inside the blood vessel (BV), in the SAS, above and below the pia mater. White asterisk indicates a CD8+ T cell in the arachnoid mater. C Zoom-in of the magenta box in B showing the fluorescence signals (top panel) and the segmented surfaces (bottom panel) of the dura mater, arachnoid mater, pia mater, and OT I CD8+ T cells. Surfaces were rendered with Imaris 9.8 software. White arrow points to an OT I CD8+ T cell above the pia mater, white arrowhead points to an OT I CD8+ T cell below the pia mater and asterisks point to OT I CD8+ T cells interacting with arachnoid mater. White asterisks indicate CD8+ T cells in the arachnoid mater. Data are representative of seven mice imaged in seven different experiments. D, E XY and YZ MIP images of OT I CD8+ T cells (red) localized right above (D) or below (E) pia mater (green) in a VE-cadherin-GFP knock-in mouse. See also Supplementary Movie 10. Data are representative of three independent experiments. F Quantification of the number of OT I CD8+ T cells observed in different CNS compartments during immune surveillance and neuroinflammation. Data are pooled from three control mice (“immunosurveillance”) and 2 under neuroinflammation and shown as mean values. Source data are provided as a Source Data file. G Brains and spinal cords from ODC-OVA; VE-Cadherin-GFP knock-in mice were harvested on day 7 after induction of autoimmune neuroinflammation. GFAP immunofluorescence staining was performed on 20 μm cryosections. Images show the surface segmentations of the signals of VE-cadherin-GFP at the pia mater (green), glia limitans (purple), and OT I CD8+ T cells (red) rendered with Imaris 9.8 software. Original fluorescence images are shown on the right panel. White arrows point to OT-I CD8+ T-cell above the pia mater, white arrowhead points to an OT I CD8+ T cell below the pia mater. Images are representative of three independent experiments. H Violin plots of the crawling speed (μm/min), displacement, and directionality of OT I CD8+ T cells (a total of 30 cells per condition were analyzed in immunosurveillance from a total of 3 VE-cadherin-GFP knock-in mice and 30 cells per condition were analyzed during neuroinflammation from a total of two ODC-OVA; VE-cadherin-GFP knock-in mice). Cell tracking was performed with Imaris 9.8 software. Data were analyzed using two-sided unpaired parametric T test. Source data are provided as a Source Data file.

References

    1. Decimo I, Fumagalli G, Berton V, Krampera M, Bifari F. Meninges: from protective membrane to stem cell niche. Am. J. Stem Cells. 2012;1:92–105. - PMC - PubMed
    1. Haines, D. E. & Mihailoff., G. A. Fundamental neuroscience for basic and clinical application. In:Science Direct; Elsevier Publishing Company: Amsterdam, The Netherlands, 107–121 (2018).
    1. Balin BJ, Broadwell RD, Salcman M, el-Kalliny M. Avenues for entry of peripherally administered protein to the central nervous system in mouse, rat, and squirrel monkey. J. Comp. Neurol. 1986;251:260–280. - PubMed
    1. Aspelund A, et al. A dural lymphatic vascular system that drains brain interstitial fluid and macromolecules. J. Exp. Med. 2015;212:991–999. - PMC - PubMed
    1. Louveau A, et al. Structural and functional features of central nervous system lymphatic vessels. Nature. 2015;523:337–341. - PMC - PubMed

Publication types