Meta-Analysis
. 2023 Sep 20;13(1):15647.
doi: 10.1038/s41598-023-41381-1.

Conservative versus early surgical treatment in the management of pyogenic spondylodiscitis: a systematic review and meta-analysis

Affiliations
Meta-Analysis

Conservative versus early surgical treatment in the management of pyogenic spondylodiscitis: a systematic review and meta-analysis

Santhosh G Thavarajasingam et al. Sci Rep. .

Abstract

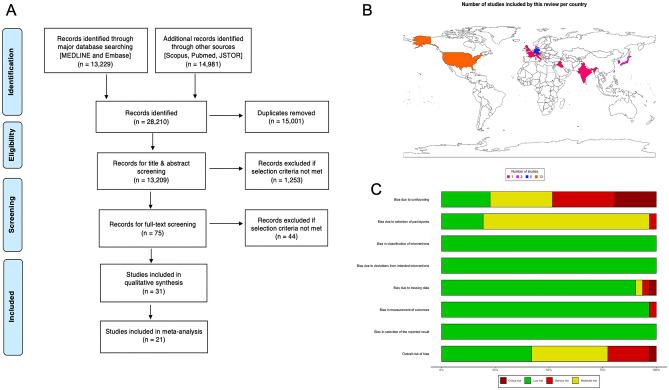
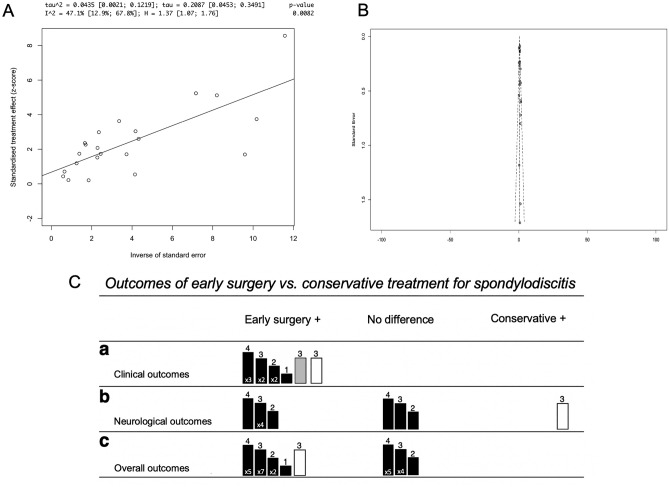
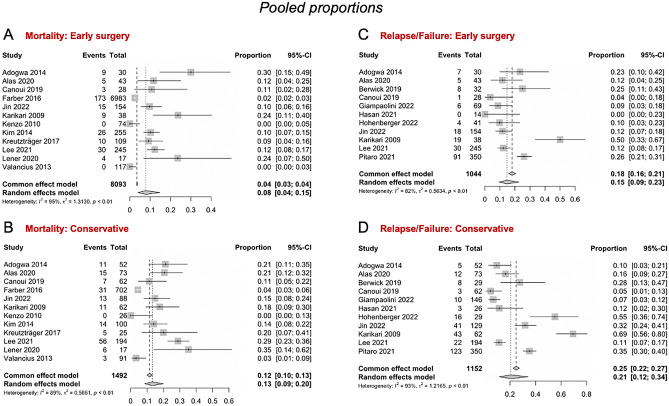
Spondylodiscitis is the commonest spine infection, and pyogenic spondylodiscitis is the most common subtype. Whilst antibiotic therapy is the mainstay of treatment, some advocate that early surgery can improve mortality, relapse rates, and length of stay. Given that the condition carries a high mortality rate of up to 20%, the most effective treatment must be identified. We aimed to compare the mortality, relapse rate, and length of hospital stay of conservative versus early surgical treatment of pyogenic spondylodiscitis. All major databases were searched for original studies, which were evaluated using a qualitative synthesis, meta-analyses, influence, and regression analyses. The meta-analysis, with an overall pooled sample size of 10,954 patients from 21 studies, found that the pooled mortality among the early surgery patient subgroup was 8% versus 13% for patients treated conservatively. The mean proportion of relapse/failure among the early surgery subgroup was 15% versus 21% for the conservative treatment subgroup. Further, it concluded that early surgical treatment, when compared to conservative management, is associated with a 40% and 39% risk reduction in relapse/failure rate and mortality rate, respectively, and a 7.75 days per patient reduction in length of hospital stay (p < 0.01). The meta-analysis demonstrated that early surgical intervention consistently significantly outperforms conservative management in relapse/failure and mortality rates, and length of stay, in patients with pyogenic spondylodiscitis.


Conflict of interest statement

The authors declare no competing interests.

Figures

Figure 1
Figure 1
(A) The preferred Reporting Items for Systematic Reviews and Meta-Analyses (PRISMA) flowchart outlining the study selection process is shown. (B) A world map indicated the origin of publications included in this study (n = 31),,–. The countries are coloured according to whether n = 1, 2, 5 or 13 studies from these countries have been included in this systematic review. The legend at the bottom indicates the colour coding. Following countries are coloured: United States of America (n = 13), United Kingdom (n = 1), France (n = 1), Italy (n = 1), Germany (n = 5), Austria (n = 1), Denmark (n = 2), Iraq (n = 1), India (n = 1), Taiwan (n = 1), Japan (2), South Korea (2). (C) A risk of bias summary plot for non-randomized studies with bar chart of the distribution of risk-of-bias judgments for all included studies (n = 31) across the domains of the ROBINS-I tool, shown in percentages (%) is shown. In the bottom, an overall risk of bias, which represents the collated risk-of-bias judgements for all domains, is depicted.
Figure 2
Figure 2
(A) Bar plot visualizes the number of prospective (n = 3), retrospective (n = 27) and ambispective (n = 1) studies included in the systematic review (n = 31),,–. (B) Bar plot visualizes the number of included studies (n = 31) that are cohort studies (n = 21), case series (n = 9) and case–control studies (n = 1). (C) Line plot displays the number of studies for the following years of publications: 1996 (n = 1), 2002 (n = 2), 2004 (n = 1), 2009 (n = 2), 2010 (n = 1), 2013 (n = 1), 2014 (n = 2), 2017 (n = 3), 2017 (n = 1), 2018 (n = 1), 2019 (n = 1), 2020 (n = 4), 2021 (n = 3), 2022 (n = 7). Each year is indicated as black circle, and the circles are connect by an interrupted line to visualise the trend more clearly. (D) Bar plot shows the sample size of each included study in the systematic review (n = 31). Studies are named alphabetically A–Z, each letter refers to the cited studies in synchronized order, which is furthermore depicted in the legend on the right of the graph. The bar plot is interrupted to allow for adequate visualisation of all data points.
Figure 3
Figure 3
(A) An Egger’s asymmetry plot of all data points included in the meta-analysis (n = 21 studies),–,,–,,,–,,,,; the x-axis represents the inverse of standard error, and the y-axis the standardized treatment effect (as z-score). Furthermore, at the top of the graph different parameters of heterogeneity, including I2, are shown. P-value < 0.05 is deemed to be significant and implicates publication bias. Egger’s asymmetry test yielded p = 0.0082, calculated running an Egger’s regression (see Egger’s regression line) on the collated DOR and standard errors of all data used in the meta-analysis (n = 21), indicating significant publication bias. (B) A funnel plot is shown, which plots every study included in the meta-analysis (n = 21). The observed effect sizes (diagnostic odds ratio) are on the x-axis against a measure of their standard error on the y-axis. All studies fall roughly within the parameters of the funnel plot, there are no gross outliers, indicating that there is no individual studies skewing the publication bias regression analysis. (C) The effects of early surgery versus conservative treatment for spondylodiscitis in terms of: (a) clinical [non-neurological] outcomes, (b) neurological outcomes, (c) overall outcomes, are visualized as harvest plot. The effects are stratified intro three columns: early surgery has better outcomes than conservative treatment (“Early surgery +), there is no difference between the two treatment modalities (“No difference”) and conservative treatment has better outcomes than early surgery (“Conservative +). A rectangle represents a single study, unless at bottom of the rectangle a number is specified as i.e. × 2 (= two studies). The colours of the rectangles correspond to the study design: black (retrospective), grey (ambispective), white (prospective). The number on top of the rectangle specifies the risk of bias in overall risk of bias (in line with risk of bias analysis, with 4 implying low risk of bias, 3 implying moderate risk, 2 serious risk and 1 critical risk). The height of the rectangle directly correlates to the risk of bias in outcome measurement, and the aforementioned number on top of the rectangle. Definitions for clinical and neurological outcomes are as follows: Clinical outcomes pools different definitions used by different studies including prognosis, recurrence, hospital stay, mortality rates, and lab parameters. Further in-depth investigation of these can be seen in the meta-analysis. On the other hand, the definition of neurological outcomes was split in two categories—the first being the presence or absence of neurological deficits, and the second being a graded scale of neurological deficits based on the American Spinal Injury Association Scale (ASIA scale).
Figure 4
Figure 4
Four forest plot indicating and visualizing the proportion in mortality and relapse/failure in the context of spondylodiscitis following early surgical management (treatment arm) versus conservative management (control arm) is shown, pooling the results of all the studies included in the meta-analysis. (A) The pooled proportional mortality after early surgery is shown, (B) pooled proportional mortality after conservative treatment, (C) pooled proportional relapse/failure after early surgery, (D) pooled proportional relapse/failure after conservative treatment. The size of the grey square of the “Proportion” visual correlates to study sample size and the straight line indicated the confidence interval. The diamond at the bottom indicates the overall pooled proportion. Heterogeneity is indicated by the chi-squared statistic (I2) with associated r2 and p-value. The 95% confidence intervals (CI) are shown in squared bracket ([ ]). P-value < 0.05 is deemed significant. Furthermore, for every study the following are displayed: study author with publication date (“Study”), total sample size number for each study for the respective treatment arm (“Total”), number of deaths/relapses (“Events”) per respective treatment arm, and proportion of deaths/relapses (“Proportion”), test for significance of overall effect size as tn and p-value, and weighting of each study in percentage (%).
Figure 5
Figure 5
(A) A forest plot indicating and visualizing the treatment effect (“TE”) size in relative risk in the context of comparing the mortality rate of spondylodiscitis following early surgical management (treatment arm) versus conservative management (control arm) is shown, pooling the results of all the 11 studies included in the meta-analysis. The size of the grey square of the “Relative Risk” visual correlates to study sample size and the straight line indicated the confidence interval. The diamond at the bottom indicates the overall pooled relative risk ratio. The red bar below it indicates the prediction interval. Heterogeneity is indicated by the chi-squared statistic (I 2) with associated r2 and p-value. The 95% confidence intervals (CI) are shown in squared bracket ([ ]). P-value < 0.05 is deemed significant. Furthermore, for every study the following are displayed: study author with publication date (“Study”), total sample size number for each study (“Total”), and standard error of the treatment effect (“seTE”), test for significance of overall effect size as tn and p-value, and weighting of each study in percentage (%). The weighting of each study represented in the percentage (%) is derived from the inverse of the variance of each study's effect estimate. This means that more weight is given to the studies that provide more detailed information or have less variability in their outcomes, giving a balanced representation of the available data in the pooled analysis. A significant pooled relative risk was yielded overall (p < 0.01), indicating that early surgical management vs conservative has a relative risk of 0.61 in the context of overall mortality. Effectively this means that early surgical management of spondylodiscitis achieves a 39% risk reduction (overall mortality) when compared to conservative management. (B) A forest plot indicating and visualizing the treatment effect (“TE”) size in relative risk in the context of comparing the relapse/failure/recurrence rate of spondylodiscitis following early surgical management (treatment arm) versus conservative management (control arm) is shown, pooling the results of all the 17 studies included in the meta-analysis. The size of the grey square of the “Relative Risk” visual correlates to study sample size and the straight line indicates the confidence interval. The diamond at the bottom indicates the overall pooled relative risk ratio. The red bar below it indicates the prediction interval. Heterogeneity is indicated by the chi-squared statistic (I2) with associated r2 and p-value. The 95% confidence intervals (CI) are shown in squared bracket ([ ]). P-value < 0.05 is deemed significant. Furthermore, for every study the following are displayed: study author with publication date (“Study”), total sample size number for each study (“Total”), and standard error of the treatment effect (“seTE”), test for significance of overall effect size as tn and p-value, and weighting of each study in percentage (%). A significant pooled relative risk was yielded overall (p < 0.01), indicating that early surgical management vs conservative has a relative risk of 0.6 in the context of leading to relapse/failure/recurrence. Effectively this means that early surgical management of spondylodiscitis achieves a 40% risk reduction (relapse/failure/recurrence) when compared to conservative management. (C) A forest plot indicating and visualizing the treatment effect (“TE”) size in relative risk in the context of comparing the mean length of hospital stay (in daysI of spondylodiscitis patients following early surgical management (treatment arm) versus conservative management (control arm) is shown, pooling the results of all the studies included in the meta-analysis. The size of the grey square of the “Mean Difference” visual correlates to study sample size and the straight line indicated the confidence interval. The diamond at the bottom indicates the overall pooled mean difference. The red bar below it indicates the prediction interval. Heterogeneity is indicated by the chi-squared statistic (I2) with associated r2 and p-value. The 95% confidence intervals (CI) are shown in squared bracket ([ ]). P-value < 0.05 is deemed significant. Furthermore, for every study the following are displayed: study author with publication date (“Study”), total sample size number for each study (“Total”), and standard error of the treatment effect (“seTE”), test for significance of overall effect size as tn and p-value, and weighting of each study in percentage (%). A significant pooled mean difference was yielded overall (p < 0.01), indicating that early surgical management vs conservative has -7.75 day mean difference in the context of overall length of stay, effectively meaning that surgery is associated with a mean 7.75 day reduction in length of stay. (D) A correlation matrix visualizes the relationships of following parameters among all studies included in the systematic review (n = 31): The following parameters are used here: Date of publication, lumbar location of infection, proportion of females overall, dropout rate, proportion of intravenous drug users, sample size, cervical location of infection, proportion of epidural abscesses, proportions of diabetics, mean overall relapse/failure rate, proportion of positive cultures (tissues and blood), relapse/failure rate in conservatively treated patient (“Relapse failure [C]”), relapse/failure rate in surgically treated patients (“Relapse failure [S]”), proportion of diabetics in conservatively treated patients, proportion of patients with diabetes, thoracic location of infection, mean age of study population, mortality rate overall, proportion of diabetics in surgically treated patients, combined thoracic and lumbar location of infection, mean overall mortality, mean mortality in surgically treated patients, proportion of nephropathy in surgically managed patients (“Nephropathy [S]”), and mean mortality in conservatively treated patients. The legend bar at the right of the matrix explains the coloring. Red hue indicates a negative association between two parameters, and a blue hue a positive association. One asterisk (*) indicates a statistical significance of p < 0.05, two asterisks (**) indicate p < 0.01, three asterisks (***) indicate p < 0.001.

References

    1. Thavarajasingam SG, Subbiah Ponniah H, Philipps R, Neuhoff J, Kramer A, Demetriades AK, Shiban E, Ringel F, Davies BM. Increasing incidence of spondylodiscitis in England: An analysis of the national health service (NHS) hospital episode statistics from 2012 to 2021. Brain Spine J. 2023;3:1. - PMC - PubMed
    1. Gouliouris T, Aliyu SH, Brown NM. Spondylodiscitis: Update on diagnosis and management. J. Antimicrob. Chemother. 2010;65(3):11–24. - PubMed
    1. Zimmerli W. Vertebral osteomyelitis. N. Engl. J. Med. 2010;362(11):1022–1029. - PubMed
    1. Castilla JM, Martin V, Rodriguez-Salazar A. Surgical treatment of patients with spinal infection. Neurocirugia (Asturias, Spain). 2002;13(2):101–109. - PubMed
    1. Kehrer M, Pedersen C, Jensen TG, Hallas J, Lassen AT. Increased short-and long-term mortality among patients with infectious spondylodiscitis compared with a reference population. Spine J. 2015;15(6):1233–1240. - PubMed

Publication types