. 2023 Sep 20;13(1):15632.
doi: 10.1038/s41598-023-42840-5.

Negative chemotaxis of Ligilactobacillus agilis BKN88 against gut-derived substances

Affiliations

Negative chemotaxis of Ligilactobacillus agilis BKN88 against gut-derived substances

Shunya Suzuki et al. Sci Rep. .

Abstract

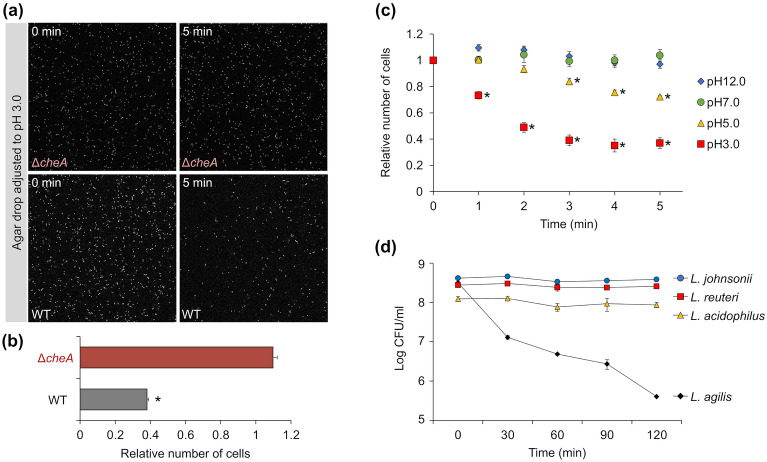
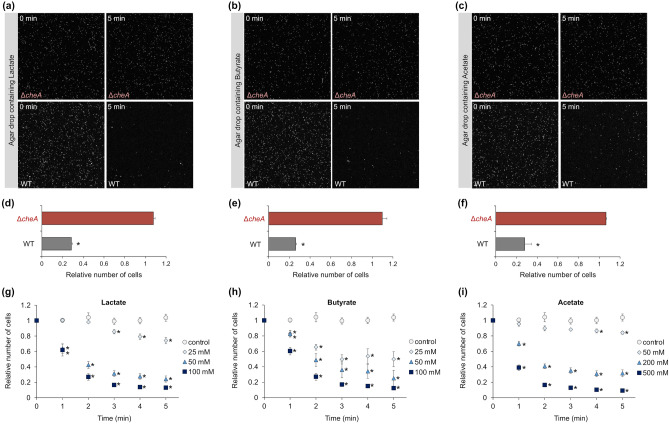
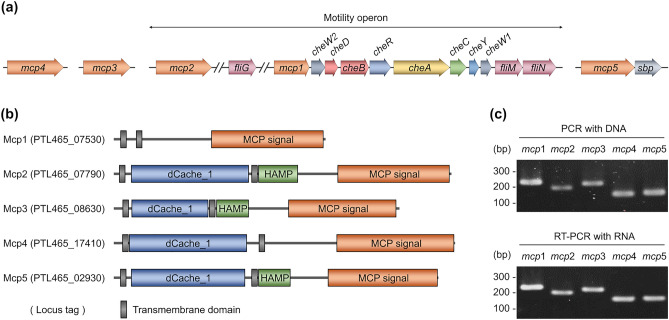
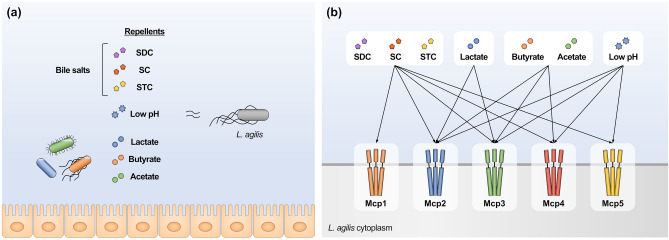
Ligilactobacillus agilis is a motile lactic acid bacterium found in the gastrointestinal tracts of animals. The findings of our previous study suggest that the motility of L. agilis BKN88 enables gut colonization in murine models. However, the chemotactic abilities of motile lactobacilli remain unknown. This study aimed to identify the gut-derived chemoeffectors and their corresponding chemoreceptors in L. agilis BKN88. Chemotaxis assays with chemotactic and non-chemotactic (ΔcheA) L. agilis strains revealed that low pH, organic acids, and bile salts served as repellents. L. agilis BKN88 was more sensitive to bile and acid than the gut-derived non-motile lactobacilli, implying that L. agilis might utilize motility and chemotaxis instead of exhibiting stress tolerance/resistance. L. agilis BKN88 contains five putative chemoreceptor genes (mcp1-mcp5). Chemotaxis assays using a series of chemoreceptor mutants revealed that each of the five chemoreceptors could sense multiple chemoeffectors and that these chemoreceptors were functionally redundant. Mcp2 and Mcp3 sensed all tested chemoeffectors. This study provides further insights into the interactions between chemoreceptors and ligands of motile lactobacilli and the unique ecological and evolutionary features of motile lactobacilli, which may be distinct from those of non-motile lactobacilli.


Conflict of interest statement

The authors declare no competing interests.

Figures

Figure 1
Figure 1
Chemotactic responses of Ligilactobacillus agilis to pH. (a, b) Chemotaxis toward acidic pH was observed in non-chemotactic (ΔcheA) and chemotactic [wild-type (WT)] L. agilis strains using the microscopic agar-drop assay. Details of the assay are described in Supplementary Fig. S2. (a) Representative microscopic images of the L. agilis ΔcheA or WT cells near the agar drop with pH adjusted to 3.0 at 0 or 5 min. (b) The relative number of cells represents the ratio of cells near the agar drop at 5 min to that at 0 min. Values are represented as the mean + standard error (SE) (n = 4). Significant difference is indicated using an asterisk (*P < 0.01; Student’s t-test). (c) Time-course chemotactic responses of L. agilis BKN88 (WT) to pH values of 3.0, 5.0, 7.0, and 12.0. The relative number of cells represents the ratio of cells near the agar drop at each time point to that at 0 min. Values are represented as the mean ± SE (n = 6). Significant difference between the pH 7.0 and other pH values is indicated using an asterisk (*P < 0.05; Dunnett’s test). (d) Susceptibility of L. agilis to acid. Colony-forming units (CFUs) of L. agilis BKN88, L. johnsonii NRIC 0220 T, L. reuteri PTL371, and L. acidophilus NCFM incubated in MRS with pH adjusted to 3.0 at 37 °C were counted once every 30 min. Values are represented as mean ± standard deviation (SD) (n = 3).
Figure 2
Figure 2
Chemotactic responses of L. agilis to bile. (ab) Chemotaxis toward bile was observed in non-chemotactic (ΔcheA) and chemotactic (WT) L. agilis strains using the microscopic agar-drop assay. (a) Representative microscopic images of the L. agilis ΔcheA or WT cells near the agar drop containing 0.1% (w/v) bile salt at 0 or 5 min. (b) The relative number of cells represents the ratio of cells near the agar drop at 5 min to that at 0 min. Values are represented as the mean + SE (n = 4). Significant difference is indicated using an asterisk (*P < 0.01; Student’s t-test). (cf) Time-course chemotactic responses of L. agilis BKN88 (WT) to various concentrations of bile salt (c) and its constituents [sodium deoxycholate (SDC), sodium cholate (SC), and sodium taurocholate (STC)]. The relative number of cells represents the ratio of cells near the agar drop at each time point to that at 0 min. An agar drop without test chemicals was used as a control. Values are represented as the mean ± SE (n = 6). Significant difference between the values of the control group and groups involving various concentrations of test chemicals is indicated using an asterisk (*P < 0.05; Dunnett’s test). (g) Susceptibility of L. agilis BKN88 to bile salt. CFUs of L. agilis BKN88, L. johnsonii NRIC 0220 T, L. reuteri PTL371, and L. acidophilus NCFM cultured on an MRS plate containing 0–2.0% (w/v) bile salts were counted. Values are represented as the mean ± SD (n = 3).
Figure 3
Figure 3
Chemotactic responses of L. agilis to organic acids produced by gut microbes. (af) Chemotaxis toward 100 mM lactate (a, d), 100 mM butyrate (b, e), and 500 mM acetate (c, f) were observed in non-chemotactic (ΔcheA) and chemotactic (WT) L. agilis strains using the microscopic agar-drop assay. (ac) Representative microscopic images of the L. agilis ΔcheA or WT cells near the agar drop containing organic acid salts at 0 or 5 min. (df) The relative number of cells represents the ratio of cells near the agar drop at 5 min to that at 0 min. Values are represented as the mean + SE (n = 4). Significant difference is indicated using an asterisk (*P < 0.01; Student’s t-test). (gi) Time-course chemotactic responses of L. agilis BKN88 (WT) to various concentrations of organic acid salts. The relative number of cells represents the ratio of cells near the agar drop at each time point to that at 0 min. An agar drop without test chemicals was used as a control. Values are represented as the mean ± SE (n = 6). Significant difference between the values of the control group and groups involving various concentrations of organic acid salts is indicated using an asterisk (*P < 0.05; Dunnett’s test).
Figure 4
Figure 4
Chemoreceptors of L. agilis BKN88. (a) A genetic map of chemotaxis-related genes in the L. agilis BKN88 genome. (b) Domain architectures of the five chemoreceptors were predicted using InterPro and CDvist. Transmembrane domains are shown as gray rectangles. MCP signal, cytoplasmic signaling domain; dCache_1 (a dual calcium channel and chemotaxis receptor), one of the ligand-binding domains; HAMP (histidine kinases, adenylyl cyclases, methyl binding proteins, and phosphatases), linker domain. (c) Expression of the MCP-encoding genes was evaluated using RT-PCR. PCR was performed with chromosomal DNA isolated from bacterial cells (upper). RT-PCR was performed with total RNA isolated from bacterial cells (lower).
Figure 5
Figure 5
Chemotactic responses of the putative methyl-accepting chemotaxis protein (MCP) deletion mutants. (ab) Chemotaxis toward pH 3.0, 100 mM lactate, 100 mM butyrate, 500 mM acetate, 20 mM sodium taurocholate (STC), 10 mM sodium deoxycholate (SDC), and 10 mM sodium cholate (SC) was observed in L. agilis strains lacking one or all of the MCP-encoding genes (a) and L. agilis strains expressing individual MCP-encoding genes (b). The relative number of cells represents the ratio of cells near the agar drop at 5 min to that at 0 min. Values are represented as the mean + SE (n = 6). Different superscripts indicate significant differences (P < 0.05; Tukey’s multiple comparison test). The dotted lines represent the values of L. agilis WT (a) or L. agilis Δmcp1-5 (b).
Figure 6
Figure 6
Schematic presentation of gut-derived chemoeffectors (a) and their corresponding chemoreceptors (b) in L. agilis identified in this study.

References

    1. Adler J. Chemotaxis in bacteria motile Escherichia coli migrate in bands that are influenced by oxygen and organic nutrients. Adv. Sci. 2008;153:708–716.
    1. Wadhams GH, Armitage JP. Making sense of it all: Bacterial chemotaxis. Nat. Rev. Mol. Cell Biol. 2004;5:1024–1037. doi: 10.1038/nrm1524. - DOI - PubMed
    1. Porter SL, Wadhams GH, Armitage JP. Signal processing in complex chemotaxis pathways. Nat. Rev. Microbiol. 2011;9:153–165. doi: 10.1038/nrmicro2505. - DOI - PubMed
    1. Parkinson JS, Hazelbauer GL, Falke JJ. Signaling and sensory adaptation in Escherichia coli chemoreceptors: 2015 update. Trends Microbiol. 2015;23:257–266. doi: 10.1016/j.tim.2015.03.003. - DOI - PMC - PubMed
    1. Sourjik V, Wingreen NS. Responding to chemical gradients: Bacterial chemotaxis. Curr. Opin. Cell Biol. 2012;24:262–268. doi: 10.1016/j.ceb.2011.11.008. - DOI - PMC - PubMed

Publication types

Substances

Supplementary concepts

LinkOut - more resources