. 2023 Sep;621(7980):804-812.
doi: 10.1038/s41586-023-06526-2. Epub 2023 Sep 20.

A multi-stem cell basis for craniosynostosis and calvarial mineralization

Affiliations

A multi-stem cell basis for craniosynostosis and calvarial mineralization

Seoyeon Bok et al. Nature. 2023 Sep.

Abstract

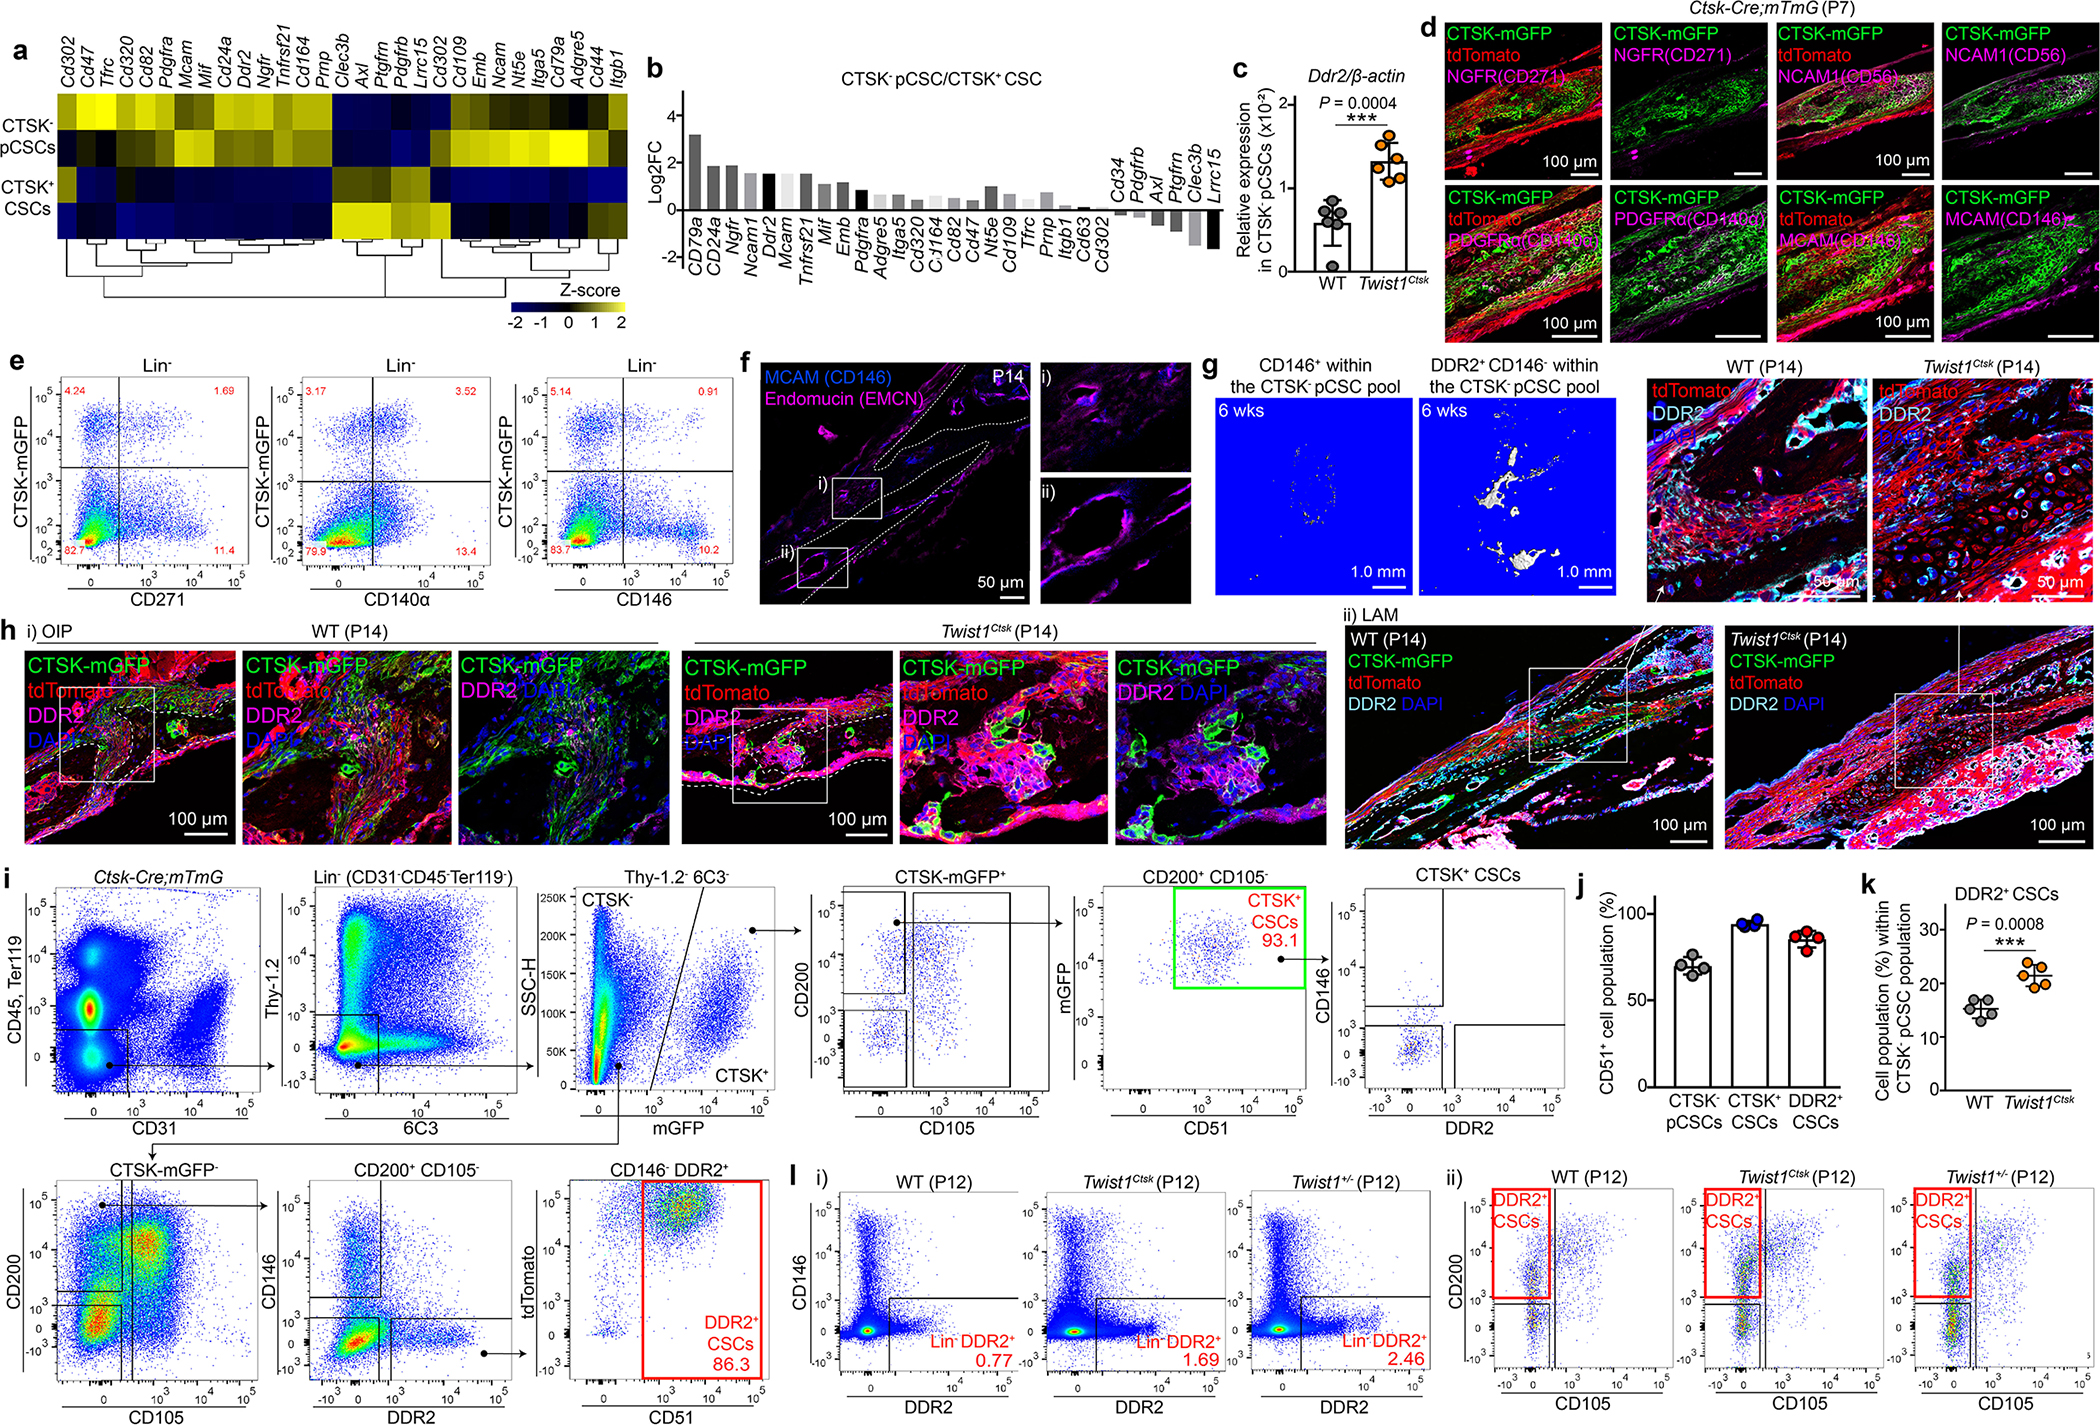
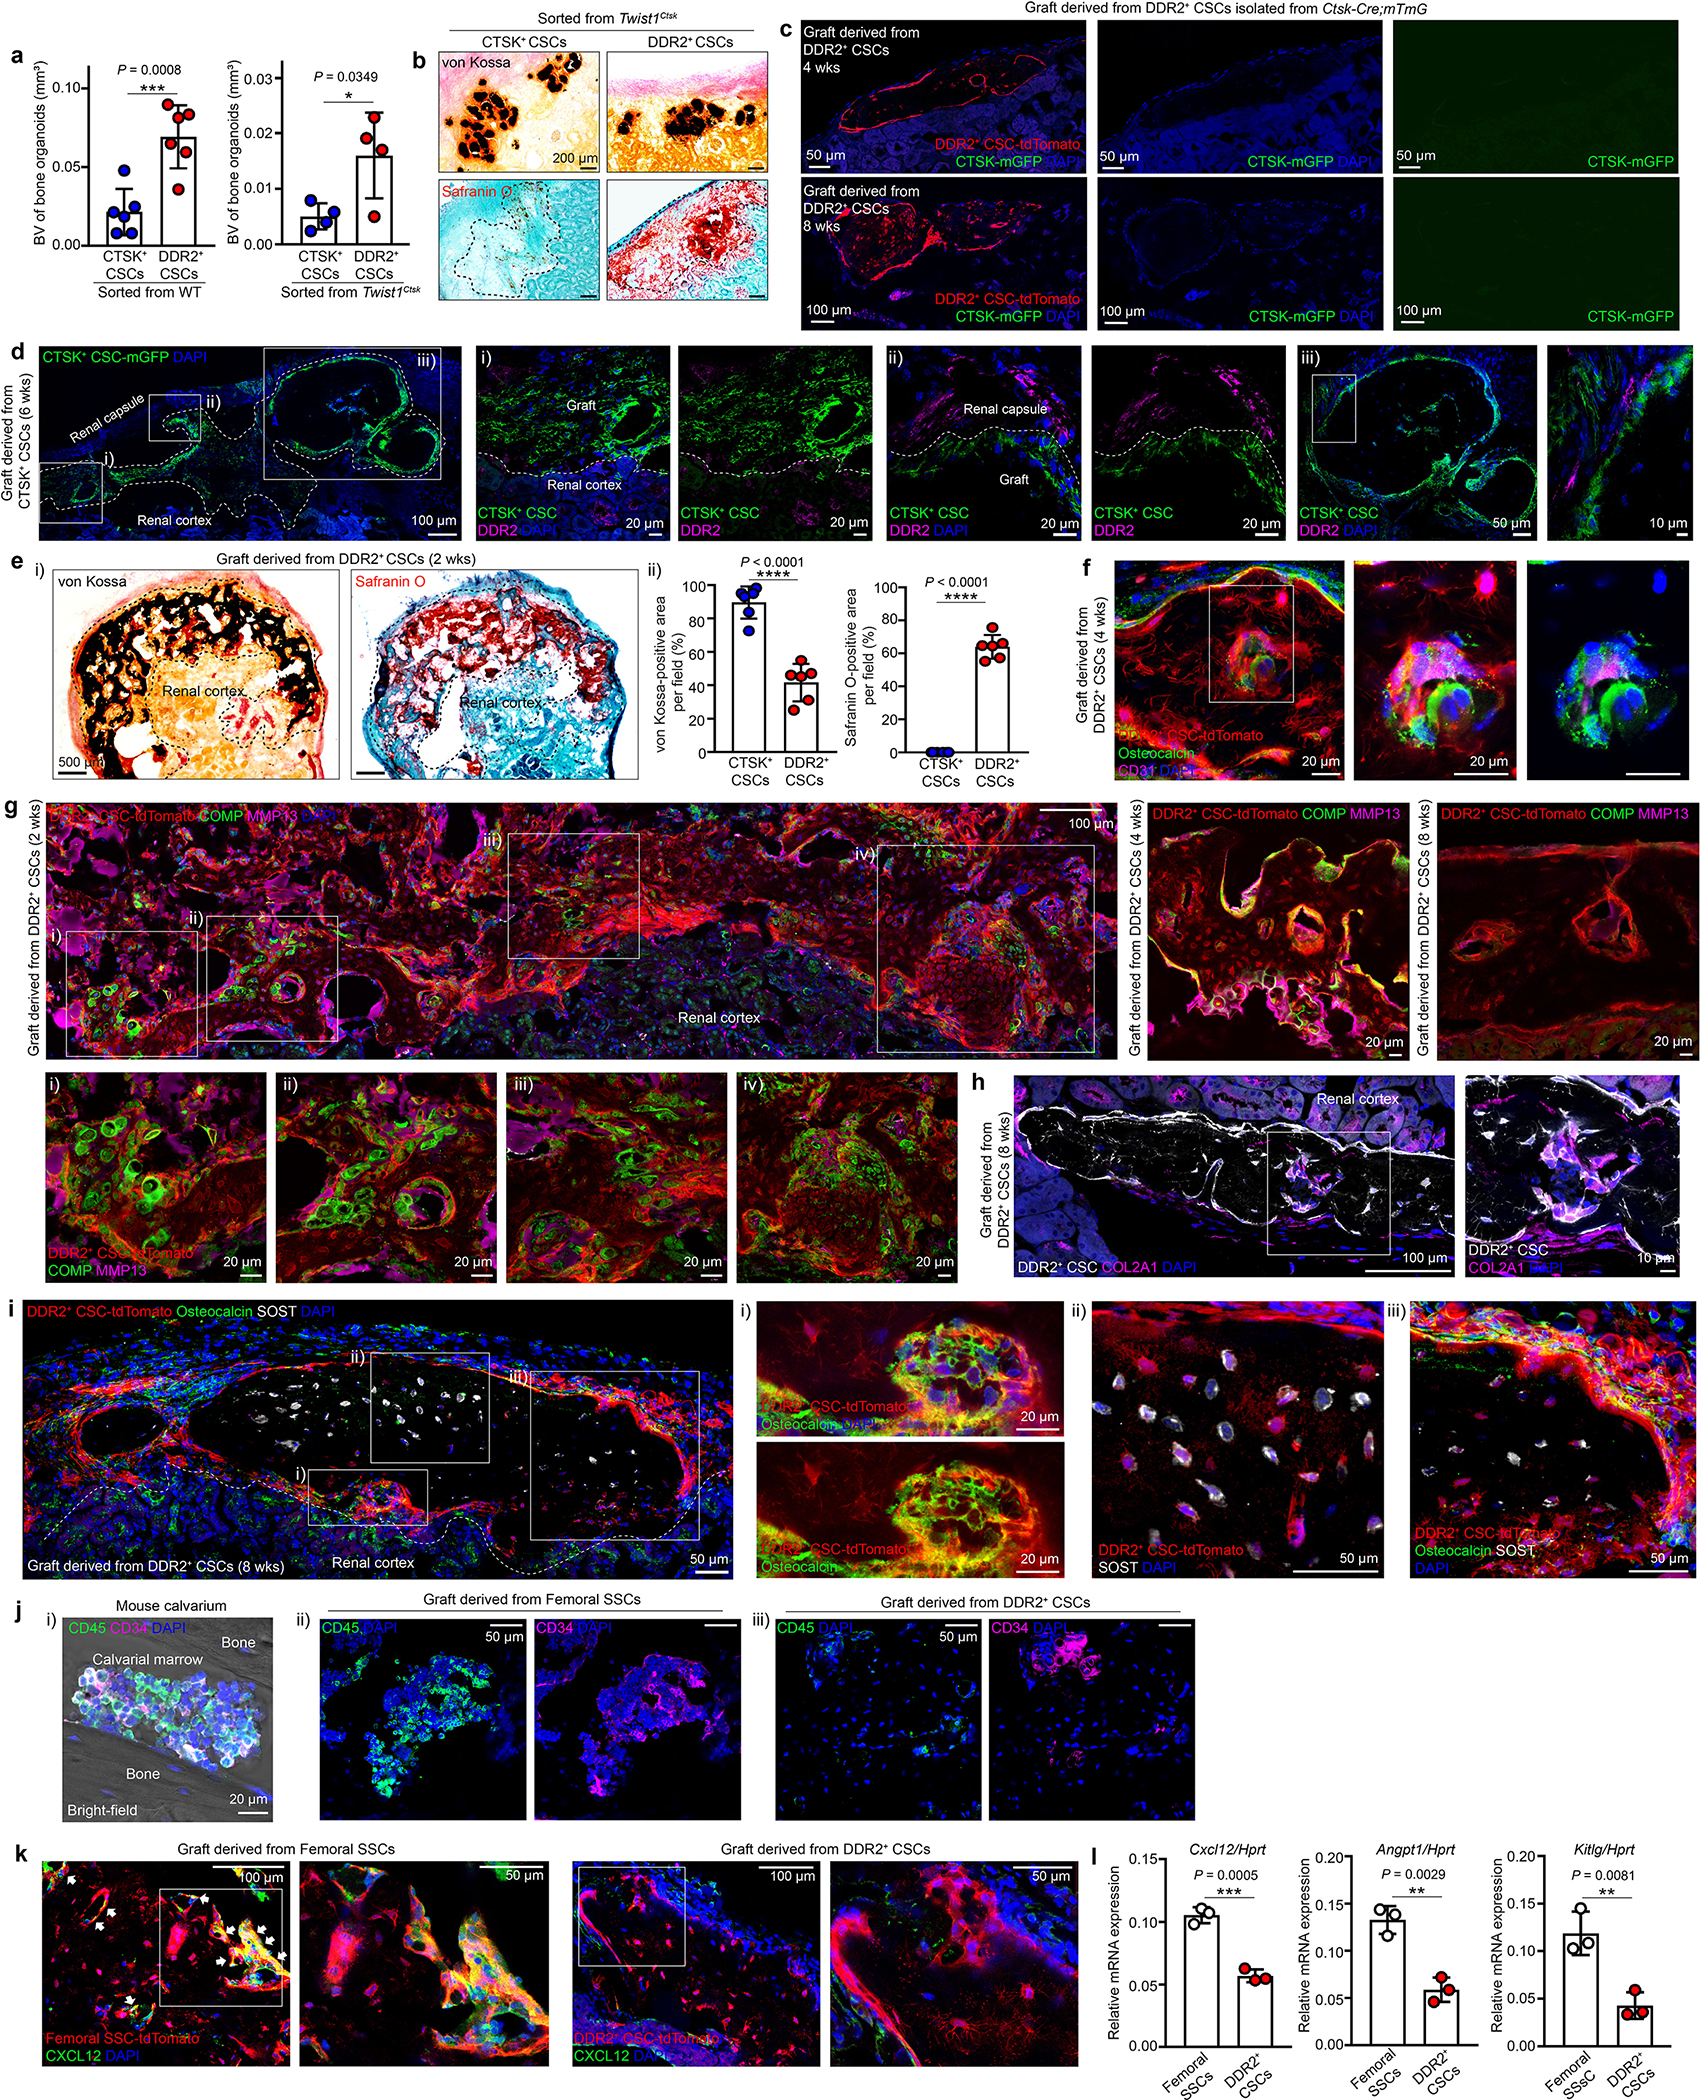
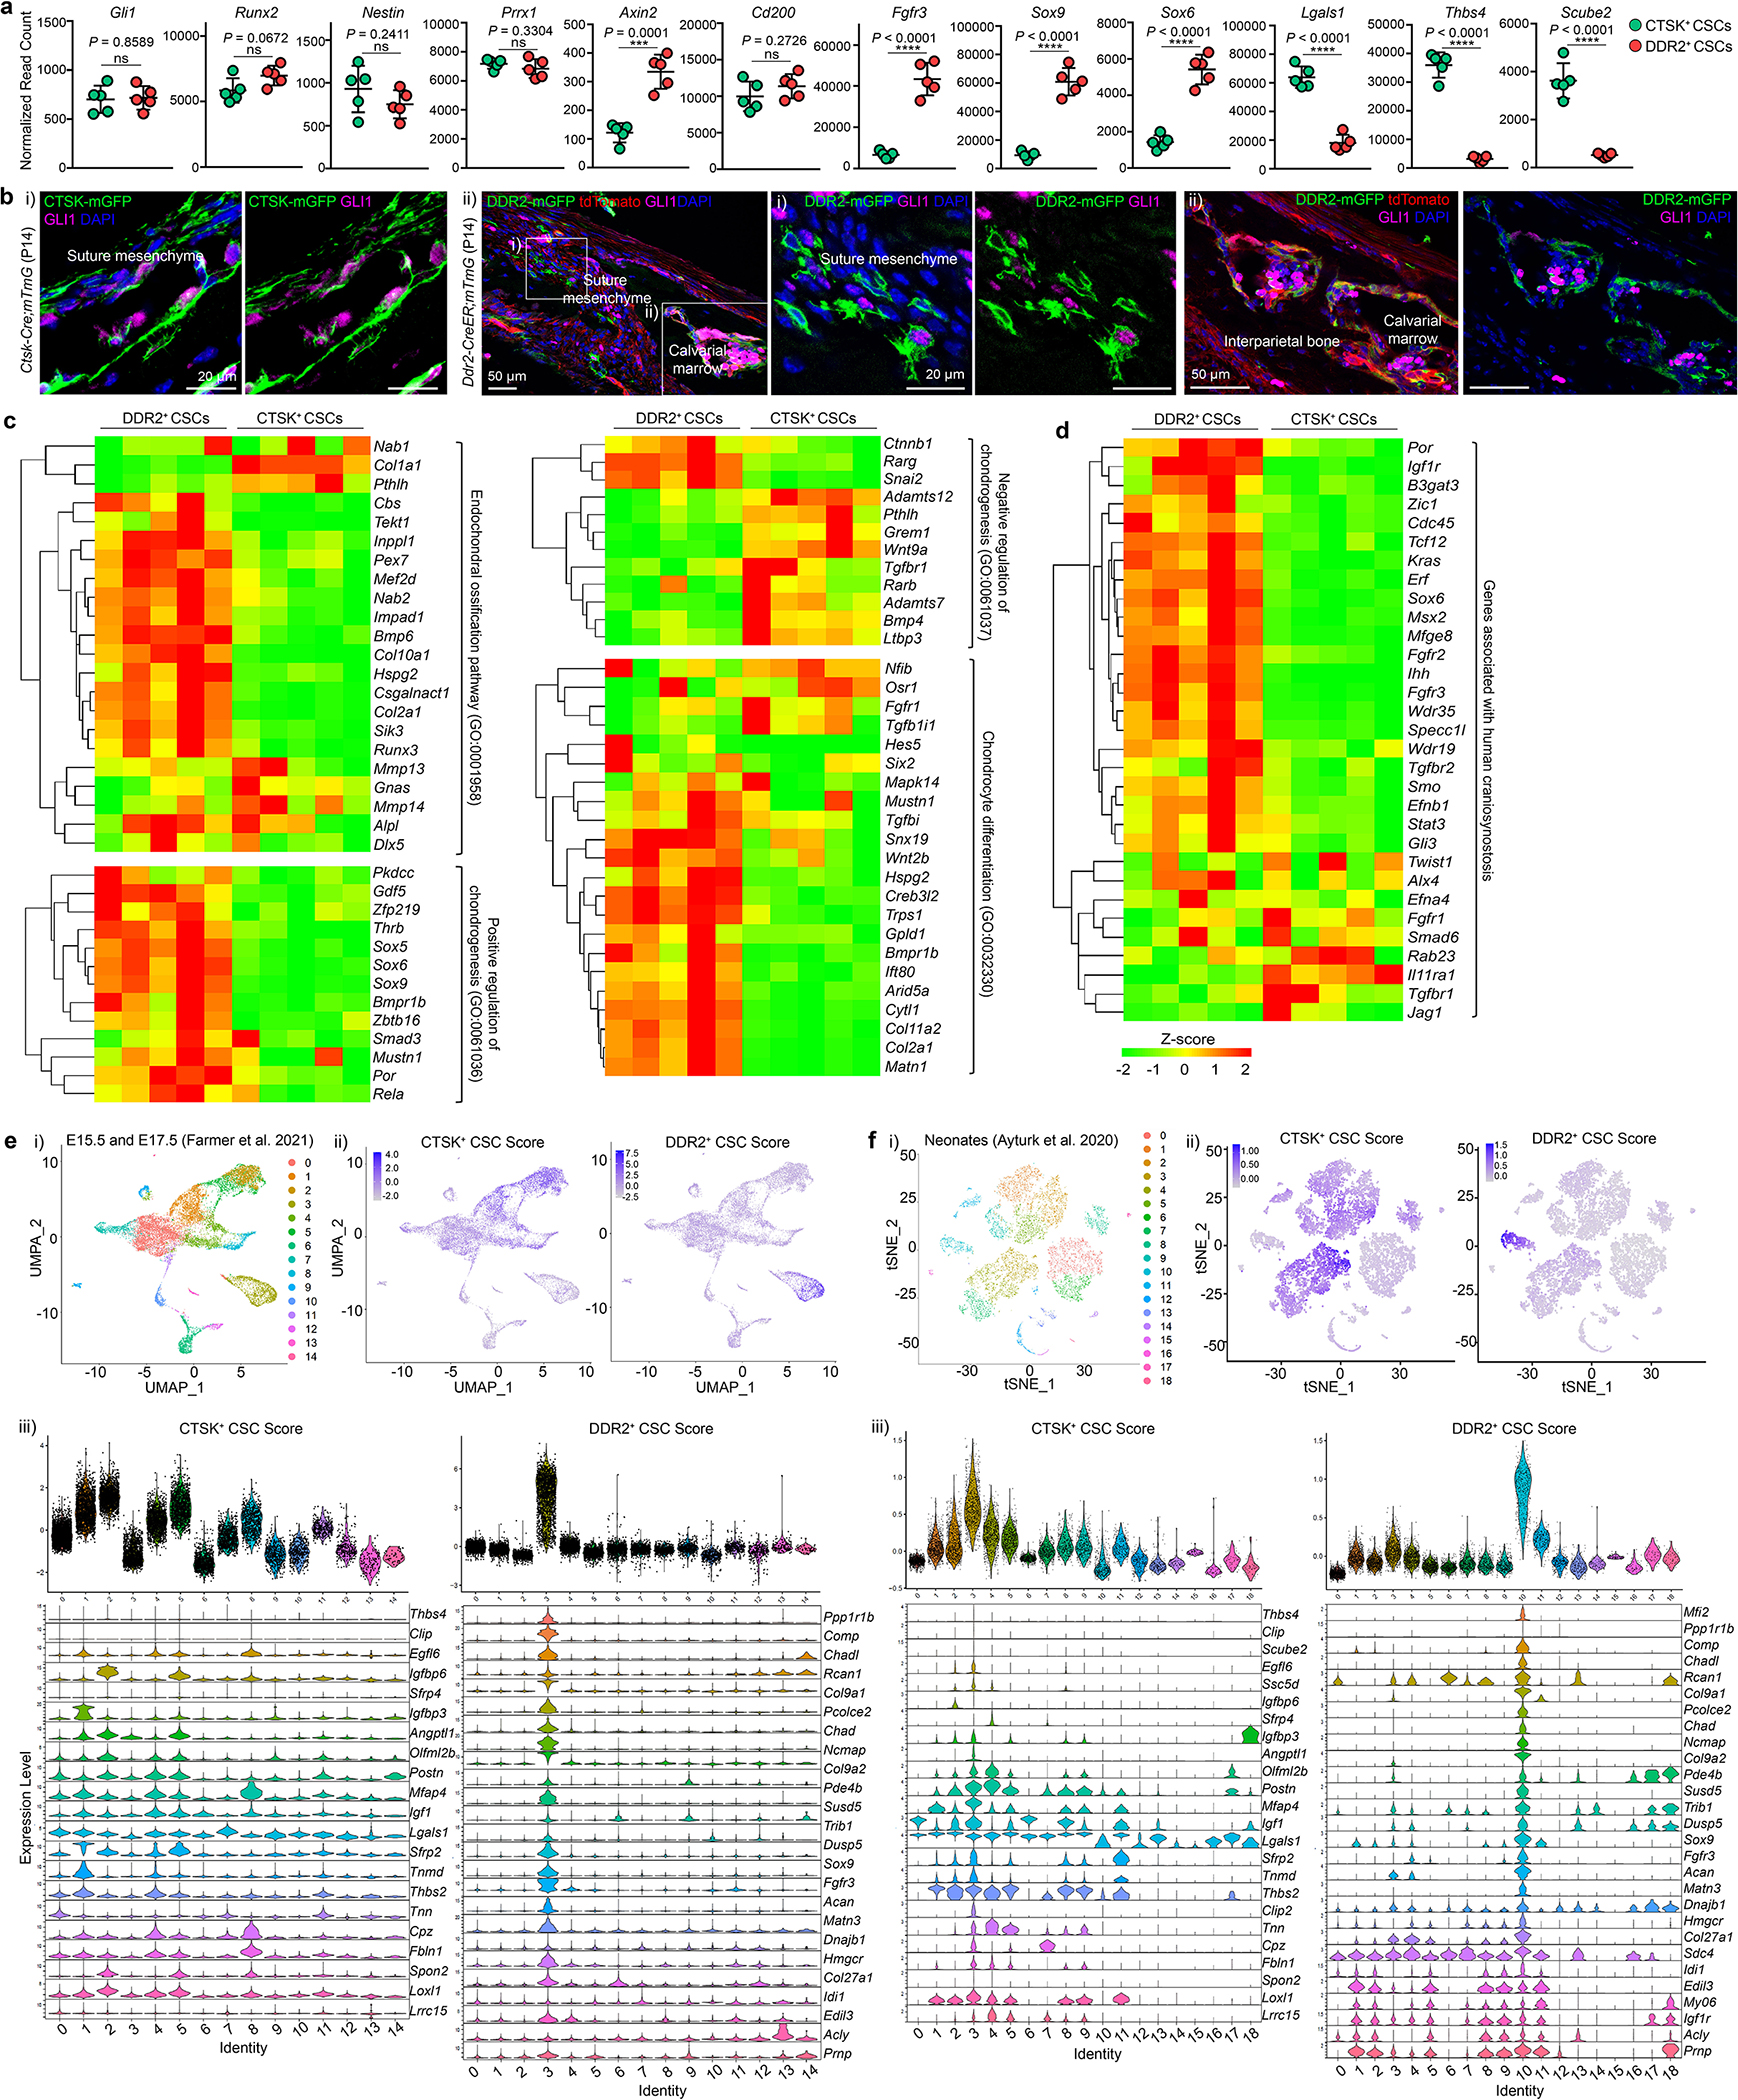
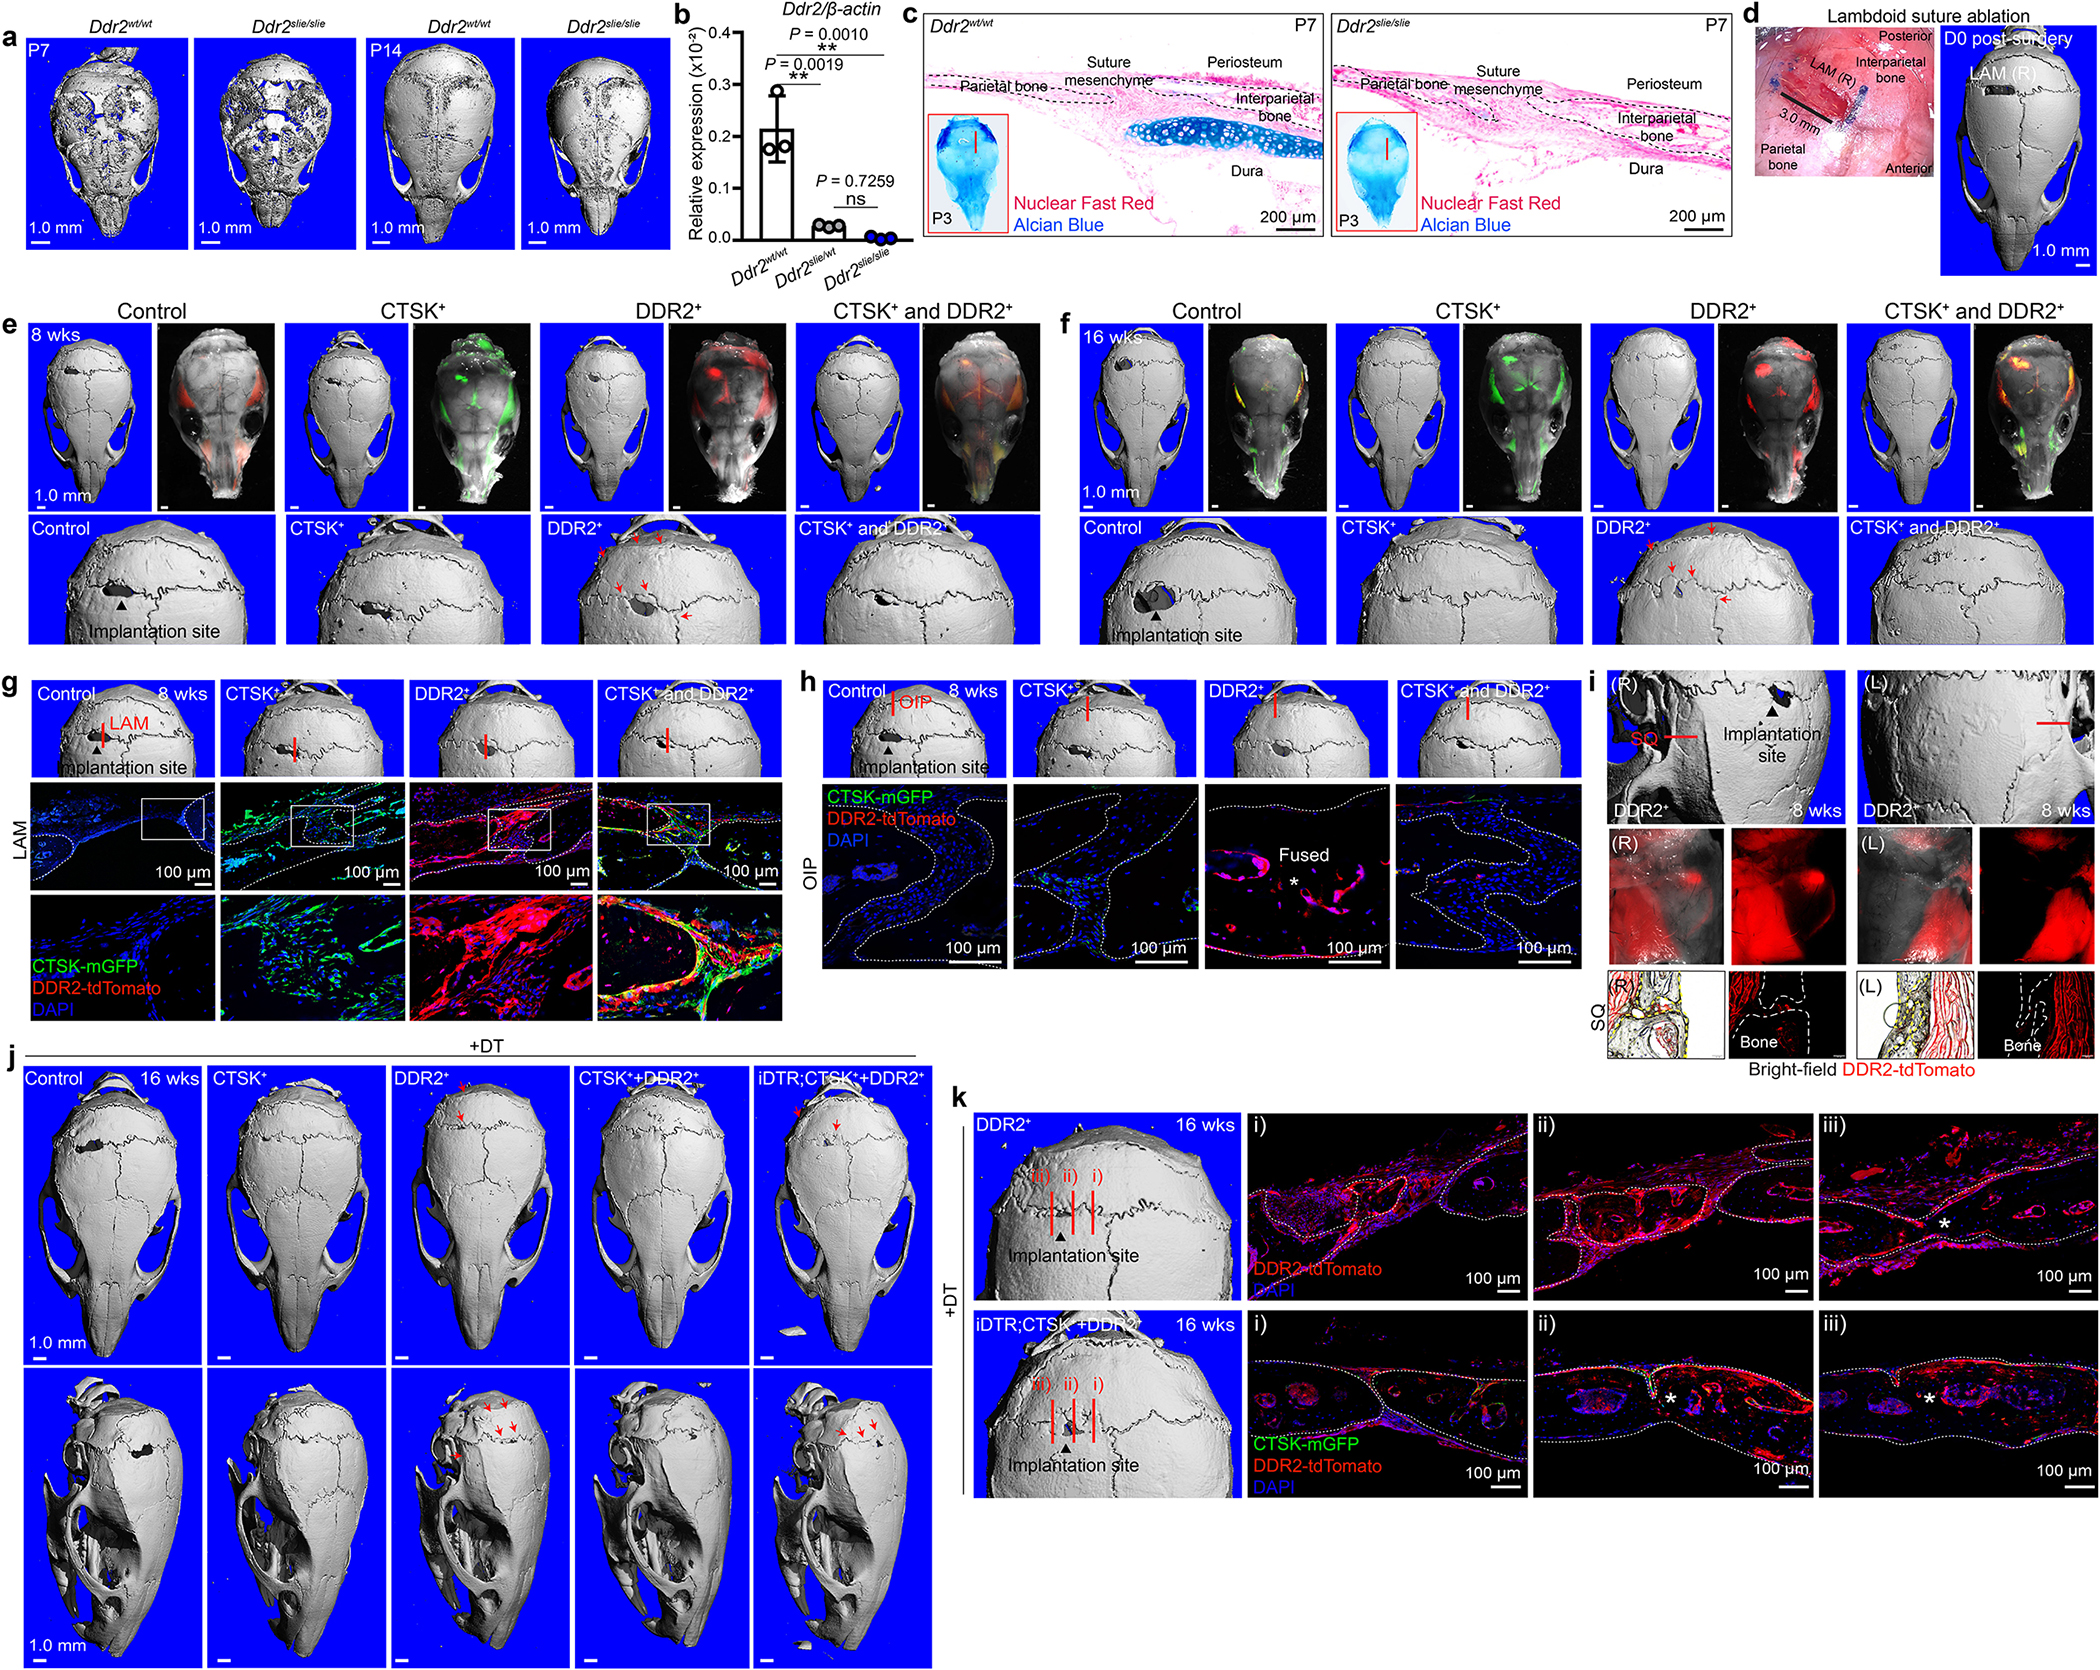
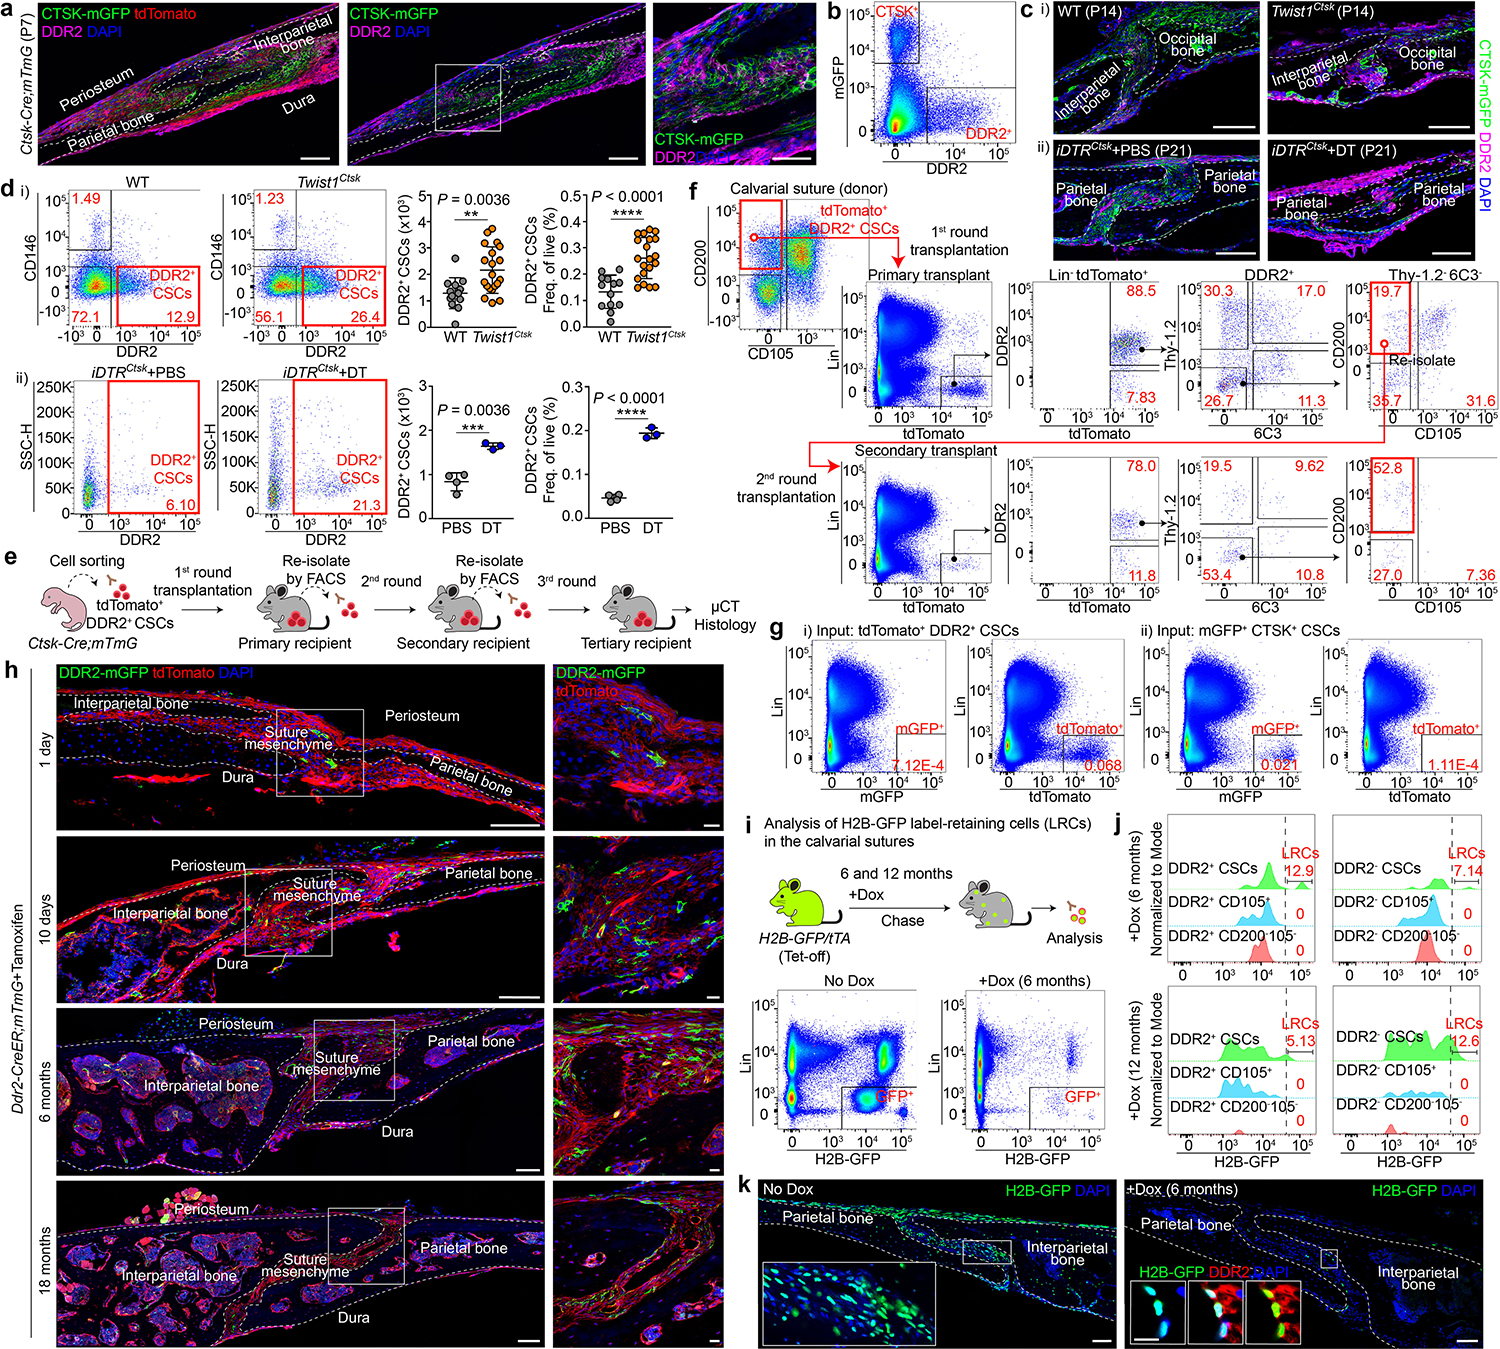
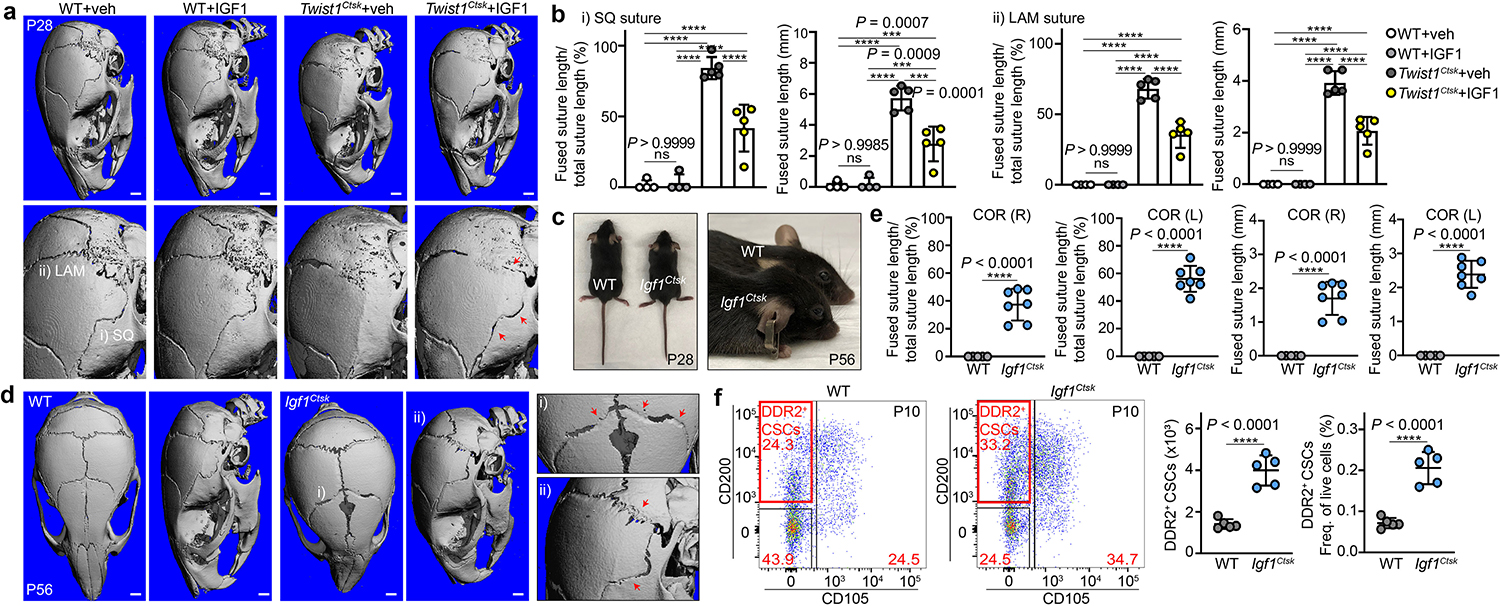
Craniosynostosis is a group of disorders of premature calvarial suture fusion. The identity of the calvarial stem cells (CSCs) that produce fusion-driving osteoblasts in craniosynostosis remains poorly understood. Here we show that both physiologic calvarial mineralization and pathologic calvarial fusion in craniosynostosis reflect the interaction of two separate stem cell lineages; a previously identified cathepsin K (CTSK) lineage CSC1 (CTSK+ CSC) and a separate discoidin domain-containing receptor 2 (DDR2) lineage stem cell (DDR2+ CSC) that we identified in this study. Deletion of Twist1, a gene associated with craniosynostosis in humans2,3, solely in CTSK+ CSCs is sufficient to drive craniosynostosis in mice, but the sites that are destined to fuse exhibit an unexpected depletion of CTSK+ CSCs and a corresponding expansion of DDR2+ CSCs, with DDR2+ CSC expansion being a direct maladaptive response to CTSK+ CSC depletion. DDR2+ CSCs display full stemness features, and our results establish the presence of two distinct stem cell lineages in the sutures, with both populations contributing to physiologic calvarial mineralization. DDR2+ CSCs mediate a distinct form of endochondral ossification without the typical haematopoietic marrow formation. Implantation of DDR2+ CSCs into suture sites is sufficient to induce fusion, and this phenotype was prevented by co-transplantation of CTSK+ CSCs. Finally, the human counterparts of DDR2+ CSCs and CTSK+ CSCs display conserved functional properties in xenograft assays. The interaction between these two stem cell populations provides a new biologic interface for the modulation of calvarial mineralization and suture patency.


Conflict of interest statement

Competing interest declaration The authors declare no competing interests.

Figures

Extended Data Fig. 1 |
Extended Data Fig. 1 |. Analysis of skeletal CTSK lineage cells in the calvarial sutures of wildtype (WT) and Twist1Ctsk mice.
a, μCT images of the skulls of WT and Twist1Ctsk mice (P0 WT, n=6 Twist1Ctsk, n=8; P7 WT, n=8 Twist1Ctsk, n=5; P14 WT, n=6 Twist1Ctsk, n=6; P21 WT, n=6 Twist1Ctsk, n=5; P56 WT, n=9 Twist1Ctsk n=6). Twist1Ctsk mice display 100% penetrance of fusion at the squamous (SQ), occipitointerparietal (OIP), and lambdoid (LAM) sutures from 14 days of age and onwards. Partial penetrance of coronal (COR) suture fusion (16–40%) is observed. b, H&E images of the OIP suture in WT and Twist1Ctsk mice at P21. The black arrow indicates the fused suture. c, Fluorescence images of the major sutures including the Interfrontal (IF), coronal (COR), sagittal (SAG), and lambdoid (LAM) sutures in WT (Twist1+/+;Ctsk-Cre;mTmG) and Twist1Ctsk (Twist1fl/fl;Ctsk-Cre;mTmG) mice at P21. d, FACS plots (left) and absolute and relative quantification (right) of the amount of skeletal CTSK lineage cells (CD31CD45Ter119CTSK-mGFP+) from the major sutures of WT (n=4) and Twist1Ctsk (n=4) mice at P14. Lin indicates CD31, CD45, and Ter119 for all FACS analyses. e, FACS plots and absolute cell number of the skeletal CTSK lineage cells from the calvarial sutures of WT (n=4) and Twist1Ctsk (n=4) mice at E16.5. f, FACS plots (left) and absolute and relative quantification (right) of apoptotic cells within the skeletal CTSK lineage cells from the sutures of WT (n=3) and Twist1Ctsk (n=3) mice at P2. g, Gating strategy for FACS analysis of CTSK+ CSC and CTSK CSC populations in the sutures of WT (Ctsk-Cre;mTmG) mice. h, Twist1 gene expression levels in FACS-isolated CTSK+ CSCs and CTSK lineage cells of WT (n=3) and Twist1Ctsk (n=3) mice as determined by RT-PCR. QuantStudio 6 Flex RT-PCR Software v1.3 was used for mRNA analysis. i, FACS analysis of the frequency of cell populations in the calvarial suture. i) CTSK+ CSCs and CTSK putative CSCs (CTSK pCSCs) relative to total skeletal lineage cells in the sutures of WT (n=12) and Twist1Ctsk;mTmG (n=17) mice. ii) Absolute and relative quantification of the amount of CTSK+ PP1 (LinThy-1.26C3CTSK+CD200CD105) and PP2 (LinThy-1.26C3CTSK+CD105+) populations in the sutures of WT (n=7) and Twist1Ctsk;mTmG (n=9) mice. j, Images of immunostaining for Ki-67 of the LAM sutures in WT (n=3) and Twist1Ctsk;mTmG (n=3) mice at P10. Quantification of the number of tdTomato and Ki-67 double-positive cells per high power field in the LAM and OIP sutures (bottom). k, Confocal fluorescence imaging for Osteocalcin (OCN) staining of the COR (i) and LAM sutures (ii) in WT and Twist1Ctsk;mTmG mice. Two regions in the LAM sutures from each group (n=4) were measured for quantification. l, Confocal immunofluorescence imaging for hallmarks of active endochondral ossification including staining for osteoclasts (TRAP), chondrocytes (COL2A1, COMP), molecular mediators of endochondral ossification (MMP13), markers of hypertrophic chondrocyte apoptosis (Cleaved Caspase-3 (CC3)), and vascular invasion (CD31) in consecutive slices of the OIP sutures of Twist1Ctsk;mTmG mice at P7. The insets show high magnification of the region demonstrating that sutural cartilage templates derived from non-CTSK lineage cells in Twist1Ctsk mice. m, n, Timecourse Safranin O staining (red) and representative low-power (i) and high-power (ii) images of the OIP (m) and LAM (n) sutures in WT (n=3) and Twist1Ctsk (n=3) mice. In the OIP and LAM sutures, the penetrance of this sutural endochondral ossification phenotype is 100% in Twist1Ctsk;mTmG mice at P10. Far-right, enlarged view of the box in each panel. Each of dots shown in the graph represents an individual mouse. ****P < 0.0001, P values are shown. Mean ± s.d., unpaired, two-tailed Student’s t-test (d, e, h-k), two-way ANOVA with Sidak’s corrections for multiple comparisons test (f). All images and FACS plots are representative of at least three independent experiments. Scale bars are denoted in images.
Extended Data Fig. 2 |
Extended Data Fig. 2 |. In vivo depletion of CTSK+ cells using an inducible DTR (iDTR) system.
a, Schematic representation of the experimental design and gross appearance of ROSA26iDTR and iDTRCtsk mice before and after DT administration. The red arrow in image indicates an abnormal dome-shaped skull. b, Immunostaining for Cleaved Caspased-3 (CC3) in the sutures of iDTRCtsk;mTmG mice with PBS or DT. n=3 independent experiments. Green, CTSK+ (mGFP) cells; Red, non-CTSK lineage (tdTomato) cells; Magenta, CC3. Far-right, enlarged view of the box. c, FACS analysis of the absolute amount of CTSK+ cells and CTSK pCSCs in the sutures of iDTRCtsk mice with PBS (n=4) or DT (n=4) administration (i). Normalized absolute quantification of the indicated cell types by analyzing the same number of cells passing the FSC/SSC, doublet, and live gates in all specimens (ii). d, μCT scan 3D images of the skull of ROSA26iDTR and iDTRCtsk mice at P11, P21, and P35 after DT administration. Red arrows indicate suture defects including abnormal fusion and hypomineralization (ROSA26iDTR, n=5; iDTRCtsk, n=5). e, μCT scan 2D images of the skull with an enlarged view of the region outlined in blue of ROSA26iDTR and iDTRCtsk mice at P21 and P35. f, Confocal immunofluorescence images of Ki-67 and quantification of the number of tdTomato and Ki-67 double-positive cells per high-power field of the OIP and LAM sutures in iDTRCtsk;mTmG mice at P14 after PBS (n=3) or DT (n=3) administration. Dots in graphs represent an individual mouse. g-i, Representative μCT images of the cortical (g), trabecular bone (h), and tibias (i) in ROSA26iDTR and iDTRCtsk mice after DT administration. Arrows show cortical defects including uneven periosteal surfaces and a double cortex. Quantification of bone volume/total volume (BV/TV), trabecular number (Tb.N), trabecular thickness (Tb.Th), and trabecular separation (Tb.Sp) of trabecular bones in ROSA26iDTR (n=4) and iDTRCtsk (n=4) mice at P21 after DT administration (h). j, Representative confocal fluorescent images of CTSK-expressing osteoclasts in iDTRCtsk;mTmG mice at P35 after PBS or DT administration. Red arrows indicate CTSK+ osteoclasts in the interparietal bones. Quantification of the number of osteoclasts per high-power field (HPF) of the sutures iDTRCtsk;mTmG mice after PBS or DT administration. Two or three regions from each group (n=3) were measured for quantification. k, Experimental scheme for functional inhibition of osteoclast activity using alendronate (1 mg/kg) and μCT scan images of the long bones and skulls of C57BL/6J mice at P42 after alendronate treatment. (Vehicle (PBS), n=3; Alendronate, n=5). ****P < 0.0001, P values are shown. Mean ± s.d., unpaired, two-tailed Student’s t-test (c, f, h, j). All images and FACS plots are representative of at least three independent experiments. Scale bars are denoted in images.
Extended Data Fig. 3 |
Extended Data Fig. 3 |. Characterization of DDR2+ CSCs.
a, b, Candidate cell surface markers from gene expression analysis of FACS-purified CTSK+ CSC and CTSK pCSC populations determined by RNA-Seq. c, Ddr2 mRNA expression in FACS-isolated CTSK pCSCs of WT (n=6) and Twist1Ctsk (n=6) mice analyzed by RT-PCR. d, Immunostaining for candidate cell surface markers including NGFR (CD271), NCAM1 (CD56), PDGFRα (CD140α), and MCAM (CD146) in the calvarial suture of Ctsk-Cre;mTmG mice at P7. Experiments were repeated 3 independent times. e, Flow cytometry for CD271, CD140α, and CD146 versus CTSK lineage cells in the calvarial sutures. f, Immunofluorescence staining for CD146 and Endomucin (EMCN) in the calvarial sutures. g, μCT 3D images of the bone formed by CD146+ (left) and DDR2+CD146 (right) populations isolated from the pool of CTSK pCSCs 6 weeks after transplantation. Images are representative of 3 independent experiments. h, Immunostaining for DDR2 in the OIP (i) and LAM (ii) sutures of WT and Twist1Ctsk;mTmG mice at P14. i, Flow cytometry gating strategy for CTSK-negative DDR2+ CSCs in the calvarial sutures of P7 Ctsk-Cre;mTmG mice. Black arrows indicate parent/daughter gates. j, Flow cytometry analysis of the percentage of CD51+ cells within CTSK pCSC, CTSK+ CSC, and DDR2+ CSC populations (n=4). k, Quantification of the percentage of DDR2+ CSCs within the pool of the CTSK putative stem cell fraction in the sutures of WT (n=5) and Twist1Ctsk;mTmG (n=5) mice as determined by flow cytometry. l, FACS plots showing skeletal DDR2+ cells (i) and DDR2+ CSCs (ii) in the sutures of WT, Twist1Ctsk, and Twist1+/− mice at P12. ****P < 0.0001, P values are shown. Mean ± s.d., unpaired, two-tailed Student’s t-test (c, k). Images in d, f, h are representative of a minimum of three biological replicates, and FACS plots are representative of three independent experiments. Scale bars are denoted in images.
Extended Data Fig. 4 |
Extended Data Fig. 4 |. Determination of the stemness and differentiation hierarchy of DDR2+ CSCs.
a, Fluorescence images of a timecourse of single cell-derived clonal expansion in FACS-purified CTSK+ CSCs and DDR2+ CSCs isolated from Ctsk-Cre;mTmG mice (i) and no induction of Ctsk-Cre driven mGFP was observed in DDR2+ CSCs (ii). b, Alcian Blue (i), Alizarin Red S (ii), and Oil Red O (iii) staining for in vitro clonal multipotency. 10 single FACS-isolated CTSK+ CSCs or DDR2+ CSCs were expanded and able to undergo both osteoblast and adipocyte differentiation. All cells were derived from the expansion of a single FACS-isolated CTSK+ CSC or DDR2+ CSC. Bar graphs show the clonal efficiency demonstrating that all colonies were capable of both osteoblasts and adipocytes differentiation from the same clone of cells. 10 colonies were examined in triplicate experiments. c, Images showing the fibroblast colony-forming units (CFU-F) derived from FACS-isolated CTSK+ CSCs or DDR2+ CSCs. The number of CFU-F colonies per well was quantified at day 10 after seeding (n=5 single FACS-isolated CTSK+ CSCs or DDR2+ CSCs). d, In vitro limiting dilution analysis and CFU-F formation. Dilutions of 500, 200, 100, 50, 20, and 10 CTSK+ CSC or DDR2+ CSCs were seeded onto 6-well culture plates. e, Clonal expansion and differentiation into osteoblasts in FACS-isolated CTSK+ CSCs and DDR2+ CSCs. Colonies were stained for Alizarin Red S at day 28. The number of CFU-Ob colonies per well was quantified (n=6 single FACS-isolated CTSK+ CSCs or DDR2+ CSCs). f, Bright-field and fluorescent images of initial seeded, primary, secondary, and tertiary mesenspheres derived from CTSK+ CSCs (GFP, green), DDR2+ CSCs (RFP, red), and non-stem fraction of calvarial cells (Thy-1.2+ here) in CTSK+ or DDR2 lineage isolated from Ctsk-Cre;mTmG mice. g, Quantification of individual cell numbers per sphere (top) and the percentage of cells able to form spheres (bottom) for CTSK+ CSCs, DDR2+ CSCs, CTSK+Thy-1.2+, and DDR2+Thy-1.2+ cells. n=3 independent experiments. h, Experimental strategy for in vivo stemness and differentiation hierarchy study and gating strategy showing serially transplanted cell populations including DDR2+ CSCs (i), DDR2+Thy-1.26C3CD200variableCD105+ (ii), DDR2+Thy-1.26C3CD200CD105 (iii), and DDR2+Thy-1.2+6C3 (iv) of the calvarial suture of the primary donor (Ctsk-Cre;mTmG mice). Freshly FACS-isolated 2 to 3×10⁴ cells were transplanted into the muscle of primary recipients. i, FACS analysis of serially transplanted cells derived from ii), iii), and iv) populations after the first and second rounds of intramuscular transplantation. 1 to 3×10³ cells after the first round of transplantation were re-isolated and re-implanted into the muscle of secondary recipients. FACS plots marked by black boxes show differentiation of the indicated populations after the first round of transplantation and plots marked by red boxes show these populations in secondary recipients after the second round of transplantation. Black and red arrows indicate parent/daughter gates and transplanted populations, respectively. Experiments underwent 5 independent repeats. j, μCT images of bone formation from transplanted CTSK+ CSCs and DDR2+ CSCs under the renal capsule of recipients after each round of serial transplantation. The number of transplanted cells is indicated in images. k, FACS plots of tdTomato-expressing DDR2+ CSC and mGFP-expressing CTSK+ CSC populations isolated from Ctsk-Cre;mTmG mice after the first round of transplantation. Collagen sponges without cells were used as a negative control. l, FACS plots demonstrating that CTSK+ CSCs did not induce expression of DDR2 over the course of serial transplantation and that CTSK+ CSCs were capable of self-renewal and generating the entire lineage of CTSK lineage cells present in initial donors after the first round of transplantation. ****P < 0.0001, P values are shown. Mean ± s.d., unpaired, two-tailed Student’s t-test (c, d), two-way ANOVA with Tukey’s multiple comparisons test (g). Images in a-f, j are representative of a minimum of three biological replicates, and FACS plots are representative of at least three independent experiments. Scale bars are denoted in images.
Extended Data Fig. 5 |
Extended Data Fig. 5 |. Long-term lineage tracing and label-retention studies in the calvarial suture.
a, Experimental design for lineage tracing of tamoxifen (TAM)-induced Ddr2-CreER;mTmG mice pulsed at P2. b, Confocal fluorescence imaging of the calvarial suture in Ddr2-CreER;mTmG mice before TAM induction. c, Short-term chase of calvarial DDR2 lineage cells in the area of lambdoid sutures in Ddr2-CreER;mTmG mice. Low-power (top) and high-power images (bottom) of the suture mesenchyme, calvarial bone, and marrow showing DDR2 lineage sutural resident cells and bone-adjacent osteoblasts 10 days after an initial pulse. Green, DDR2 lineage (mGFP) cells; Red, non-DDR2 lineage (tdTomato) cells; Blue, DAPI. d, e, Long-term chase for 6 (d) or 18 months (e) to visualize calvarial DDR2 lineage cells in Ddr2-CreER;mTmG mice. f, Timecourse fluorescence imaging of osteoblasts (i) and CD200-expressing cells (ii) derived from DDR2 lineage cells (green) in the lambdoid sutures of Ddr2-CreER;mTmG mice. g, Flow cytometry plot showing the concordance between DDR2 antibody staining and Ddr2-CreER pulse-chase studies in calvarial-lineage cells. In addition to DDR2 expression on skeletal cells, expression of DDR2 in subsets of Lineage+ leukocytes is noted. h, FACS analysis of genetic lineage tracing of DDR2 lineage cells in the calvarial sutures of Ddr2-CreER;mTmG mice. Red boxes indicate calvarial DDR2+ fractions (upper panel) and DDR2+ CSCs (LinDDR2-mGFP+ Thy1.26C3CD200+CD105, lower panel). i, Percentage of DDR2 ineage cell types including DDR2+ CSCs, DDR2+CD200varialbeCD105+, and DDR2+CD200CD105 cells within the parent gate (LinDDR2+Thy-1.26C3 cells) 1 day (n=5), 10 days (n=6), 1 month (n=6), 3 months (n=5), and 12 months (n=7) after TAM induction in the calvarial sutures as determined by FACS. j, FACS quantification of genetic lineage tracing for DDR2 lineage cells in the calvarial sutures of Ddr2-CreER;mTmG mice 1 day (n=5), 10 days (n=6), 1 month (n=6), 3 months (n=5), and 12 months (n=7) after TAM administration. The relative and absolute amount of calvarial DDR2 lineage cells from the pool of total lineage-negative cells over a chase period in i and ii. The amount of specific DDR2 lineage cell types including DDR2+ CSCs, DDR2+CD200varialbeCD105+, DDR2+CD200CD105, DDR2+Thy-1.2+, and DDR2+6C3+ cells over the chase period is provided in iii. k, Flow cytometry plot showing H2B-GFP baseline expression in the calvarial sutures in the absence of doxycycline (dox). l, Plots showing H2B-GFP+ cells at baseline without dox exposure (i), H2B-GFPhigh label-retaining calvarial sutural cells exposed to dox over 6 months (ii). Plots for additional control mice that were continuously exposed to dox demonstrating a negligible level of H2B-GFP expression and no expression of DDR2 (iii). Black arrows indicate parent/daughter gates. m, FACS quantification of the absolute and relative amount of skeletal H2B-GFPhigh labeling in the calvarial sutures after dox exposure (H2B/tTA, n=7). Controls of mice that were continuously exposed to dox (tTA, n=2; H2B, n=2; H2B/tTA, n=5), including during the embryonic period by providing dox to pregnant female mice, continuing dox exposure while pups were breastfeeding and then subsequently continuing direct dox exposure after weaning. Freq, frequency. n, o, Gating strategy for H2B-GFPhigh label-retaining cells within DDR2+ CSC and DDR2 CSC populations and offset histogram overlays displaying GFP fluorescence in LinThy-1.26C3DDR2+ or DDR2 populations including CD200+CD105 (CSC), CD200variableCD105+, and CD200CD105 after 6 (i) or 12 month (ii) chase periods. Black arrows indicate parent/daughter gates. p, Representative images (left) and quantification (right) of immunostaining for Galectin-1 (Gal-1) overlapping with CTSK+ (mGFP) cells in Ctsk-Cre;mTmG mouse calvarium at P14 (n=5). Green, CTSK+ (mGFP) cells; Magenta, Galectin-1; Blue, DAPI. A relative amount of Galectin-1+ cells overlapping with CTSK+ (mGFP) or non-CTSK lineage (tdTomato) cells was quantified per high power field. q, Representative immunostaining images for Galectin-1 in the calvarial sutures of H2B-GFP mice after 12 months of dox exposure. Co-localization is shown by white arrows. Green, H2B-GFP; Red, Galectin-1; Blue, DAPI. Each of dots shown in the graph represents an individual mouse. ****P < 0.0001, P values are shown. Mean ± s.d., two-tailed Student’s t-test (p), one-way ANOVA with Tukey’s multiple comparisons test (j, m). Images in b-f, p, q and FACS plots are representative of at least three independent experiments. Scale bars are denoted in images.
Extended Data Fig. 6 |
Extended Data Fig. 6 |. Functional characterization of DDR2+ CSCs.
a, Quantification of bone volume (BV) when equal numbers of CTSK+ CSCs and DDR2+ CSCs were individually isolated from WT (left, n=6) or Twist1Ctsk (right, n=6) mice 4 weeks after transplantation. Each of dots shown in the graph represents an individual graft. b, Representative images of von Kossa staining (top, black) for mineralized bone and Safranin O staining (bottom, red) for cartilage in adjacent serial sections from renal capsule bone organoids derived from CTSK+ CSCs and DDR2+ CSCs isolated from Twist1Ctsk mice 4 weeks after transplantation. c, Fluorescence images of grafts derived from DDR2+ CSCs (red) isolated from Ctsk-Cre;mTmG mice by FACS 4 or 8 weeks after transplantation into the renal capsule of secondary recipients. Green, CTSK+ mGFP; Red, Primary graft (DDR2+ CSCs); Blue, DAPI. d, Representative immunostaining images for DDR2 (magenta) in the graft 6 weeks after transplantation of CTSK+ CSCs (green) into the renal capsule. e, Images of von Kossa and Safranin O staining in the adjacent serial sections of the same renal capsule bone organoid grafts derived from CTSK+ CSC or DDR2+ CSCs 2 weeks after transplantation (i). Quantification of the area of von Kossa and Safranin O staining is provided in ii. f-i, Endochondral ossification with active cartilage remodeling is seen in the grafts derived from DDR2+ CSCs (red) via immunostaining for Osteocalcin (green) and CD31 (magenta) 4 weeks after transplantation (f), COMP (green) and MMP13 (magenta) 2, 4, and 8 weeks after implantation (g), DDR2+ CSCs and their derivatives (white) and COL2A1 (magenta) (h), Osteocalcin (green) and SOST (white) at 8 weeks post-transplantation (i) into the renal capsules of primary recipients. Higher magnification images are provided with the corresponding Roman numerals. j, k, Endochondral ossification without recruitment of hematopoietic elements in DDR2+ CSC-derived bone organoids: Immunostaining for hematopoietic cells with CD45 (green) and CD34 (magenta) in mouse calvarium at P21 (i), grafts derived from freshly sorted femoral skeletal stem cells (SSCs) (ii), or DDR2+ CSCs (iii) (j). Immunostaining for CXCL12 (green) in the grafts derived from femoral skeletal stem cells (SSCs, red) (left) or DDR2+ CSCs (red) (right) (k) 4 weeks after the renal capsule transplantation. Co-localization is shown by white arrows. l, RT-PCR analysis of hematopoietic niche factors including Cxcl12, Angpt1, and Kitlg in FACS-isolated femoral SSCs (n=3) and DDR2+ CSCs (n=3). Each of dots shown in the graph represents the cells of interest isolated from an individual mouse. ****P < 0.0001, P values are shown. Mean ± s.d., unpaired, two-tailed Student’s t-test (a, e (ii), l). All images shown in this figure are representative of a minimum of three independent experiments. Scale bars are included in microscopy images.
Extended Data Fig. 7 |
Extended Data Fig. 7 |. Transcriptional analysis of CTSK+ CSCs and DDR2+ CSCs isolated from mouse calvarial sutures.
a, Bar graphs showing normalized read counts of Gli1, Runx2, Nestin, Prrx1, Axin2, Cd200, Fgfr3, Sox9, Sox6, Lgals1, Thbs4, and Scube2 as determined by RNA-Seq analysis of FACS-isolated CTSK+ CSCs (n=5) and DDR2+ CSCs (n=5) in the calvarial suture at P7. ****P < 0.0001, P values are shown. Mean ± s.d., unpaired, two-tailed Student’s t-test. b, Immunostaining for GLI1 in the calvarial sutures of Ctsk-Cre;mTmG (i) and Ddr2-CreER;mTmG (ii) mice at P14. Green, CTSK+ (mGFP) (i); DDR2+ (mGFP) (ii); Magenta, GLI1; Blue, DAPI. Images represent the results of 3 independent experiments. Scale bars are included in microscopy images. c, Hierarchical clustering of expression heatmaps showing differentially expressed genes associated with bone development, including endochondral ossification (GO:0001958), positive or negative regulation of cartilage development (GO:0061036; GO:0061037, respectively), regulation of chondrocyte differentiation (GO:0032330) by Gene Ontology Biological Process analysis from RNA-Seq in FACS-purified CTSK+ CSCs and DDR2+ CSCs at P7. d, Heatmap generated from murine bulk RNA-Seq analysis of sorted CTSK+ CSCs and DDR2+ CSCs showing differentially expressed genes associated with human craniosynostosis. e, f, scRNA-Seq analysis using public datasets published by Farmer et al. 202154 (e) and Ayturk et al. 202055 (f). i) UMAP (e) and tSNE (f) plots of calvaria single cells. ii) Pseudocoloring of the corresponding UMAP (e) or tSNE (f) plots for the CTSK+ CSC and DDR2+ CSC combined gene expression score used to identify cells expressing a CTSK+ CSC-like or a DDR2+ CSC-like transcriptional profile. iii) Violin plots showing the per cluster CTSK+ CSC and DDR2+ CSC score, including normalized expression of selected genes comprising the CTSK+ CSC score (left) and the DDR2+ CSC score (right).
Extended Data Fig. 8 |
Extended Data Fig. 8 |. Analysis of Ddr2slie mice and orthotopic transplantation of calvarial stem cells.
a, μCT scan 3D images of the skull of Ddr2wt/wt (WT) and Ddr2slie/slie (Ddr2slie) mice at P7 and P14. (P7 WT, n=7 Ddr2slie, n=8; P14 WT, n=5 Ddr2slie, n=6). b, RT-PCR analysis of Ddr2 expression in Ddr2wt/wt (n=3), Ddr2slie/wt (n=3), and Ddr2slie/slie (n=3) mice. Each of dots shown in the graph represents an individual mouse. P values are shown. Mean ± s.d., one-way ANOVA with Tukey’s multiple comparisons test. c, Alcian Blue staining of the lambdoid sutures in WT and Ddr2slie mice at P7. Nuclear Fast Red was used as a counterstain. Red boxes images: whole-mount P3 skull preparations with Alcian Blue staining of WT (n=8) and Ddr2slie (n=9) mice. Red lines in images indicate the sectioning area and direction. d, Surgical field and μCT scan 3D image after ablation of the right lambdoid (LAM) suture in 4-week-old MIP-GFP mice. e, f, μCT scans and stereomicroscopic fluorescence images of mouse skulls at 8 (e) or 16 weeks (f) post-transplantation. mGFP-expressing CTSK+ CSCs and tdTomato-expressing DDR2+ CSCs isolated from the calvarial sutures of P7 to P10 Ctsk-Cre;mTmG mice. Each indicated population was implanted into the suture ablation area after carrier encapsulation. The control group was implanted with only the carrier gel mixture without cells. Red arrows in μCT images indicate the fusing and fused sutures. g-i, Confocal fluorescence imaging of graft cells, showing the presence of CTSK+ CSC (green) and DDR2+ CSC (red) graft cells both at the initial site of implantation (LAM, g) and migration of graft cells from the initial site of implantation to adjacent sutures (OIP, h; SQ, i) at 8 weeks post-transplantation. Each red line in μCT images indicates the sectioning area and direction. Asterisk in the image denotes site of suture fusion. j, 3D reconstruction of μCT scans of the skull 16 weeks after orthotopic transplantation with subsequent DT administration. (Control, n=6; CTSK+, n=6; DDR2+, n=5; CTSK+ and DDR2+, n=5; iDTR;CTSK+ and DDR2+, n=4). Red arrows indicate the fusing and fused sutures. k, Fluorescent images of the sutures in mice receiving DDR2+ CSC or co-transplanted iDTR;CTSK+ CSC and DDR2+ CSC grafts 16 weeks after orthotopic transplantation with subsequent DT administration. tdTomato and GFP visualization showing engrafted cells at sites of newly formed cranial bone. Each red line in μCT images indicates the sectioning area and direction. Green, CTSK+ (mGFP); Red, DDR2+ (tdTomato); Blue, DAPI. Images are representative of at least five (a, c) biological replicates and four (e-k) independent experiments. Scale bars are denoted in images.
Extended Data Fig. 9 |
Extended Data Fig. 9 |. IGF1 secreted by CTSK+ CSCs suppresses fusion activity.
a, Heatmap showing differential expression of candidate signaling mediators (i) and graphs displaying normalized read counts of Igf1 and Igf1r in CTSK+ CSCs and DDR2+ CSCs determined by RNA-Seq at P7 mice (n=5). b, RT-PCR analysis of Igf1 gene expression in CTSK+ CSCs and CTSK lineage cells (Thy-1.2+/CD90+ here) from WT (n=3) and Twist1Ctsk (n=3) mice at P10. c, Schematic of the experimental design for subcutaneous injection of recombinant IGF1 over the calvarium of Twist1Ctsk mice. d, e, Characterization of Igf1fl/fl;Ctsk-Cre (Igf1Ctsk) mice: μCT scan 3D images (d) of the skull of WT and Igf1Ctsk mice at P28. Red arrows indicate fusing and fused sutures. μCT scans of 2D images (e, left) and 2D cut planes (e, right), The asterisk in e indicates fusing sutures. Each of dots shown in the graph represents an individual mouse. ****P < 0.0001, P values are shown. Mean ± s.d., unpaired, two-tailed Student’s t-test (a (ii)), one-way ANOVA with Tukey’s multiple comparisons test (b). Scale bars are denoted in images.
Extended Data Fig. 10 |
Extended Data Fig. 10 |. Endochondral ossification in human craniosynostosis and characterization of human DDR2+ CSCs.
a, Histological analysis of active cartilage remodeling occurring at sites of active suture fusion using H&E (top) and Alcian Blue (bottom) staining of FFPE calvarial specimens from patients with craniosynostosis. The specimen displayed represents a portion of the lambdoid suture. Higher magnification images are provided with the corresponding Roman numerals indicated in lower magnification images. b, c, Representative images demonstrating active endochondral ossification in patients with craniosynostosis: human calvarial specimens were immunostained for DDR2 (green) and Osteocalcin (red) (b) and DDR2 (green), COL2A1 (red), and Osteopontin (OPN, magenta) (c). d, FACS plots for human calvarium tissues. Lin indicates CD31, CD45, and CD235a staining. Red boxes indicate hDDR2 CSCs and hDDR2+ CSCs. Orange boxes indicate markers defining human SSC populations (PDPN+CD146CD164+CD73+), reported in human fetal long bones. Black arrows demonstrate parent/daughter gates. Experiments underwent a minimum of 5 independent repeats. e, Heatmaps showing gene expression features of human DDR2 or DDR2+ CSCs displaying conservation of gene expression signatures observed in their murine counterpart cell types (murine CTSK+ CSCs or DDR2+ CSCs, respectively), including expression of IGF1 on hDDR2 CSCs and IGF1R on hDDR2+ CSCs as analyzed by RT-PCR. hDDR2+ CSCs and hDDR2 CSCs were freshly isolated by FACS from five individual patients with craniosynostosis. The color scale (from low expression in blue to high expression in red) depicts the log2 fold change of gene expression. The sequence of the primers is provided in Supplementary Table 3. f, Representative images of immunostaining for DDR2 (green) and IGF1R (red) in human calvarial tissues of three individual patients with craniosynostosis. Higher magnification images are provided. Results are representative of a minimum of five (a-d) and three (f) independent experiments. Scale bars are denoted in images.
Extended Data Fig. 11 |
Extended Data Fig. 11 |. Determination of self-renewal, differentiation hierarchy, and functional characterization of hDDR2+ CSCs.
a, Schematic representation of the intramuscular transplantation model for human sutural cells. b, FACS plots showing the differentiation of the indicated input populations including hDDR2 CSCs (i), hDDR2+ CSCs (ii), hDDR2+ CD200 (iii), and matrigel only (iv) in primary recipients immunodeficient NSG-EGFP mice 10 days after intramuscular transplantation. 1 to 3×10⁴ hDDR2 CSCs and hDDR2+ CSCs were initially transplanted into immunodeficient NSG-EGFP primary recipients. 1 to 5×10³ hDDR2+ CSCs were re-isolated from the primary transplants. Matrigel without cells was used as a control. Black arrows demonstrate parent/daughter gates. Experiments underwent 3 independent repeats. c, Flow cytometry plots showing gating strategy for human DDR2+ and DDR2 CSCs with human-specific cell surface markers including human beta-2 microglobulin (β2M) and pan-human leukocyte antigen complex (HLA-ABC) in human calvarium. d, A schematic representation of in vivo serial transplantation studies of hDDR2 CSCs and hDDR2+ CSCs. To test the proliferative self-renewal and differentiation capacity of hDDR2 CSCs and hDDR2+ CSCs, freshly FACS-isolated cells were labeled with a lipophilic cell membrane dye prior to the intramuscular transplantation. Gross images of the primary grafts (arrowheads) explanted 10 days after transplantation. e, FACS plots showing that transplanted hDDR2 CSCs (top plots) and hDDR2+ CSCs (bottom plots) underwent multiple rounds of proliferation during the assays without interconversion in the primary grafts (i) or secondary grafts (ii). f, Immunostaining for the proliferation marker Ki-67 (green) in hDDR2 CSCs and hDDR2+ CSCs (red, stained by cytoskeleton protein, α-Tubulin) isolated after the second round of transplantation. g, In vitro limiting dilution analysis and CFU-F formation. Dilutions of 500, 200, 100, 50, 20, and 10 hDDR2 CSC or hDDR2+ CSCs were seeded onto 6-well culture plates. Colonies were stained with Crystal violet and analyzed 10 days after seeding. h, Images of Alizarin Red S (upper, red) and Alcian Blue (lower, blue) staining for in vitro clonal multipotency. All cells were derived from the expansion of a single FACS-isolated hDDR2 CSC or hDDR2+ CSC. i, Quantification of the percentage of cells able to form mesenspheres from hDDR2 CSCs, hDDR2+ CSCs, hDDR2 CD200, and hDDR2+ CD200 cells. n=3 independent experiments. j, Quantification of the area of von Kossa and Safranin O staining in the renal capsule after transplantation of hDDR2 CSCs and hDDR2+ CSCs at 2 weeks post-transplantation. n=3 independent experiments. k, Cellular and molecular features of endochondral ossification of hDDR2+ CSCs: immunostaining for skeletal cell type markers and key markers of endochondral bone development including Osteocalcin (i) and Endomucin (EMCN) (ii) in human xenografts derived from FACS-isolated hDDR2+ CSCs. Images in f-h represent five individual experiments and k represent a minimum of three independent experiments. Plots in b, c, e are representative of results from three independent experiments. ****P < 0.0001, P values are shown. Mean ± s.d., unpaired, two-tailed Student’s t-test (j), two-way ANOVA with Tukey’s multiple comparisons test (i). Scale bars are included in microscopy images.
Fig. 1 |
Fig. 1 |. Defects in CTSK+ CSCs cause craniosynostosis and the expansion of an alternative lineage.
a, μCT of skull of WT (Twist1+/+;Ctsk-Cre;mTmG, n=6) and Twist1Ctsk (Twist1fl/fl;Ctsk-Cre;mTmG, n=6), P28. Red arrows, fusing sutures. Interfrontal (IF); coronal (COR); sagittal (SAG); lambdoid (LAM); squamosal (SQ); occipitointerparietal (OIP) sutures. b, μCT showing histology sites, red lines. LAM (i) and OIP (ii), P30. Insets, bright-field merged images. c, LAM in WT and Twist1Ctsk;mTmG mice, P14. d, FACS plots of total live CTSK+ cells (top), CTSK+ CSCs (LinThy-1.26C3CTSK-mGFP+CD200+CD105CD51+) (middle), and CTSK-negative putative CSCs (CTSK pCSCs, LinThy-1.26C3CTSK-mGFPCD200+CD105CD51+) (bottom) in microdissected sutures of WT (n=12) and Twist1Ctsk;mTmG (n=17) mice, P14. Lin indicates CD31, CD45, and Ter119. Absolute numbers and frequency of populations relative to total live cells. e, Immunostaining for COMP and Alcian Blue of LAM, P14. f, Endochondral ossification in Twist1Ctsk;mTmG mice, P7. g, FACS plots (i), total CTSK+ cells relative to total live cells (ii), (iii) LAM, iDTRCtsk;mTmG after DT or PBS (PBS, n=4; DT, n=3). h, μCT (i) and 2D cut planes (ii) iDTR (n=5) and iDTRCtsk (n=6) mice at P21 and P35 after DT. i, H&E of the sutures of iDTR and iDTRCtsk mice after DT. j, FACS plots of CTSK pCSCs and CTSK pCSCs relative to total live cells from iDTRCtsk mice (PBS, n=4; DT, n=4). ****P < 0.0001. Mean ± s.d., unpaired two-tailed Student’s t-test (d, g, j). All FACS experiments (d, g, j) were repeated a minimum of three times on separate cohorts. Images in a, c, e, g (iii), h, and i represent results from at least five biological replicates. b, f are representative of a minimum of three independent experiments. Scale bars, 100 μm, b, c, e, f, g, i; all μCT images, 1.0 mm.
Fig. 2 |
Fig. 2 |. Identification of a sutural DDR2+ CSC.
a, DDR2+ cells, LAM, Ctsk-Cre;mTmG mice, P7. b, FACS, P7. Pregated on LinThy-1.26C3. c, DDR2, WT and Twist1Ctsk;mTmG mice, P14 (i), iDTRCtsk mice, P21 (ii). d, DDR2+ CSCs by FACS (Lin6C3Thy-1.2CTSK-mGFPCD200+CD105CD51+DDR2+) in the sutures of WT (n=13), Twist1Ctsk (n=20), P7 to P10 (i), and iDTRCtsk mice, PBS (n=4) or DT (n=3) at P21 (ii). e, In vivo intramuscular serial transplantation. f, FACS of DDR2+ CSC-derived cells after serial transplantation. Black arrows, parent/daughter gates. Red boxes, DDR2+ CSCs. Representative of 4 independent experiments. g, FACS showing no interconversion between tdTomato+ DDR2+ CSCs and mGFP+ CTSK+ CSCs isolated from Ctsk-Cre;mTmG mice after the first round of transplantation. h, Lineage tracing of sutural DDR2+ cells using Ddr2-CreER;mTmG mice over an 18 month chase. i, FACS plots showing total H2B-GFP label-retaining cells after 6 months of chase post-doxycycline (Dox). j, GFP signal intensity histogram of LinThy-1.26C3DDR2+ or DDR2 populations after 6 (n=9) or 12 months (n=8) of chase. Label-retaining cells (LRCs) were determined as gated. Green, CD200+CD105 (CSC); Blue, CD200variableCD105+; Red, CD200CD105. k, LAM, H2B-GFP mice after 6 months of chase with DDR2 immunostaining. In all graphs, each of dot represents an individual mouse. ****P < 0.0001. Mean ± s.d., unpaired two-tailed Student’s t-test (d). Images in a, c, h, k are representative of at least three independent experiments. Scale bars, 100 μm, a, c, h (left), k; 50 μm, a (far-right); 20 μm, c, h (right), k (inset).
Fig. 3 |
Fig. 3 |. DDR2+ CSCs are endochondral-specialized.
a, b, Bone organoids after renal capsule transplantation, 4 weeks. c, Cryo-sectioned bone organoids derived from DDR2+ CSCs (red) from Ctsk-Cre;mTmG mice. No interconversion of DDR2+ CSCs (red) into CTSK+ CSCs (green) is seen. Inset, additional DDR2 immunostaining. d, Timecourse of the bone organoids. von Kossa staining (black) for mineralized bone and Safranin O (red) for cartilage in adjacent serial sections. e, Timecourse immunofluorescence for markers of endochondral ossification in DDR2+ CSC-derived bone organoids 2, 4, and 8 weeks post-transplantation. f, H&E and immunostaining for markers of hematopoietic cells in organoids from femur SSCs, DDR2+ CSCs, or CTSK+ CSCs. g, FACS plots indicating recruitment of hematopoietic populations to femoral SSC-derived (n=4) or DDR2+ CSC-derived (n=3) bone organoids. Lin, CD3, Gr-1, CD11b, B220, and Ter119. Total LincKit+ cells (LK); Total LinSca1+cKit+ cells (LSK); Long-term hematopoietic stem cells (LT-HSC, LinSca1+cKit+CD150+CD48); Short-term HSC (ST-HSC, LinSca1+cKit+CD150CD48); Multipotent progenitors (MPP, LinSca1+cKit+CD150CD48+). h, Principal component analysis (PCA) of the CTSK+ CSC and DDR2+ CSC transcriptome profiling after isolation from P7 suture (n=5). i, Heatmap of gene expression. The color scale bar shows Z-score values on normalized read counts across the samples. ****P < 0.0001, P values are shown. Mean ± s.d., unpaired two-tailed Student’s t-test. Images in b-f are representative of a minimum of three (d, e) and five (b, c, and f) independent experiments. Scale bars, 1.0 mm, b; 100 μm, c, e, f; 200 μm, d.
Fig. 4 |
Fig. 4 |. DDR2+ CSCs contribute to calvarial mineralization and suture fusion.
a, b, μCT, DTA, DTADdr2−ER (a) and Osxfl/fl, Osx Ddr2−ER (b) mice, P14, 7 days after TAM (DTA, n=5; DTADdr2−ER, n=6; Osxfl/fl, n=7; Osx Ddr2−ER, n=6). c, Orthotopic transplantation of FACS-purified CTSK+ CSCs and DDR2+ CSCs into 4-week-old suture-ablated mice. d, μCT, 8 weeks post-transplantation. Black arrowhead, primary implantation site. Red arrows, fusing sutures. e, 2D cut plane, skull 16 weeks post-transplantation of indicated populations. Asterisks, fused sutures. f, μCT, 16 weeks after implantation of DDR2+ CSCs. tdTomato for DDR2+ CSC engraftment and fusion at the implantation site (i), but a contralateral control (ii). Red lines, sites of histologic sampling. g, CTSK+ CSCs and iDTR;CTSK+ CSCs were isolated from P7–10 Ctsk-Cre;mTmG or iDTRCtsk;mTmG mice, respectively. All recipients were administered DT 8 weeks post-transplantation. h, μCT 16 weeks post-transplantation (Control, n=6; CTSK+, n=6; DDR2+, n=5; CTSK+ and DDR2+, n=5; iDTR;CTSK+ and DDR2+, n=4). i, H&E and fluorescence imaging, primary implantation site 16 weeks post-transplantation and DT administration. Asterisks, the region of fusion. j, The percentage of fused LAM (i) or OIP (ii) suture length relative to total LAM or OIP suture length on the ipsilateral side. n=3 independent experiments. ****P < 0.0001, P values are shown. Mean ± s.d., one-way ANOVA with Tukey’s posttest (j). e, f, h, and i are representative of a minimum of three independent experiments. Scale bars, 100 μm, f (i,ii), i; all μCT images, 1.0 mm.
Fig. 5 |
Fig. 5 |. Identification of IGF1 as a CTSK+ CSC-derived factor regulating DDR2+ CSCs.
a, μCT, Twist1Ctsk mice at P28 after IGF1 treatment, showing rescue of fusion. Experimental design in Extended Data Fig. 9c. Arrows, sites of suture patency (WT+veh, n=4; WT+IGF1, n=4; Twist1Ctsk+veh, n=5; Twist1Ctsk+IGF1, n=5). b, Relative percentage of fused suture length (WT+veh, n=4; WT+IGF1, n=4; Twist1Ctsk+veh, n=5; Twist1Ctsk+IGF1, n=5). SQ (i) and LAM (ii) (****P < 0.0001). c, Gross appearance of Igf1fl/fl;Ctsk-Cre (Igf1Ctsk) mice, P28 and P56. d, μCT 3D scans of the skull of WT and Igf1Ctsk mice at P56 (WT, n=5; Igf1Ctsk, n=7). Red arrows, fusing sutures. e, The relative percentage of fused coronal suture length in WT (n=5) and Igf1Ctsk (n=7) mice at P56. f, FACS plots and quantification of DDR2+ CSCs in the sutures of WT and Igf1Ctsk mice at P10 (n=5), showing expansion of sutural DDR2+ CSCs. Each of dot represents an individual mouse. ****P < 0.0001. Mean ± s.d., unpaired two-tailed Student’s t-test (e, f), one-way ANOVA with Tukey’s posttest (b). FACS plots represent results from five biological replicates. Images in a, d represent results from at least four biological replicates. Scale bars in all μCT images denote 1.0 mm.
Fig. 6 |
Fig. 6 |. Identification of human DDR2+ CSCs.
a, H&E (n=14) and Alcian Blue (n=7), b, immunostaining (n=7), c, d, immunofluorescence, human SAG craniosynostosis specimens. e, In vivo serial transplantation of hDDR2 CSCs (left)and hDDR2+ CSCs (right), FACS plots showing the self-renewal and differentiation. FACS from initial donor (top), primary transplants (middle), and secondary transplants (bottom). Black and red arrows indicate parent/daughter gates and transplanted populations, respectively. μCT, bone organoids derived from the tertiary transplants. f, Flow cytometry histograms of dye dilution proliferation analysis. g, CFU-F, hDDR2 CSCs, hDDR2+ CSCs, and other human calvarial non-stem populations (n≥3 independent experiments). h, Bright-field, initially seeded, primary, secondary, and tertiary mesenspheres (left). Quantification of cell numbers per sphere (right, n≥9). i, Gross image of xenograft bone organoid in the renal capsule of NSG-EGFP host (left). μCT timecourse, hDDR2 CSC or hDDR2+ CSC-derived bone organoids (right). j, Endochondral ossification in xenograft bone organoids from hDDR2+ CSCs by von Kossa and Safranin O. k, Immunostaining, on xenograft bone organoids derived from hDDR2+ CSCs, (human nuclear antigen, HNA) implanted into the renal capsule NSG-EGFP hosts. (i) Confocal image showing the graft stained as indicated. (ii) High magnification of i. (iii) COL2A1+ chondrogenic cells (left) and MMP13+ apoptotic cells (right) in xenograft organoids derived from hDDR2+ CSCs. ****P < 0.0001. Mean ± s.d., one-way (g), two-way (h) ANOVA with Tukey’s posttest. FACS plots (e, f) and images (a-d, g-k) are representatives of a minimum of three independent experiments. Scale bars, 200 μm, a (left); 25 μm, a (middle and right), b; 100 μm, c, d, j, k; 20 μm, d (inset); 500 μm, g; 50 μm, h; all μCT images, 1.0 mm.

Comment in

References

Main references

    1. Debnath S et al. Discovery of a periosteal stem cell mediating intramembranous bone formation. Nature 562, 133–139 (2018). - PMC - PubMed
    1. Howard TD et al. Mutations in TWIST, a basic helix–loop–helix transcription factor, in Saethre-Chotzen syndrome. Nat. Genet. 15, 36–41 (1997). - PubMed
    1. Ghouzzi V El et al. Mutations of the TWIST gene in the Saethre-Chotzene syndrome. Nat. Genet. 15, 42–46 (1997). - PubMed
    1. Carver EA, Oram KF & Gridley T Craniosynostosis inTwist heterozygous mice: A model for Saethre-Chotzen syndrome. Anat. Rec. 268, 90–92 (2002). - PubMed
    1. Menon S et al. Skeletal stem and progenitor cells maintain cranial suture patency and prevent craniosynostosis. Nat. Commun. 12, 4640 (2021). - PMC - PubMed

Additional references

    1. Nakamura T et al. Estrogen Prevents Bone Loss via Estrogen Receptor α and Induction of Fas Ligand in Osteoclasts. Cell 130, 811–823 (2007). - PubMed
    1. Chen Y-T, Akinwunmi PO, Deng JM, Tam OH & Behringer RR Generation of aTwist1 conditional null allele in the mouse. genesis 45, 588–592 (2007). - PubMed
    1. Nakashima K et al. The Novel Zinc Finger-Containing Transcription Factor Osterix Is Required for Osteoblast Differentiation and Bone Formation. Cell 108, 17–29 (2002). - PubMed
    1. Peng Y et al. Increased transport of acetyl-CoA into the endoplasmic reticulum causes a progeria-like phenotype. Aging Cell 17, e12820 (2018). - PMC - PubMed
    1. Mohamed FF et al. The collagen receptor, discoidin domain receptor 2, functions in Gli1-positive skeletal progenitors and chondrocytes to control bone development. Bone Res. 10, 11 (2022). - PMC - PubMed

Publication types