Clinical Trial
. 2023 Oct;622(7981):130-138.
doi: 10.1038/s41586-023-06541-3. Epub 2023 Sep 20.

Cingulate dynamics track depression recovery with deep brain stimulation

Affiliations
Clinical Trial

Cingulate dynamics track depression recovery with deep brain stimulation

Sankaraleengam Alagapan et al. Nature. 2023 Oct.

Abstract

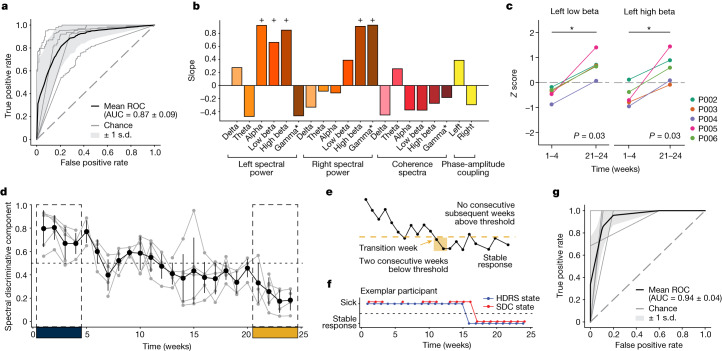
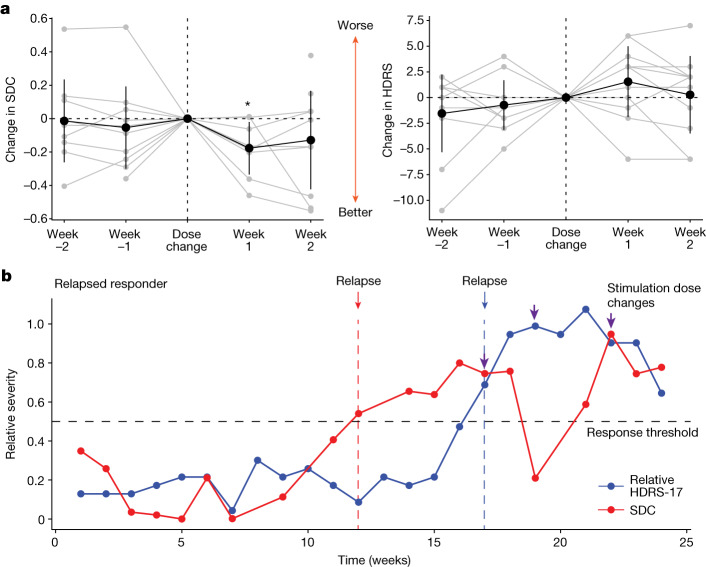
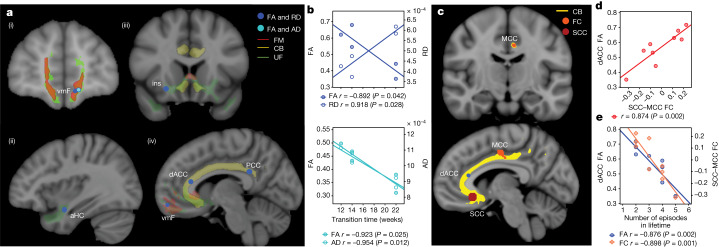
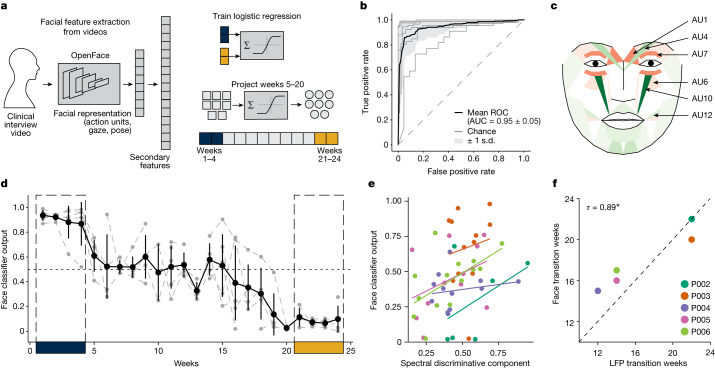
Deep brain stimulation (DBS) of the subcallosal cingulate (SCC) can provide long-term symptom relief for treatment-resistant depression (TRD)1. However, achieving stable recovery is unpredictable2, typically requiring trial-and-error stimulation adjustments due to individual recovery trajectories and subjective symptom reporting3. We currently lack objective brain-based biomarkers to guide clinical decisions by distinguishing natural transient mood fluctuations from situations requiring intervention. To address this gap, we used a new device enabling electrophysiology recording to deliver SCC DBS to ten TRD participants (ClinicalTrials.gov identifier NCT01984710). At the study endpoint of 24 weeks, 90% of participants demonstrated robust clinical response, and 70% achieved remission. Using SCC local field potentials available from six participants, we deployed an explainable artificial intelligence approach to identify SCC local field potential changes indicating the patient's current clinical state. This biomarker is distinct from transient stimulation effects, sensitive to therapeutic adjustments and accurate at capturing individual recovery states. Variable recovery trajectories are predicted by the degree of preoperative damage to the structural integrity and functional connectivity within the targeted white matter treatment network, and are matched by objective facial expression changes detected using data-driven video analysis. Our results demonstrate the utility of objective biomarkers in the management of personalized SCC DBS and provide new insight into the relationship between multifaceted (functional, anatomical and behavioural) features of TRD pathology, motivating further research into causes of variability in depression treatment.


Conflict of interest statement

K.S.C. is a consultant to Abbott Laboratories. H.S.M. received consulting and IP licensing fees from Abbott Laboratories. P.R.-P. has received consulting fees Janssen Pharmaceuticals, Abbott Laboratories and LivaNova, Inc. B.H.K. is a consultant for Abbott Neuromodulation, Medtronic and ClearPoint Neuro. R.E.G. serves as a consultant to Medtronic, which manufactures products related to the research described in this paper. R.E.G. receives compensation for these services. The terms of this arrangement have been reviewed and approved by Emory University and the Icahn School of Medicine at Mount Sinai in accordance with their respective conflict of interest policies. S.A., C.J.R., H.S.M., V.T., P.R.-P., A.C., R.B., A.C.W., K.S.C. and A.V. are listed as inventors on provisional patent filings related to the findings in this manuscript.

Figures

Fig. 1
Fig. 1. Overview of study procedures.
a, Coronal view of the DBS lead targeting bilateral SCC in an example patient. The red sphere indicates the volume of tissue activated (VTA) with the final stimulation parameters. The black circles indicate the volume of tissue recorded (VTR) from each electrode contact, showing coverage of grey matter that are the likely sources of the recorded LFP. b, Common activation pathway patterns from chronic stimulation VTA seed of the six participants at 6 months. c, Trajectory of HDRS-17 scores over 24 weeks for five participants (of six total) who were typical responders. Grey lines indicate individuals and the black line indicates the mean. Error bars indicate standard deviation (n = 5 participants). Clinical consensus was that all five were ‘sick’ during weeks 1–4 and in ‘stable response’ during weeks 20–24. d, Schematic of deriving the SDC from LFP features. A neural network classifier is first trained with data from the ‘sick’ and ‘stable response’ states of all typical responders. Next, separate neural networks are trained to compress the data from the spectral feature space to a low-dimensional latent space and then reconstruct the data from that compressed version. Using recent advances in XAI techniques, one of these latent dimensions is a discriminative component constrained to represent the simultaneous data changes (the SDC) used by the classifier to distinguish ‘sick’ from ‘stable response’. e, Illustration of the utility of an objective biomarker. When patients experience instability in symptom scores, decisions about treatment (for example, stimulation voltage adjustment) must be made by inferring whether the instability is due to transient distress (scenario 1) or depression relapse (scenario 2). A biomarker that reflects progress of the brain towards ‘stable response’ will enable more effective clinical decision-making about interventions. CB, cingulum bundle; UF, uncinate fasciculus; FM, forceps minor; F-ST, frontostriatal fibres.
Fig. 2
Fig. 2. Identification and performance of SDC.
a, ROC curves of the LFP classifier in classifying ‘sick’ and ‘stable response’ states with leave-one-participant-out cross-validation. Grey lines indicate the ROC curve of individual folds of the cross-validation. Black line indicates the mean ROC curve. b, Simultaneous change in spectral features that capture the difference between the ‘sick’ and ‘stable response’ states as reflected by the SDC. The + symbol indicates the top five discriminative features. Gamma* indicates the 30–40 Hz band, as described in the text. c, Change in left-low beta and left-high beta power from the beginning to the end of the observation phase (relative to last week of postsurgical period without stimulation). *P = 0.031 (one-sided Wilcoxon signed-rank test). d, Trajectory of the SDC over 24 weeks. Grey lines indicate individual participants and the black line indicates the average of the five typical responders. Error bars indicate standard deviation (n = 5 participants). e, Illustration of identifying state change from ‘sick’ to ‘stable response’. Transition to ‘stable response’ is defined as the week when the measure falls below the transition threshold for two consecutive weeks and (during the observation period) never returns above threshold for two or more weeks. f, State change from ‘sick’ to ‘stable response’ in an exemplar participant (P002). The blue line indicates the state inferred from HDRS-17 scores and the red line indicates the state inferred from the SDC. g, ROC curves of the SDC state predicting the HDRS state. Grey lines indicate the ROC curve for individual participants and the black line indicates the mean ROC curve.
Fig. 3
Fig. 3. Response to stimulation change and validation in relapsed responder.
a, Change in the SDC (left) and HDRS-17 (right) before and after the week of stimulation voltage change. Grey lines indicate the change relative to the week of a stimulation voltage change for each individual adjustment of stimulation voltage. Black lines indicate the average across all changes. Error bars indicate standard deviation (n = 8 stimulation dose changes). *P = 0.04 (one-sided Wilcoxon signed-rank test). b, Illustration of SDC in an out-of-sample participant who was a relapsed responder. The blue line denotes HDRS-17 and the red line denotes the SDC inferred from LFP features not used for training the classifier or SDC. The SDC increased above the threshold of 0.5 (grey dashed line) indicating relapse (red arrow) at week 12, indicating the relapse 5 weeks before it was observed in the HDRS-17 at week 17 (blue arrow). Purple arrows indicate changes in stimulation voltage levels. Note that stimulation voltage change did result in an SDC decrease as shown in a; however, the SDC did not stabilize until three stimulation voltage changes were made. The final voltage in this patient (4.5 V) was comparable with the average voltage in the typical responders (4.4 ± 0.57 V).
Fig. 4
Fig. 4. Structural and functional imaging correlates of transition to stable response.
a, Regions showing correlation (Spearman’s rho) between the transition week and the white matter microstructure damage (P < 0.05), measured by both FA and radial diffusivity or FA and axial diffusivity, in vmF (i), aHC (ii), Ins (iii) and dACC and PCC (iv). b, Significant correlations (Spearman’s rho) were observed between the transition to ‘stable response’ week and FA (P = 0.042) and radial diffusivity (P = 0.028) in dACC (top) and FA (P = 0.025) and axial diffusivity (P = 0.012) in vmF (bottom). c, A significant correlation of dACC FA and functional connectivity between SCC and MCC with the number of episodes in a lifetime using all nine participants (excluding one participant because of artefact, Spearman’s rho P < 0.05) indicated by an orange dot in the coronal section (top). These regions are directly connected from the stimulation target via the cingulum bundle (bottom, yellow lines) which also contains the FA and radial diffusivity abnormality described in a. d, Post hoc correlation between FA and functional connectivity indicates a significant relationship between FA in the dACC and functional connectivity of the SCC and MCC (Spearman’s rho P = 0.002). e, Correlation (Spearman’s rho) between the number of episodes in a lifetime and functional connectivity of SCC and MCC (P = 0.001) and FA (P = 0.002).
Fig. 5
Fig. 5. Facial expression correlates of SDC and transition times.
a, Overview of facial expression classifier analysis. Facial landmarks are extracted from each frame of videos of clinical interviews and facial representation features (action units, gaze and pose) are estimated for each frame. Separate logistic regression classifiers are trained for each individual participant’s features to classify ‘sick’ and ‘stable response’ states. The features from the intermediate period (weeks 5−20) for each participant are then projected through the corresponding trained classifiers to get a prediction probability that serves as a measure of behavioural state. b, ROC curves of face classifier in classifying ‘sick’ and ‘stable response’ states within individual participants. Grey lines indicate the mean ROC curve of individual participants. Black lines indicate the mean ROC curve across participants. c, Muscle heat map output from Py-Feat showing consensus changes in action unit intensities between the ‘sick’ and ‘stable response’ states across all participants. Red colour indicates increases, while green colour indicates decreases. d, Trajectories of face classifier output for five typical responders. Grey lines indicate individuals and the black line indicates the average. Error bars indicate standard deviation (n = 5 participants). e, SDC versus face classifier output from weeks 5 to 20 for the five typical responders. Dots indicate weeks for individual participants, and the line indicates least-square fit regression. f, Correlation (Kendall’s tau) between transition weeks inferred from the SDC and face classifier output. Dots indicate individual participants. *P = 0.037.
Extended Data Fig. 1
Extended Data Fig. 1. Clinical assessment scores across different phases.
a, HDRS-17 scores across different phases. Dashed lines indicate the score at which the participant is considered to be a responder (based on 50% decrease in HDRS-17). Dotted line indicates a HDRS-17 score of 8 below which participants are considered to be in remission. b, MADRS scores across different phases. Dashed lines indicate the score at which the participant is considered to be a responder (based on 50% decrease in MADRS). Dotted line indicates a MADRS score of 10 below which participants are considered to be in remission. c, HDRS-17 Trajectories of participants excluded from analysis.
Extended Data Fig. 2
Extended Data Fig. 2. Validation of Generative Causal Explainer (GCE).
a, Information flow from low-dimensional latent space components to classifier prediction indicates that classifier prediction is affected by the discriminative component and not by the non discriminative components. b, Classifier performance in leave-one-participant-out cross-validation for different datasets. Reconstructed data refers to data reconstructed from GCE using all components. Performance of the classifier in datasets reconstructed by randomizing discriminative and non-discriminative components is shown in magenta and cyan bars. Randomizing the discriminative component of the held-out dataset affected the classifier performance significantly, indicating that the association between data and classifier prediction is impaired, which in turn confirmed that the GCE did not overfit to the training dataset. Grey stars denote AUROC for each fold of the cross-validation. Error bars indicate standard deviation (n = 5 cross-validation fold). c, Receiver operating characteristic curve for neural network classifier trained on the reconstructed data to distinguish ‘sick’ versus ‘stable response’ state.
Extended Data Fig. 3
Extended Data Fig. 3. Permutation feature importance.
Permutation feature importance is a shuffle-based technique to determine the contribution of features to classification performance. Since the features were correlated, a dendrogram-based clustering was used to identify clusters of features (distance threshold = 1). Features within a cluster were permuted jointly to generate shuffled datasets (n = 100) which were then evaluated using the classifier trained on the original dataset. The decrease in performance of the shuffled datasets provides a measure of the feature’s contribution to classifier performance. a, Adjacency matrix based on Spearman correlation between spectral features. Hotter colors indicate a positive correlation. b, Dendrogram-based clustering of features. c, Difference in Area under ROC curve between classifier trained on original dataset and shuffled datasets (n = 100).
Extended Data Fig. 4
Extended Data Fig. 4. Difference between early and late changes in other relevant features.
Change in power relative to the last week of post-surgical period without stimulation from the beginning of the observation phase to the end of the observation phase.
Extended Data Fig. 5
Extended Data Fig. 5. Trajectories of HDRS-17 and the SDC.
a, Trajectory of relative HDRS-17 and spectral discriminative component for individual participants. P001 is the relapsed responder. The vertical dashed line indicates the week when the stimulation voltage was increased. b, Illustration of how well the SDC sick/stable response designation matches the HDRS-defined sick/stable response state in typical responders. The blue line denotes the HDRS state while the red line denotes the SDC state using a threshold of 0.5.
Extended Data Fig. 6
Extended Data Fig. 6. Trajectories of the SDC and face classifier output.
Trajectory of face classifier output and spectral discriminative component for individual participants. P001 is the relapsed responder. The vertical dotted line indicates the week when the stimulation voltage was increased.
Extended Data Fig. 7
Extended Data Fig. 7. Case study of SDC indicating response while HDRS-17 indicates non-response.
a, We observed in participant P002 SDC (red line) indicated stable response, defined using the criteria in Fig. 2e, at Week 13 while HDRS-17 (blue line) indicated ‘stable response’ at week 20. Stimulation voltage change (purple arrows) did not decrease HDRS-17 but decreased SDC. b, Psychic anxiety item (orange) of HDRS-17 increased contribution to total HDRS-17 while depressed mood (blue) remained constant suggesting the elevated HDRS-17 beyond week 13 (when SDC indicated stable response) may have been sustained by an increase in anxiety. Clinical notes support this hypothesis: “Biggest treatment issue is an internal resistance to the loss of depression and fears about what that means for her, including confronting feelings of loneliness and emptiness”.

References

    1. Crowell, A. L. et al. Long-term outcomes of subcallosal cingulate deep brain stimulation for treatment-resistant depression. Am. J. Psychiatry10.1176/appi.ajp.2019.18121427 (2019). - PubMed
    1. Holtzheimer PE, et al. Subcallosal cingulate deep brain stimulation for treatment-resistant depression: a multisite, randomised, sham-controlled trial. Lancet Psychiatry. 2017;4:839–849. doi: 10.1016/S2215-0366(17)30371-1. - DOI - PubMed
    1. Crowell AL, Garlow SJ, Riva-Posse P, Mayberg HS. Characterizing the therapeutic response to deep brain stimulation for treatment-resistant depression: a single center long-term perspective. Front. Integr. Neurosci. 2015;9:41. doi: 10.3389/fnint.2015.00041. - DOI - PMC - PubMed
    1. Mayberg HS, et al. Deep brain stimulation for treatment-resistant depression. Neuron. 2005;45:651–660. doi: 10.1016/j.neuron.2005.02.014. - DOI - PubMed
    1. Holtzheimer PE, et al. Subcallosal cingulate deep brain stimulation for treatment-resistant unipolar and bipolar depression. Arch. Gen. Psychiatry. 2012;69:150–158. doi: 10.1001/archgenpsychiatry.2011.1456. - DOI - PMC - PubMed

Publication types

Associated data