. 2023 Oct;622(7981):195-201.
doi: 10.1038/s41586-023-06556-w. Epub 2023 Sep 20.

Cryo-EM structures reveal native GABAA receptor assemblies and pharmacology

Affiliations

Cryo-EM structures reveal native GABAA receptor assemblies and pharmacology

Chang Sun et al. Nature. 2023 Oct.

Abstract

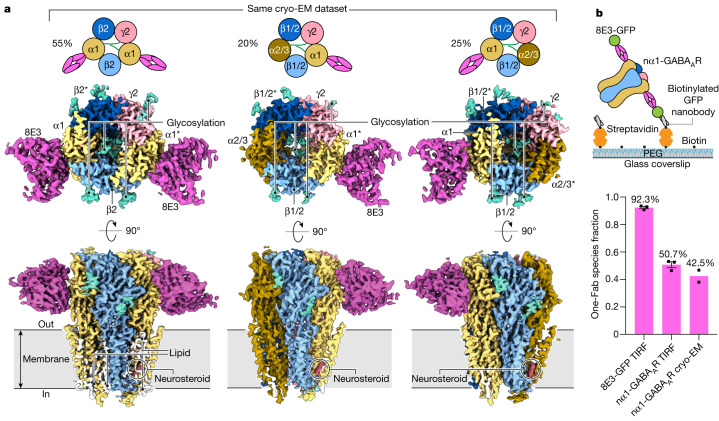
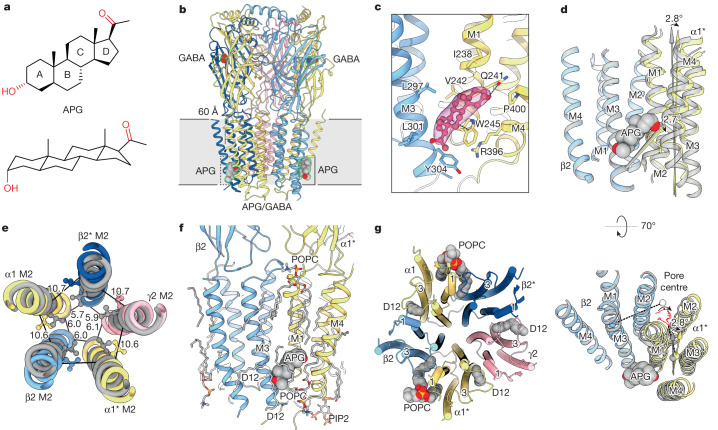
Type A γ-aminobutyric acid receptors (GABAARs) are the principal inhibitory receptors in the brain and the target of a wide range of clinical agents, including anaesthetics, sedatives, hypnotics and antidepressants1-3. However, our understanding of GABAAR pharmacology has been hindered by the vast number of pentameric assemblies that can be derived from 19 different subunits4 and the lack of structural knowledge of clinically relevant receptors. Here, we isolate native murine GABAAR assemblies containing the widely expressed α1 subunit and elucidate their structures in complex with drugs used to treat insomnia (zolpidem (ZOL) and flurazepam) and postpartum depression (the neurosteroid allopregnanolone (APG)). Using cryo-electron microscopy (cryo-EM) analysis and single-molecule photobleaching experiments, we uncover three major structural populations in the brain: the canonical α1β2γ2 receptor containing two α1 subunits, and two assemblies containing one α1 and either an α2 or α3 subunit, in which the single α1-containing receptors feature a more compact arrangement between the transmembrane and extracellular domains. Interestingly, APG is bound at the transmembrane α/β subunit interface, even when not added to the sample, revealing an important role for endogenous neurosteroids in modulating native GABAARs. Together with structurally engaged lipids, neurosteroids produce global conformational changes throughout the receptor that modify the ion channel pore and the binding sites for GABA and insomnia medications. Our data reveal the major α1-containing GABAAR assemblies, bound with endogenous neurosteroid, thus defining a structural landscape from which subtype-specific drugs can be developed.


Conflict of interest statement

The authors declare no competing interests.

Figures

Fig. 1
Fig. 1. The three major nα1-GABAAR complexes.
a, Cryo-EM reconstruction of two-Fab α1*-β2-α1-β2*-γ2 (*denotes the subunit that is next to the γ2 subunit, subunits are counted clockwise when viewed from the extracellular space), ortho-one-Fab α1*-β1/2-α2/3-β1/2*-γ2 and meta-one-Fab α2/3*-β1/2-α1-β1/2*-γ2 receptor complexes (from left to right), purified from mouse brains (cerebellum excluded) using an α1-specific Fab. All reconstructions were processed from the APG/GABA dataset. Percentages calculated from particles separated by 3D classification using an inverse TMD mask (Extended Data Fig. 4). b, Single-molecule TIRF photobleaching of purified nα1-GABAAR–GFP-Fab complexes. Top, experimental design; bottom, distribution of photobleaching events for nα1-GABAAR–GFP-Fab complexes and isolated GFP-Fab (control). Individual data points are presented as squares whereas standard errors of the mean (s.e.m.) are shown as error bars (n = 3 photobleaching movies examined over one independent isolated GFP-Fab sample, n = 3 photobleaching movies examined over one independent nGABAAR–GFP-Fab sample, n = 2 independent cryo-EM samples). The DID cryo-EM dataset was excluded from the analysis because it was not purified the same way as the TIRF samples and contained a smaller particle count than the other two cryo-EM datasets. PEG, polyethylene glycol.
Fig. 2
Fig. 2. APG sculpts the conformation of the TMD.
a, Chemical structure of APG. b, Structural overview of α1*-β2-α1-β2*-γ2 nα1-GABAAR (*denotes the subunit is next to the γ2 subunit, subunits are counted clockwise when viewed from the extracellular space) in complex with APG and GABA. Bound Fabs hidden for clarity. c, Binding pose of APG and ligand density in the binding pocket at the β2+/α1*− TMD interface. Cryo-EM density around APG is contoured at 6.6σ. d, Local conformational changes induced by APG binding. Coordinates of grey structure of a full-length α1β3γ2 recombinant receptor in complex with GABA are from PDB 6I53. Structural alignment based on the β subunit TMD. e, Global structural rearrangements induced by APG binding. Structural alignment based on global TMD. Distances (in Å) are between 9′ gate Cα and the −2′ gate. f, Lipid molecules resolved in the APG/GABA structure. g, Lipids molecules with acyl tails inserted between M1 and M3 of adjacent subunits.
Fig. 3
Fig. 3. DID and ZOL binding propagates conformational changes to the TMD.
a, Competitive radioligand binding assay for purified nα1-GABAARs in complex with ZOL or DID. Individual data points are plotted, along with the curve fitted with the one-site model. b, Structural overview of the two-Fab receptor α1*-β2-α1-β2*-γ2 nα1-GABAAR (*denotes the subunit is next to the γ2 subunit) in complex with ZOL, GABA and endogenous neurosteroid (NS). c,d, Binding poses of DID (c) and ZOL (d) and cryo-EM ligand density. Blue dashed lines, π–π/CH interactions; black dashed lines, hydrogen bonds less than 3.5 Å (acceptor to donor); grey dashed lines, weak hydrogen bonds between 3.5 Å and 4 Å. Cryo-EM density around DID and ZOL is contoured at 5.7σ and 5.1σ, respectively. e, Effect of ligand binding on ECD arrangement. Coordinates of the closed resting receptor in complex with picrotoxin (PTX) are from PDB 6HUG. Structures superimposed on the basis of global TMD. Individual ECDs displaced from centre of pore by 15 Å for clarity. f, Pore profiles in DID structure and ZOL/GABA structure. Pore-delineating dots coloured according to pore radius at that position: red, less than 1.8 Å; green, between 1.8 Å and 4 Å; blue, more than 4 Å.
Fig. 4
Fig. 4. Mechanism of neurosteroid potentiation.
The schematic on the left is based on the full-length recombinant receptor structure (PDB 6I53), whereas the schematic on the right is based on the two-Fab-APG structure from this study. GABA interacts with the receptor at the ECD β+ pocket, inducing anticlockwise rotations of the ECD that reorganize the TMD for Cl ion conduction. Neurosteroids bind to the receptor at the TMD β+ pocket, causing additional anticlockwise ECD rotation and acting as a diagonal brace to stabilize the TMD open-channel conformation. Annular lipids insert their acyl tails between the M3 and M1 helices of adjacent subunits, offering further stabilization of an open-channel conformation.
Extended Data Fig. 1
Extended Data Fig. 1. Biochemical characterization of native receptor isolation from mouse brains using an engineered Fab fragment.
a and b, Expression of tri-heteromeric GABAARs with different α subunits and binding test with the engineered 8E3-GFP Fab monitored with fluorescence-detection size-exclusion chromatography (FSEC). The signal is from the fusion-red protein inserted into the intracellular loop of the γ2 subunit in panel a or the GFP of the 8E3-GFP Fab in panel b. c and d, FSEC traces demonstrating the superior capturing efficiency and protein yield of streptactin-XT resin. e, Western blot analysis of steps during the native receptor purification. The neuroligin 2 (NL2) immunoblot (Synaptic Systems 129 202, 1:1000 dilution) shows robust solubilization of the inhibitory synapse marker NL2. Lanes from left to right were the membrane input and the LMNG solubilized supernatant. The α1 subunit immunoblot (Millipore 06–868, 1:1000 dilution) shows quantitation of the α1 subunit during membrane solubilization, affinity capturing, and elution steps. The numbers on green lines are trimmed signal from the 800 nm channel (shown as green) used for quantitation. The numbers on red lines are trimmed signal from the 700 nm channel (shown in red), which should be close to zero. Western blot detection of the NL2 and the quantitative analysis of the α1 subunit were repeated twice with comparable results. f, The workflow of nα1-GABAARs purification from mouse brains. g, Size-exclusion chromatography (SEC) of nα1-GABAARs and silver-stain SDS-PAGE analysis of different SEC fractions. The SEC and SDS-PAGE analysis on nα1-GABAARs were repeated more than 5 times with similar peak profile and band pattern. h, Identification of GABAAR subunits from the pentameric peak using mass spectrometry. #PSM indicates the number of peptide spectrum matches, coverage refers to the sequence coverage of protein subunits from identified peptides, and ND indicates ‘not detected’. i, Negative-staining electron microscopy images of protein samples from the pentameric peak. j, Scintillation proximity assay of the pentameric peak fraction with 3H-flunitrazepam, at each concentration the specific count is shown as mean ± s.d. (n = 3 replicates prepared from 1 independent native receptor preparation).
Extended Data Fig. 2
Extended Data Fig. 2. Cryo-EM data processing of the DID dataset.
Refer to the “cryo-EM data analysis” method section for more details. Scale bar, 20 nm.
Extended Data Fig. 3
Extended Data Fig. 3. Cryo-EM data processing of the ZOL/GABA dataset.
Refer to the “cryo-EM data analysis” method section for more details. Scale bar, 20 nm.
Extended Data Fig. 4
Extended Data Fig. 4. Cryo-EM data processing of the APG/GABA dataset.
Refer to the “cryo-EM data analysis” method section for more details. Scale bar, 20 nm.
Extended Data Fig. 5
Extended Data Fig. 5. Statistics of final cryo-EM reconstructions.
ai, Euler angle distributions of particles used for final cryo-EM reconstruction of two-Fab-DID (a), meta-one-Fab-DID (b), ortho-one-Fab-DID (c), two-Fab-ZOL (d), meta-one-Fab-ZOL (e), ortho-one-Fab-ZOL (f), two-Fab-APG (g), meta-one-Fab-APG (h), ortho-one-Fab-APG (i). jr, FSC curves and local resolution plots of final cryo-EM reconstructions.
Extended Data Fig. 6
Extended Data Fig. 6. Cryo-EM densities of protein side chains and N-glycosylation used for subunit identification.
Cryo-EM maps from the APG/GABA dataset were analyzed alongside sequences and atomic models to identify subunits that are not bound to the antibody fragment. The figure’s top section displays schematics of the three identified populations, with the five GABAAR subunits labeled by chain IDs and color-coded. In each row, aligned sequence segments are presented on the left, with the distinguishing residues encased in boxes. Following this, cryo-EM densities contoured at the same level from these three populations (separated by a vertical bar) surrounding these residues are shown, with arrows pointing to the distinguishing residues. By comparing the models and cryo-EM densities within the sequence context, subunits can be assigned or excluded (detailed description in the Supplementary Information). The final row showcases the lumenal N-glycosylations from α subunits instead of amino acid residues, with arrows pointing to the positions of a fucose moiety (absent in α1 subunit) linked to the first N-acetylglucosamine of α2/α3 subunits.
Extended Data Fig. 7
Extended Data Fig. 7. Sequence alignments of nα1-GABAAR subunits and structural variations of nα1-GABAAR assemblies.
a, Differential inter-domain arrangements of α subunits from the nα1-GABAARs of the APG/GABA dataset and a previous GABAAR structure (PDB code: 6I53). b and c, Sequence alignments of nα1-GABAAR subunits with sequence ranges relevant to neurosteroid binding. d, TMD structures from the APG/GABA dataset with the allopregnanolone (APG) shown in Vdw representation. e, Structure comparison of the APG binding pockets between two-Fab (shown in white) and meta-one-Fab (shown in blue and yellow). The two structures are overlayed based on the TMD of adjacent β and α subunits. f, TMD structures from the ZOL/GABA dataset with the endogenous neurosteroid molecules shown in Vdw representation. g, Sequence alignments of nα1-I α subunits with sequence ranges relevant to zolpidem binding. h, ECD structures from the ZOL/GABA dataset with the zolpidem shown in Vdw representation. i, Structure comparison of the ZOL binding pockets between two-Fab (shown in white) and meta-one-Fab (shown in yellow and red). The two structures are overlayed based on the ECD of adjacent β and α subunits.
Extended Data Fig. 8
Extended Data Fig. 8. Comparative analysis of the allopregnanolone (APG) bound structure with previous apo structures.
a, Structural superposition based on the extracellular domains (ECD) of adjacent β and α subunits. The compared structures include a recombinant GABA-bound α1*-β3-α1-β3*-γ2 receptor (*denotes the subunit is next to the γ2 subunit; subunits are counted clockwise when viewed from the extracellular space; PDB code 6I53; colored dark gray), a recombinant α1*-β3-α1-β3*-γ2 receptor bound with GABA and alprazolam (PDB code 6HUO; color gray), a recombinant GABA-bound α1*-β2-α1-β2*-γ2 receptor (PDB code 6X3Z; colored white), and the native GABA/APG-bound α1*-β2-α1-β2*-γ2 receptor from this study (colored in yellow, blue, and red). These structures are presented in the same color schemes and referred to by the numbers in the color key throughout the figure. The RMSD analysis of both pockets includes the backbone and the sidechain atoms of residues F64, R66, L117, T129 from the α1 subunit and Y97, E155, S156, Y157, F200, T202, Y205 from the β2/β3 subunit (residue numberings are based on the native receptor from this work). Taken together, the superpositions and the RMSD analysis shows that the pockets, and the ECDs, adopt similar conformations. b, Superposition of individual subunits based on the transmembrane domain (TMD). Despite the general agreement among TMDs from these structures, the poses of the M3 helices are influenced by the substitution of the M3-M4 loop with a short peptide linker (6X3Z), as indicated by the angles formed by Cα atoms of three conserved residues that are shown below the structure overlay. Given that the M3 of the β subunit is part of the APG binding pocket, we focus the downstream structural comparison with the full-length structure bound with GABA only (6I53). c, Local conformational changes induced by APG binding at the β/α* pocket (left) and the β*/α pocket (right). Structural alignment is based on the β subunit TMD. The solid spheres are the centers of mass for the α1 subunits, and the axes shown are the longest axis from the inertia ellipsoid representations of the α1 subunits. The angles between these axes of unbound and APG-bound structures are measured and included in the figure.
Extended Data Fig. 9
Extended Data Fig. 9. Neurosteroid binding to the nα1-GABAARs.
a, Allopregnanolone bound between the β2*+/α1 interface of the two-Fab-APG. Cryo-EM density around APG is contoured at 6.6 σ. b, Structural comparison between two-Fab-APG and previous structure without APG (PDB code: 6I53, apo structure hereafter). The two structures are aligned based on the global TMD. Distances and angles formed with mass centers of TMD are also shown with those of the two-Fab-APG colored black. c, Comparison of pore profiles between two-Fab-APG and previous apo structure. d, Structural overlay of the GABA binding pocket from the two-Fab-APG and previous apo structure. The two structures are aligned based on the ECD domains of the adjacent β and α subunits. e, Comparison of each subunit between two-Fab-APG and previous apo structure based on global TMD structural alignment. f, Comparison of each TMD between two-Fab-APG and previous apo structure based on individual TMD structural alignment. RMSD values of the entire TMD domain and the M2-M3 loop are also shown. g, Structural overview of the two-Fab-ZOL. Two APG molecules are modeled based on the cryo-EM densities. h and i, Binding poses of APG in the two-Fab-ZOL structure. Cryo-EM density around APG is contoured at 5.1 σ. j, Structural overlay of the two-Fab-APG and two-Fab-ZOL based on the global TMD.

Comment in

References

    1. Barnard EA, et al. International Union of Pharmacology. XV. Subtypes of γ-aminobutyric acidA receptors: classification on the basis of subunit structure and receptor function. Pharmacol. Rev. 1998;50:291–313. - PubMed
    1. Olsen RW, Sieghart W. International Union of Pharmacology. LXX. Subtypes of γ-aminobutyric acidA receptors: classification on the basis of subunit composition, pharmacology, and function. Update. Pharmacol. Rev. 2008;60:243–260. doi: 10.1124/pr.108.00505. - DOI - PMC - PubMed
    1. Smart TG, Stephenson FA. A half century of γ-aminobutyric acid. Brain Neurosci. Adv. 2019;3:2398212819858249. doi: 10.1177/2398212819858249. - DOI - PMC - PubMed
    1. Sente A, et al. Differential assembly diversifies GABAA receptor structures and signalling. Nature. 2022;604:190–194. doi: 10.1038/s41586-022-04517-3. - DOI - PMC - PubMed
    1. Nemeroff CB. The role of GABA in the pathophysiology and treatment of anxiety disorders. Psychopharmacol. Bull. 2003;37:133–146. - PubMed

Publication types

MeSH terms