. 2023 Sep;621(7980):857-867.
doi: 10.1038/s41586-023-06549-9. Epub 2023 Sep 20.

Transgenic ferret models define pulmonary ionocyte diversity and function

Affiliations

Transgenic ferret models define pulmonary ionocyte diversity and function

Feng Yuan et al. Nature. 2023 Sep.

Abstract

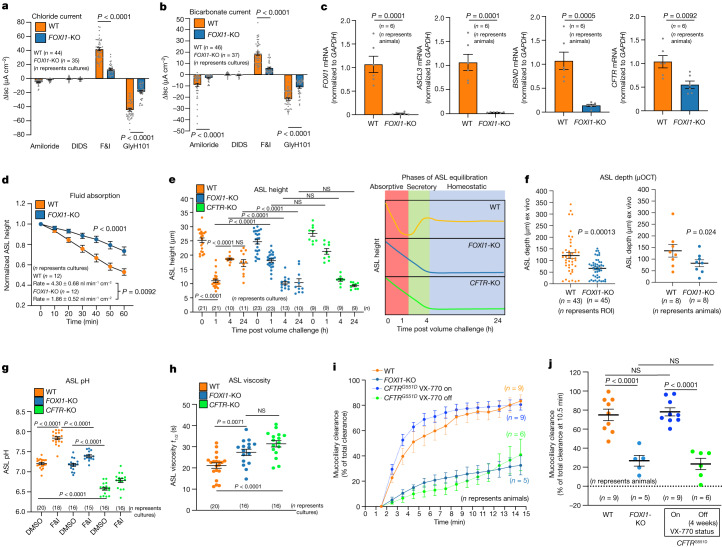
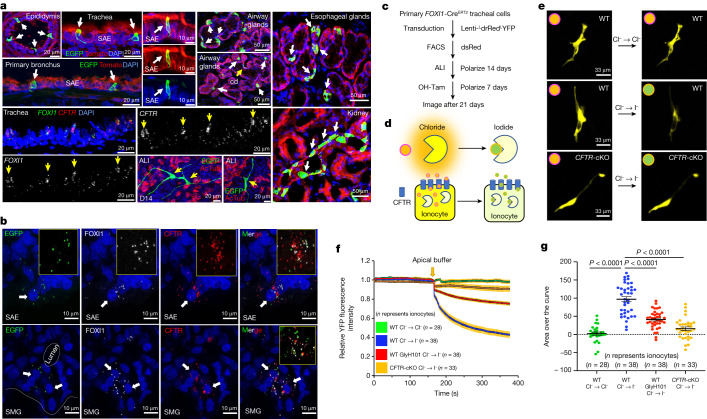
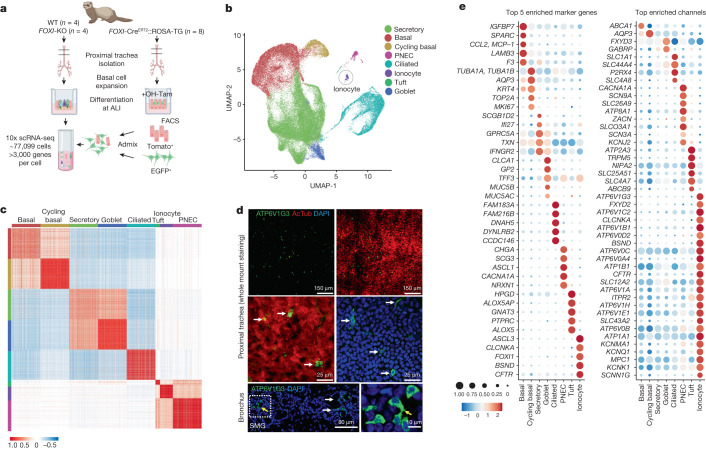
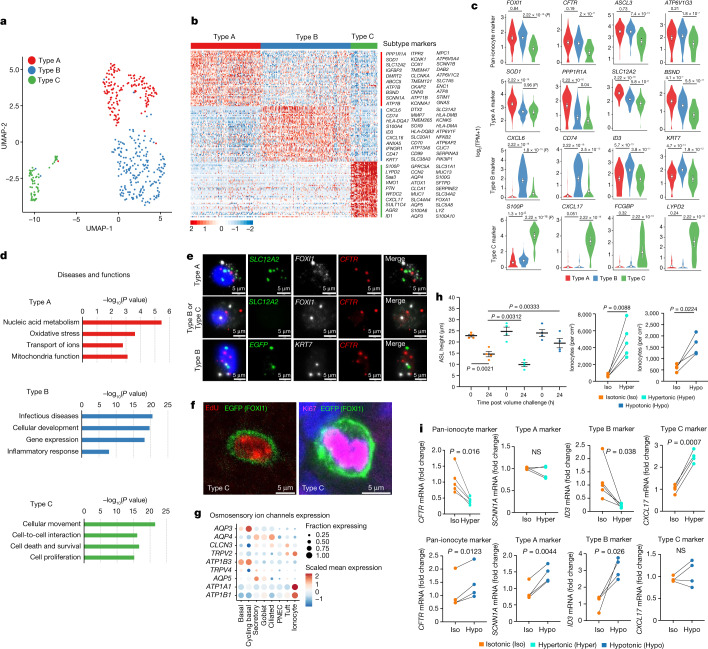
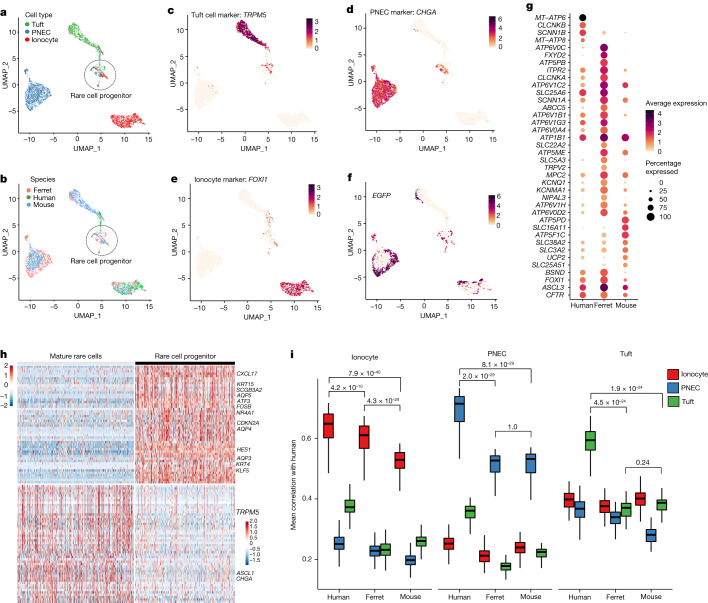
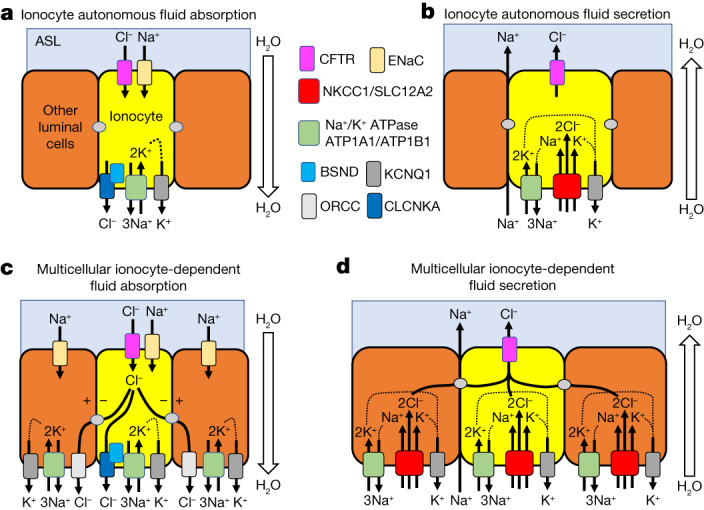
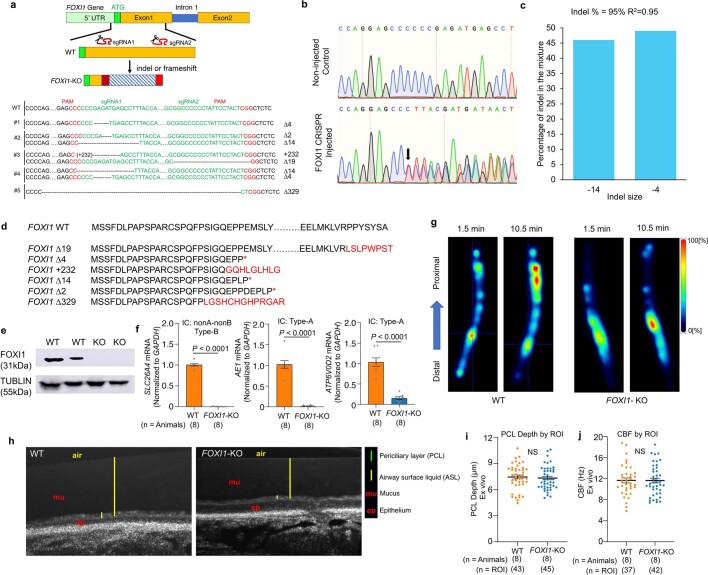
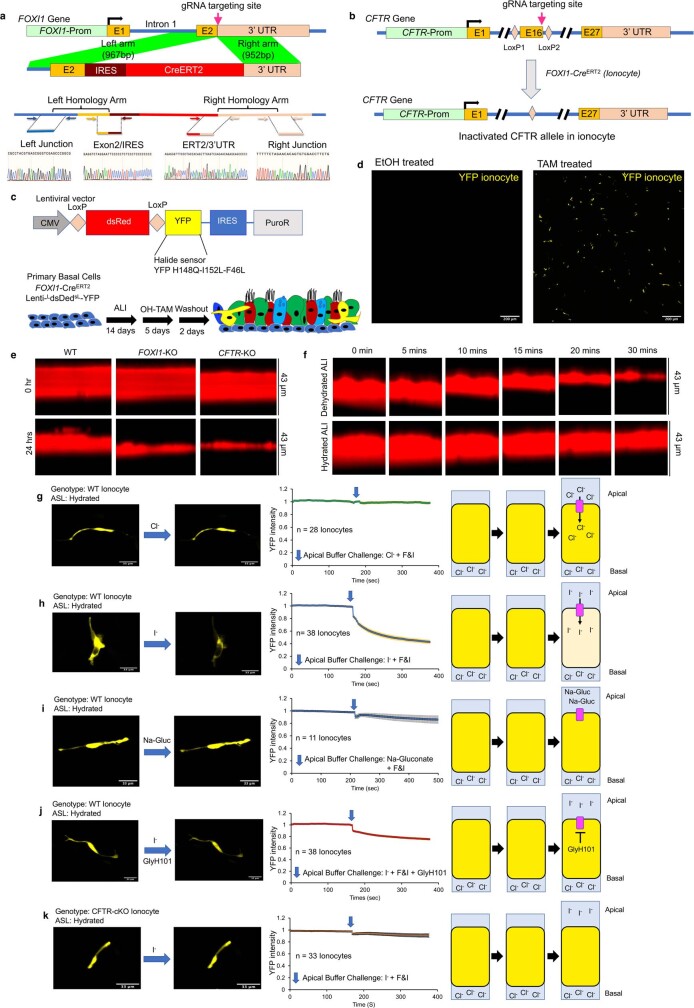
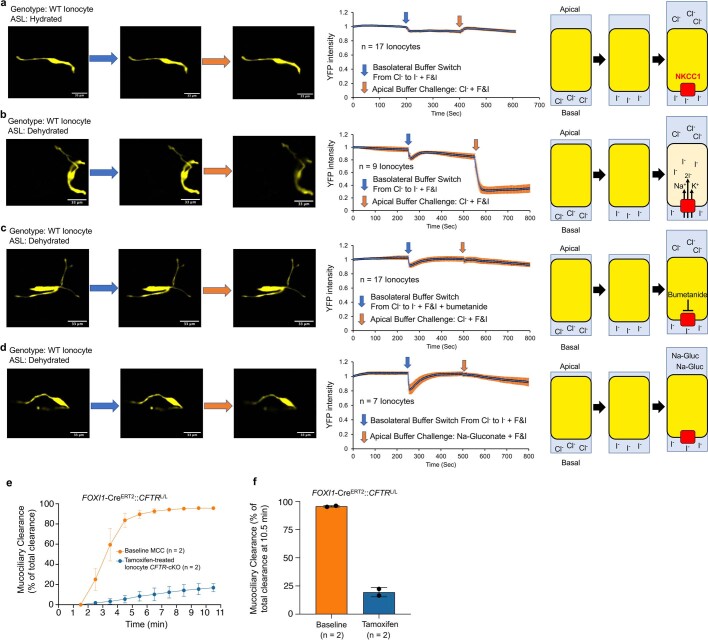
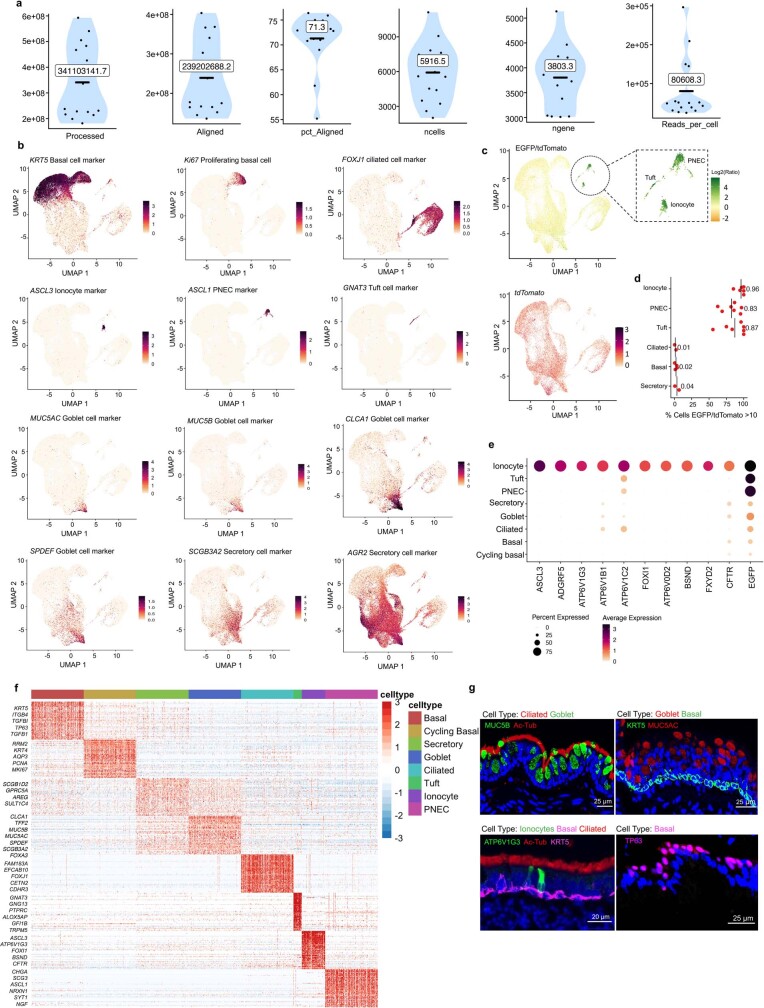
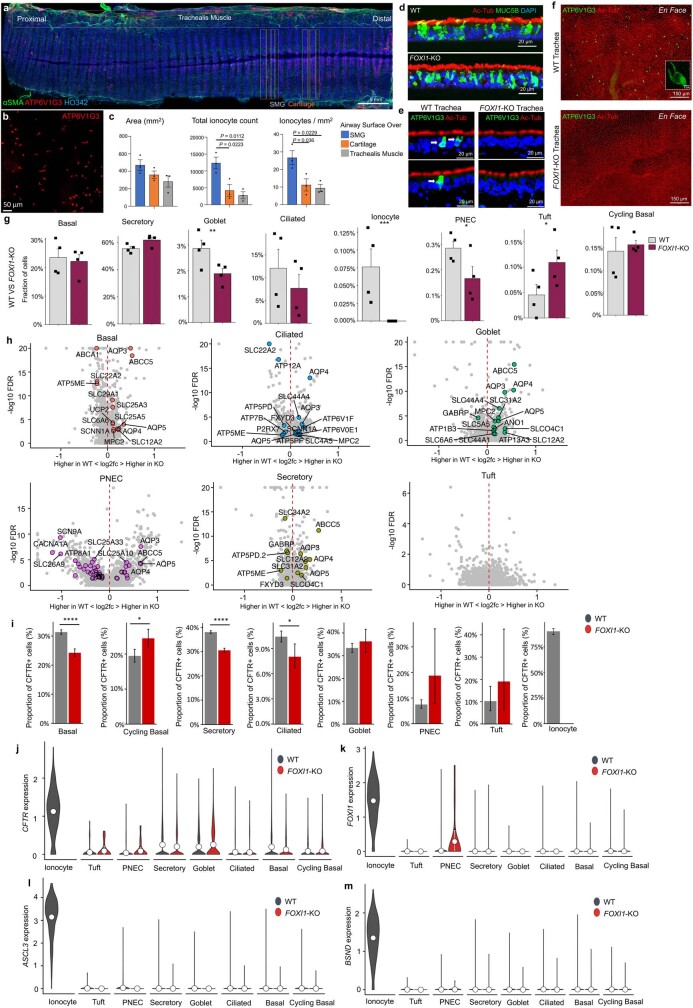
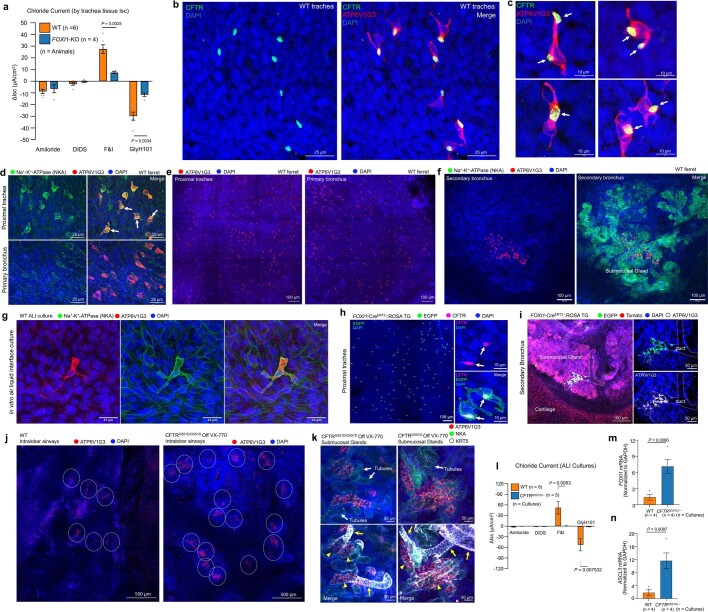
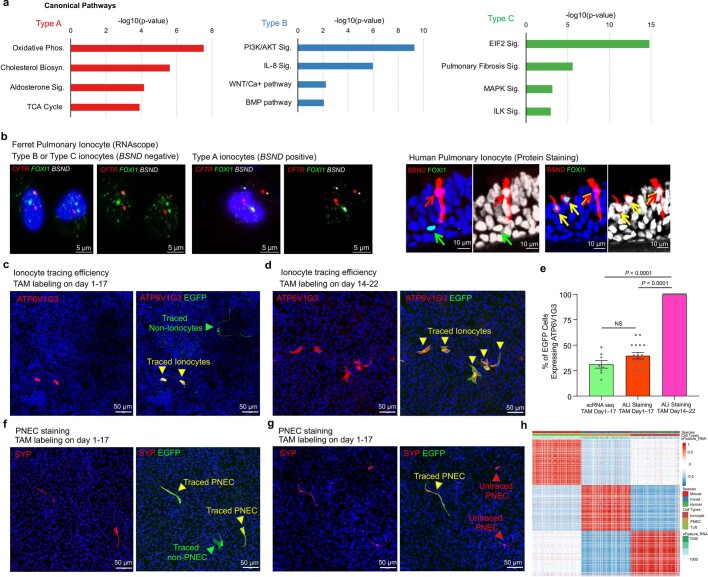
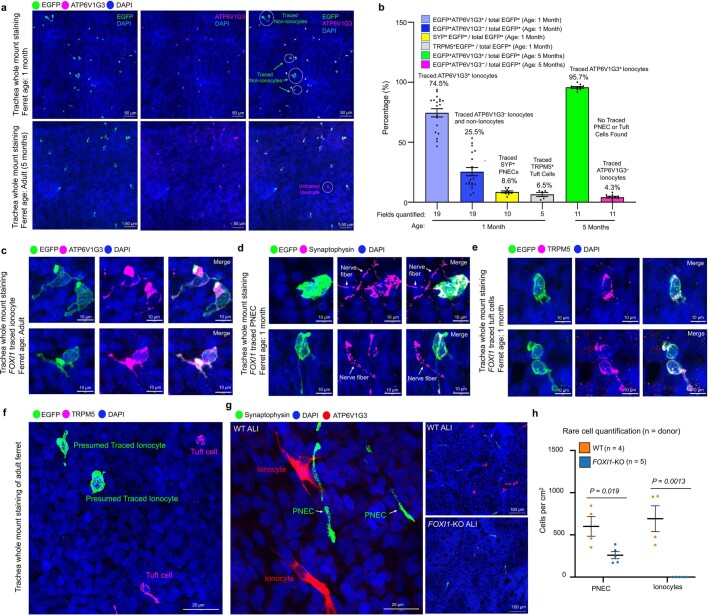
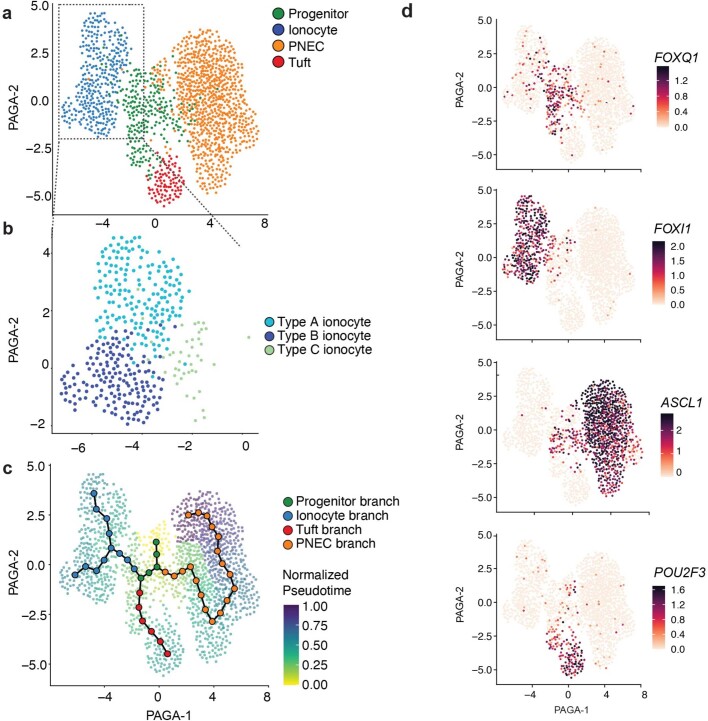
Speciation leads to adaptive changes in organ cellular physiology and creates challenges for studying rare cell-type functions that diverge between humans and mice. Rare cystic fibrosis transmembrane conductance regulator (CFTR)-rich pulmonary ionocytes exist throughout the cartilaginous airways of humans1,2, but limited presence and divergent biology in the proximal trachea of mice has prevented the use of traditional transgenic models to elucidate ionocyte functions in the airway. Here we describe the creation and use of conditional genetic ferret models to dissect pulmonary ionocyte biology and function by enabling ionocyte lineage tracing (FOXI1-CreERT2::ROSA-TG), ionocyte ablation (FOXI1-KO) and ionocyte-specific deletion of CFTR (FOXI1-CreERT2::CFTRL/L). By comparing these models with cystic fibrosis ferrets3,4, we demonstrate that ionocytes control airway surface liquid absorption, secretion, pH and mucus viscosity-leading to reduced airway surface liquid volume and impaired mucociliary clearance in cystic fibrosis, FOXI1-KO and FOXI1-CreERT2::CFTRL/L ferrets. These processes are regulated by CFTR-dependent ionocyte transport of Cl- and HCO3-. Single-cell transcriptomics and in vivo lineage tracing revealed three subtypes of pulmonary ionocytes and a FOXI1-lineage common rare cell progenitor for ionocytes, tuft cells and neuroendocrine cells during airway development. Thus, rare pulmonary ionocytes perform critical CFTR-dependent functions in the proximal airway that are hallmark features of cystic fibrosis airway disease. These studies provide a road map for using conditional genetics in the first non-rodent mammal to address gene function, cell biology and disease processes that have greater evolutionary conservation between humans and ferrets.


Conflict of interest statement

The authors declare no competing interests.

Figures

Fig. 1
Fig. 1. Depletion of pulmonary ionocytes impairs CFTR-mediated regulation of ASL volume, pH, viscosity and MCC.
a,b, Change in short circuit current (ΔIsc) for Cl (a) and HCO3 (b) from ferret ALI cultures of the indicated genotypes. F&I, forskolin and IBMX; WT, wild type. c, RT–qPCR for ionocyte-enriched transcripts in ferret ALI cultures. d, Fluid absorption showing the ASL height normalized to time zero following small volume addition to the apical surface. Fluid absorption rates are marked on the graph. e, Changes in ASL height over time following small volume challenge (at 0 h) to ALI cultures. Right schematic depicts absorptive and secretory phases of ASL equilibration that are altered in FOXI1-KO and CFTR-KO cultures. f, μOCT imaging of ferret tracheal ASL depth. ASL depths were compared by region of interest (ROI) and animal averages. g, Alkalinization of ASL pH in ALI cultures following CFTR stimulation with forskolin/IBMX. h, ASL viscosity in ALI cultures. i, In vivo ferret tracheal MCC measured by PET/CT for the indicated genotypes and CFTR modulator (VX-770) treatment status. j, Percentage tracheal clearance at 10.5 min following instillation of radioactive tracer for ferrets evaluated in h. Data are mean ± s.e.m. for the n indicated in each graph (ALI cultures or animals). Statistical significance was determined by: one-way analysis of variance (ANOVA) and Sidak’s multiple comparisons test (ac); two-way ANOVA for graphed genotypic differences and two-tailed Student’s t-test for rates (d); one-way ANOVA and Tukey’s multiple comparison test (e,g,h,j); ROI by t-tests with pooled s.d. by R and animal averages by paired one-tailed Student’s t-test (f). The numbers of independent ferrets used for each experiment were: 12 WT, 9 FOXI1-KO (a); 10 WT, 8 FOXI1-KO (b); 6 in each group (c,d); 9 WT, 10 FOXI1-KO, 3 CFTR-KO (e); 8 in each group (f); 6 WT, 5 FOXI1-KO, 4 CFTR-KO (g); 6 WT, 4 FOXI1-KO, 3 CFTR-KO (h); 9 WT, 5 FOXI1-KO, 9 CFTR (i, j). DIDS, 4,4′-diisothiocyanato-stilbene-2,2′-disulfonic acid; NS, not significant; RT–qPCR, quantitative PCR with reverse transcription. Source Data
Fig. 2
Fig. 2. Pulmonary ionocytes directly transport anions in a CFTR-dependent manner.
a, Ionocyte lineage tracing in tamoxifen-induced FOXI1-CreERT2::ROSA-TG ferrets showing EGFP+ ionocytes (white arrows) in the seminiferous tubules of the epididymis, surface airway epithelium (SAE), airway submucosal glands (SMGs), kidney tubules, oesophageal glands and ALI cultures (14 days of differentiation). cd, airway SMG collecting duct. Bottom left panels show RNAscope for FOXI1 and CFTR in the trachea. Representative image of n = 3 independent ferrets. b, RNAscope demonstrating colocalization of EGFP, FOXI1 and CFTR transcripts in proximal tracheal SAE and SMGs of tamoxifen-treated FOXI1-CreERT2::ROSA-TG ferrets. Arrows mark traced ionocytes. Representative image of n = 3 independent ferrets. c, Workflow for halide quenching measurements in primary ALI cultures of YFP sensor-expressing pulmonary ionocytes. d, Schematic of approach for evaluating apical halide movement into pulmonary ionocytes using the YFP sensor. e, Representative live-cell images showing pulmonary ionocyte YFP fluorescence following the indicated apical halide exchange in WT and CFTR-cKO ALI cultures. The halide colour scheme is from d. Representative image of n = 99 ionocytes. f, Relative single-cell ionocyte YFP fluorescence intensity data following apical halide exchange for the indicated ALI genotype (n represents ionocytes): n = 28 (WT, Cl); n = 38 (WT, I); n = 38 (WT, GlyH101, I); n = 33 (CFTR-cKO, I). Each group has three ferret donors. g, Area over the curve of relative single-cell ionocyte YFP fluorescence intensity for the data presented in f. Data are mean ± s.e.m. P values for the indicated comparisons were determined by one-way ANOVA and Tukey HSD posttest using R. Source Data
Fig. 3
Fig. 3. Single-cell expression atlas of ferret proximal airway epithelial cells.
a, Study overview for scRNA-seq and ionocyte enrichment. Created with BioRender.com. b, UMAP of total tracheal epithelial cells captured across all ferret genotypes (WT, FOXI1-KO and FOXI1-CreERT2::ROSA-TG), coloured by broad cell type. c, Cell–cell Pearson correlation coefficient (r, colour bar) between each pair of cells (large clusters down-sampled to 200 cells for visualization). d, Top, ferret tracheal whole-mount immunostained for ATP6V1G3 (ionocyte) and AcTub (ciliated cells). Bottom, immunofluorescence staining of ferret intralobar bronchial SMGs for ATP6V1G3 (ionocyte). White arrows mark pulmonary ionocytes. Representative image of n = 3 independent ferrets. e, Top five enriched marker genes (left) and top enriched channels (right), showing the expression levels and fraction of each cell type that expresses them.
Fig. 4
Fig. 4. Distinct subtypes of pulmonary ionocytes exist and respond to osmotic stress.
a, UMAP of 449 ionocytes coloured by subcluster. b, Type A, B and C ionocyte gene expression signatures showing relative expression (Z-score of log2(TPM + 1)). c, Distribution of expression levels (log2(TPM + 1)) for ionocyte subtype markers (white circle, mean; error bars, 95% confidence interval; n = 449 ionocytes from 8 donors; P value, Wilcoxon). d, Ingenuity pathway analysis of differentially expressed ionocyte subtype genes showing top significantly associated diseases and functional pathways (right-tailed Fisher’s exact test). e, RNAscope validation of ionocyte subtypes using cytospun samples from ALI cultures. Representative image of n = 36 ionocytes. f, Differentiated FOXI1-CreERT2::ROSA-TG ALI cultures induced with OH-Tam and later pulsed-labelled with EdU. Cultures were then stained for Ki67 or EdU. Representative image of n = 20 ionocytes. g, Osmosensory ion and water channel gene expression in different cell types. h, Hyperosmotic and hypoosmotic conditions induce opposing forces on ASL hydration. Left, differentiated ALI cultures were exposed to hyperosmotic (+77 mOsm) and hypoosmotic (−77 mOsm) basolateral media for 24 h and ASL height was measured at 0 and 24 h following small volume addition to the apical surface. Data are mean ± s.e.m. Statistical significance by paired two-tailed Student’s t-test (n = 4 donors, each using 2 cultures). Right, quantification of ionocyte numbers in 21 days ALI cultures maintained under hyperosmotic and hypoosmotic conditions throughout basal cell differentiation. Data are mean ± s.e.m. Statistical significance by paired two-tailed Student’s t-test (hyperosmotic: n = 5 donors, 1 culture per donor, quantified as FOXI1-CreERT2 EGFP+ cells; hypoosmotic: n = 4 donors, each using 2–3 cultures, quantified as ATP6V1G3+ cells). i, Changes in subtype marker gene expression by RT–qPCR in ALI cultures maintained under hypoosmotic or hyperosmotic stress as in h. mRNA fold change was calculated by the ΔΔCt method. Statistical significance was determined by paired two-tailed Student’s t-test (n = 4 donors, each using 3 cultures). TPM, transcripts per million. Source Data
Fig. 5
Fig. 5. Rare cell-type comparisons from the proximal airway epithelium of human, ferret and mouse.
a, UMAP of rare cell type transcriptomes across human, ferret and mouse, coloured by rare cell type (tuft, neuroendocrine/PNEC, ionocyte). b, UMAP of rare cell types across human, ferret and mouse, coloured by species. c, Expression of rare cell-type markers across rare cell clusters. UMAP plot shows cells coloured by expression (log2(TPM + 1), colour bar) of tuft marker TPRM5. d, UMAP plot shows cells coloured by expression of PNEC marker CHGA. e, UMAP plot shows cells coloured by expression of ionocyte marker FOXI1. f, UMAP plot of EGFP expression marks FOXI1-CreERT2::ROSA-TG lineage-labelled cells from ferret ALI scRNA-seq experiments including the common rare cell progenitor. g, Ion channel gene expression levels and fraction of ionocytes that express each gene across human, ferret and mouse (MT-ATP6, MT-ATP8, ATP5PD and CLCNKB are not annotated in ferret genome and thus show no expression). h, Gene expression signatures of rare cell progenitors compared with mature rare cells. i, Interspecies comparison of mouse and ferret rare cell-type transcriptional signatures with those of human. Ferret ionocytes are transcriptionally more similar to human ionocytes. Boxplots are standard: lower and upper hinges correspond to the first and third quartiles (the 25th and 75th percentiles), and the upper and lower whiskers extend from the hinge to the largest or smallest values, respectively, no further than 1.5 × IQR from the hinge where IQR is the interquartile range or distance between the first and third quartiles. Centre shows the mean. Statistical significance was determined by Wilcoxon test for the marked comparisons. n = 1,655 cells from 12 ferret donors, n = 1,640 cells from 9 mice donors, n = 885 cells from 60 human donors. Source Data
Fig. 6
Fig. 6. Models for pulmonary ionocyte anion transport function in a multicellular airway epithelium.
a,b, Pulmonary ionocytes (yellow) function in a cell-autonomous manner to facilitate anion movement across airway epithelia required for fluid absorption (a) and fluid secretion (b). c,d, Multicellular ionocyte-dependent anion movement utilizing electric coupling through gap junctions to facilitate fluid absorption (c) and fluid secretion (d). The second models propose that Na+ and K+ electrical driving forces in cells coupled to ionocytes collectively drive Cl absorption and secretion through CFTR in pulmonary ionocytes. In both models, the ionocyte channels shown were differentially enriched in the pulmonary ionocyte transcriptome. ORCC, outward rectifying Cl channel.
Extended Data Fig. 1
Extended Data Fig. 1. FOXI1 deletion impairs kidney intercalated cell formation and mucociliary clearance in ferrets.
a, Schematic of the approach to generate FOXI1-KO ferrets by Cas9/sgRNA RNP injection of zygotes. Bottom, sequence of the founder indel insertions (+) and deletions (∆) with gRNA sequence (green) and PAM sequence (red) shown. b, Representative sequence chromatograms of the DNA target site from non-injected (control) and FOXI1 RNP-injected zygotes (black arrow indicates cleavage site). c, Representative TIDE analysis from a compound heterozygous FOXI1-KO (−14/−4) founder ferret showing percentage of DNA editing for each indel size. d, Predicted amino acid sequence of ferret FOXI1 in wild-type (top) and FOXI1-KO founders (bottom). Asterisks indicates a premature stop codon found in the coding sequence of FOXI1 mutants. Red letters indicate frameshift mutation caused by indels. e, Kidney tissue lysates from FOXI1-KO and WT animals were collected and subjected to Western blotting with FOXI1 antibody. Representative samples show the absence of FOXI1 protein in KO animal kidney tissues. f, RT-qPCR of kidney mRNA showing absent or reduced intercalated cell (IC) marker (SLC26A4, AE1, ATP6V0D2) expression in FOXI1-KO ferrets. Mean ± s.e.m.; n = 8 animals in each group. g, Representative 68Ga-MAA PET/CT images of FOXI1-KO and WT ferret trachea at the indicated time points showing reduced clearance in FOXI1-KO. h, Micro-optical coherence tomography (μOCT) imaging of FOXI1-KO and WT ferret tracheal explants. Images show airway surface liquid (ASL; yellow bar), mucus layer (mu), and periciliary liquid (PCL; green bar) on the luminal surface. Analysis of μOCT images from explanted ferret trachea yields numerical values for functional and anatomic parameters. i,j, PCL depths (i) and ciliary beat frequency (CBF) (j) were analyzed geometrically as shown in bar graph. Mean ± s.e.m.; n = 8 animals in each group. Statistical significance was determined by: (f) two-tailed Student’s t-test and (i,j) ROI using t-tests with pooled SD by R, statistical test was two-sided. Source Data
Extended Data Fig. 2
Extended Data Fig. 2. FOXI1-CreERT2 and CFTR conditional KO (CFTRL/L) ferret models demonstrate CFTR is required for ionocyte apical uptake of anions.
CRISPR homology-directed repair (HDR) was used to generate FOXI1-CreERT2 and CFTRL/L ferrets. a, Schematic of the strategy for generating transgenic ferrets with an IRES-CreERT2 insertion in the FOXI1 3’-UTR. b, Schematic of the floxed exon-16 in CFTRL/L ferrets and strategy for deletion of CFTR in FOXI1-CreERT2::CFTRL/L (CFTR-cKO) ferrets. c, Primary FOXI1-CreERT2 airway basal cells transduced with a lentivirus encoding LoxP-dsRED-stop-LoxP-YFP-H148Q/I152L cassette (herein called FOXI1-CreERT2::YFPH148Q/I152L) and differentiated at ALI, treated with hydroxy-tamoxifen (OH-Tam) and then used for functional studies of halide transport. d, Scattered YFP-positive ionocytes were observed in the pseudostratified airway epithelium of only OH-Tam treated differentiated FOXI1-CreERT2::YFPH148Q/I152L ALI airway cultures. Representative images from 3 independent ferret donors. e, Representative images of ASL height from differentiated WT, CFTR-KO, and FOXI1-KO ALI cultures challenged with 18 μl of Alexa-dye containing buffer (time zero) and following equilibration 24 hrs later. Representative images from n = 11 (WT), n = 10 (FOXI1-KO) and n = 9 (CFTR-KO) independent cultures. f, Dehydration experiment on WT ALI cultures monitoring the ASL height following apical perfusion of non-humidified 5% CO2 for the indicated times. 20 min of dehydration was chosen for basolateral halide sensor assays (Extended Data Fig. 3) since the ASL height approached that observed CFTR-KO and FOXI1-KO cultures. Representative images from 3 independent experiments. g–k, Representative images and traces of apical I uptake in YFP halide sensor expression ionocytes of ALI cultures. g, No YFP quenching is observed in WT ionocytes after the addition of apical Cl buffer (18 μl) with Forskolin/IBMX (F&I) to stimulate CFTR (negative control). Mean ± s.e.m.; n = 28 ionocytes. h, YFP quenching is observed in WT ionocytes following the addition of apical I buffer with F&I. Mean ± s.e.m.; n = 38 ionocytes. i, YFP quenching, as shown in (h), is not observed following the addition of apical Na-Gluconate (Na-Gluc) buffer with F&I (negative control). Mean ± s.e.m.; n = 11 ionocytes. j, YFP quenching, as shown in (h), is reduced following the addition of apical I buffer, F&I, and GlyH101 CFTR inhibitor (negative control). Mean ± s.e.m.; n = 38 ionocytes. k, YFP quenching is not observed in CFTR-cKO ionocytes (FOXI1-CreERT2::CFTRL/L) following application of apical I buffer with F&I. Mean ± s.e.m.; n = 33 ionocytes. Source Data
Extended Data Fig. 3
Extended Data Fig. 3. NKCC1 is required for ionocyte basolateral uptake of anions.
Representative images and traces of basolateral I uptake in YFP halide sensor expression ionocytes of ALI cultures. a, Basolateral Cl to I buffer exchange in the presence of forskolin/IBMX (F&I) does not lead to ionocyte YFP quenching in homeostatic apically-hydrated cultures at baseline or following apical Cl buffer addition (18 μl) with F&I. Mean ± s.e.m.; n = 17 ionocytes. b, In apically-dehydrated cultures, basolateral Cl to I + F&I buffer exchange leads to basolateral I uptake, but only after apical Cl buffer addition with F&I. Mean ± s.e.m.; n = 9 ionocytes. c, Basolateral I uptake by ionocyte, as shown in (b), requires the NKCC1 channel and is blocked by bumetanide. Mean ± s.e.m.; n = 17 ionocytes. d, Basolateral I uptake by ionocyte, as shown in (b), requires apical Cl and is not observed after apical Na-gluconate (Na-Gluc) buffer addition with I&F. Mean ± s.e.m.; n = 7 ionocytes. e,f. In vivo tracheal mucociliary clearance (MCC) measured by 68Ga-MAA PET-CT in FOXI1-CreERT2::CFTRL/L ferrets prior to and following CFTR deletion with tamoxifen (n = 2 animals, range in values is shown on both graphs). Source Data
Extended Data Fig. 4
Extended Data Fig. 4. Single-cell expression atlas of ferret proximal airway epithelial cells.
a, Quality metrics for droplet-based 3′ scRNA-seq data. b, Cluster annotation by the expression of known cell type markers. UMAP visualization of 77,099 single cells where individual points correspond to single cells. c, UMAP visualization of EGFP/tdTomato (ratio) and tdTomato expression for all cells sequenced. Note, FOXI1-CreERT2::ROSA-TG ALI cultures used for ionocyte enrichment were treated with OH-Tam throughout basal cell differentiation at ALI. This leads to lineage labeling (EGFP expression) and enrichment by FACS of all rare cell types (ionocytes, tuft, and PNECs). Thus, FOXI1 is expressed in common early precursor of these rare cell types. d, Percentage of cells with a ratio of EGFP/tdTomato greater than 10. e, Ferret pulmonary ionocyte markers. Expression level of ionocyte marker genes (columns) in each airway epithelial cell type (rows). Note that EGFP+ FOXI1-lineage labeled tuft and PNECs extinguish FOXI1 and other ionocyte markers when fully differentiated. f, Ferret airway epithelial cell gene expression signatures. The relative expression of genes (rows) across cell types (columns) is shown, sorted by cell types. g, Cell type marker immunostaining of ferret tracheal sections for different cell clusters. Representative images of n = 3 independent ferrets.
Extended Data Fig. 5
Extended Data Fig. 5. Channelome of all ferret proximal airway cell types.
mRNA expression levels for all ion and water channels and gap junctional genes are listed for the various airway cell types regardless of whether they are differentially expressed. Plots show the mean relative expression level (unnormalized between genes) and the percentage of cells that express each gene.
Extended Data Fig. 6
Extended Data Fig. 6. Ion and water channels are transcriptionally altered in FOXI1-KO airway epithelia.
a, Cleared WT ferret trachea was whole mount immunostained for ionocyte (ATP6V1G3) and submucosal gland (α-SMA) markers. Boxed areas show examples of regions quantified for ATP6V1G3+ ionocyte numbers in the surface airway epithelia above submucosal glands (SMG), cartilage, and trachealis muscle. b, Higher magnification of the tracheal surface showing single channel ATP6V1G3+ ionocytes. Representative images of n = 3 donors. c, Quantification of ionocyte numbers in the surface airway plane in different regions of ferret trachea from WT animals (the entire trachea was quantified, n = 3 WT donors). Bar graph showing the total area quantified, the total number of ionocytes, and the number of ionocytes per mm2. Graphs show the mean ± s.e.m. Statistical significance was determined by two-tailed Student’s t-test. d, Sections of ALI cultures of WT and FOXI1-KO airway epithelia immunostained for Ac-Tub (ciliated cells) and MUC5B (goblet cells). Representative images of n = 4 ferrets from each group. e,f, Immunostaining of (e) tracheal sections and (f) whole-mount trachea from WT and FOXI1-KO ferrets for ATP6V1G3 (ionocytes) and Ac-Tub (ciliated cells). Ionocytes (arrows) are depleted in FOXI1-KO ferrets. Representative images of n = 4 ferrets from each group. g, Cell type proportions across WT and FOXI1-KO scRNA-seq runs (Mean +/− s.e.m.; n = 4 donors each genotype, excluding FOXI1-CreERT2::ROSA-TG ionocyte enriched samples). Statistical significance was determined by Bayesian analysis: goblet cells, ** FDR < 0.01, 95% PI; ionocyte, *** FDR < 0.001, 99% PI; Tuft and PNEC, * FDR < 0.05, 90% PI. h, Volcano plots of differential channel expression within various epithelial cell types derived from WT and FOXI1-KO ALI cultures. i, The proportions of CFTR expressing basal, secretory, and ciliated cells is reduced in FOXI1-KO cultures as compared to WT culture (including FOXI1-CreERT2::ROSA-TG ionocyte enriched samples). This may be due to lower levels of ambient CFTR RNA from lysed ionocytes. Data shows the mean, n = 4 donors in KO, n = 12 donors in WT, error bars represent 95% confidence interval, **** FDR < 0.0001, * FDR < 0.05. The proportion of CFTR expressing cells per cell type were calculated by aggregating cells from all samples together (see Methods). j-m, Expression of ionocyte markers CFTR, ASCL3, FOXI1 and BSND in different cell types from WT and FOXI1-KO cultures. Data shows the mean, n = 18,664 cells from 4 FOXI1-KO donors, n = 58,435 cells from 8 WT donors. Large white point shows the mean, error bars represent 95% confidence interval. Of note, deletion of a portion of FOXI1 exon-1 led to enhanced mRNA expression from the FOXI1 locus only in PNECs, suggesting a potential functional role for FOXI1 in PNECs. The FOXI1 gene has only two exons and thus its mRNA likely has minimal non-sense mediated decay. Source Data
Extended Data Fig. 7
Extended Data Fig. 7. Pulmonary ionocyte function and localization pattern at different levels of the airway.
a, Change in chloride short circuit current (ΔIsc) from FOXI1-KO and WT trachea following the addition of the indicated channel antagonists and agonists (n = 6 donors for WT, 4 donors for KO, with 2-3 tracheal samples quantified from each donor and averaged). F&I, forskolin and IBMX. Graph shows the mean ± s.e.m. P value determined by two-tailed Student’s t-test. b, CFTR protein localization in ATP6V1G3+ ionocytes following whole mount staining of WT ferret trachea. Representative images from n = 4 ferrets. c, High magnification images of ATP6V1G3+ ionocytes showing CFTR protein localizes to an “apical cap” (arrows). Representative images of ionocytes with two apical caps (upper panels) or one apical cap (lower panels) are shown. Images from n = 4 ferrets. d, Na+-K+-ATPase (NKA) staining of ATP6V1G3+ ionocytes in the proximal trachea of WT ferret by whole mount staining. NKA staining in ionocytes localized to an apparent basolateral rim around the apical cap (marked by arrows). Proximal trachea showed more abundant NKA expression in ionocytes as compared to primary bronchus. Representative images from n = 4 ferrets. e, Representative whole mount images showing the frequency of ATP6V1G3+ ionocytes in the proximal trachea and primary bronchus of WT ferrets. Images from n = 4 ferrets. f, Representative whole mount images showing clusters of ATP6V1G3+ ionocytes in NKA+ submucosal glands in the secondary bronchus of WT ferrets. Images from n = 4 ferrets. g, Co-localization of ATP6V1G3 and NKA in ionocytes of WT ferret ALI cultures. Representative images from cultures derived from n = 3 donors. h, Representative whole mount image of a tamoxifen-induced adult FOXI1-CreERT2::ROSA-TG ferret trachea demonstrating CFTR staining within an apical cap (arrows) of EGFP+ ionocytes. Images from n = 3 ferrets. i, Representative image of a tamoxifen-induced adult FOXI1-CreERT2::ROSA-TG ferret secondary bronchus demonstrating traced EGFP+ATP6V1G3+ ionocytes in a submucosal gland collecting duct (marked by dotted lines). Images from n = 3 ferrets. j, Localization of ATP6V1G3+ ionocytes in whole mount stained intralobar airways from a WT and CFTRG551D/G551D (reared off VX-770) ferrets, demonstrating expansion of ionocyte clusters (circles) in the CF airway. Images from n = 4 (WT) and n = 3 (CF) ferrets. k, Localization of ATP6V1G3+ ionocytes in KRT5+-enriched gland primary ducts (yellow arrows), adjacent NKA+ collecting ducts (yellow arrowheads), and NKA+ glands tubules (white arrows) in CFTRG551D/G551D (reared off VX-770) ferrets (whole mount staining of intralobar bronchus). Images from n = 3 (CF) ferrets. l, CFTR-mediated chloride current from WT and CFTRG551D/ ALI cultures (n = 5-6 ALI cultures derived from one donor). Graph shows the mean ± s.e.m. P value determined by one-tailed Student’s t-test. m and n, RT-qPCR detection of mRNA for ionocyte-specific transcription factors (FOXI1, ASCL3) in differentiated WT and CFTRG551D/ ALI cultures demonstrating expansion of ionocytes in CF epithelium (n = 4 samples from one donor, each sample with 3 ALI cultures pooled for mRNA). Graphs show the mean ± s.e.m for the n indicated in each graph. P value determined by by two-tailed Student’s t-test. Source Data
Extended Data Fig. 8
Extended Data Fig. 8. Osmotic stress in ALI cultures and a CF disease state in vivo induced ionocyte expansion.
a and b, Hyperosmotic (a) and hypoosmotic (b) ALI culture conditions induce ionocyte expansion. Ionocytes were localized either by lineage tracing using FOXI1-CreERT2 or ATP6V1G3 staining. Representative images of cultures derived from n = 5 donor ferrets for hyperosmotic stress and n = 4 ferrets for hypoosmotic stress. c and d, Additional panels related to Extended Data Fig. 7k. Whole mount trachea immunostaining demonstrating expanding ATP6V1G3+ ionocytes in KRT5+-enriched submucosal gland (SMG) ducts and NKA+ tubules of CFTRG551D/G551D ferrets (reared off VX-770). Confocal Z planes are indicated and show apical surface to SMG planes (c) or just the SMG plane (d). DO, duct opening. Representative images from n = 3 CF ferrets.
Extended Data Fig. 9
Extended Data Fig. 9. Ambient RNA from fragile ionocytes enhances apparent CFTR expression in other cell types.
a, Expression (mean UMI counts, y-axis) of ionocyte markers CFTR, FOXI1, ASCL3, CLCNKA, BSND, ATP6V1C2 (rows) in cells of each type (columns) from each ALI culture (points) correlated with the number of ionocytes detected in each culture (x-axis), particularly in secretory cells. These data include FOXI1-KO and FOXI1-CreERT2::ROSA-TG FACS-enriched sequence runs, which had the smallest and largest percentage of ionocytes, respectively. Blue line and shaded area show line of best fit and 95% confidence interval, respectively, from linear regression models fit independently for each gene. P values by Wald test. b, Dotplots show the Pearson’s R correlation (dot color, legend) and significance (dot size, legend) between proportion of ionocytes detected and expression level (as in Extended Data Fig. 6i) for the top 30 basal cell markers (rows, left) and top 30 ionocyte markers (rows, right). Genes are ordered by expression level, which is shown on left hand barplots with log2(TPM + 1) on the x-axis. In secretory cells, 21 of the top 30 ionocyte markers show a significant positive correlation, whereas only 1 of 30 basal cell markers was significant. P values: Wald test on linear regression models fit independently for each gene, no multiple hypothesis adjustment was performed since only 30 genes were tested for each panel (left, right).
Extended Data Fig. 10
Extended Data Fig. 10. FOXI1 lineage basal cells differentiate into multiple rare cell types in vitro.
a, Ingenuity Pathway Analysis (IPA) of differential gene expression data from ionocyte subtypes. The charts represent the top significantly associated canonical pathways. P value was calculated using a right-tailed fisher’s exact test. b, (Left) RNAscope validation of Type A, Type B or Type C ionocytes from a cytospun ferret ALI culture. Representative images of n = 10 ionocytes. (Right) Immunofluorescence validation of Type A, Type B or Type C ionocytes in a section of human ALI culture. BSND positive ionocytes are Type A subtype, some of which co-express FOXI1 (yellow arrows) or lack FOXI1 expression (red arrows). BSND negative ionocytes that express FOXI1 (green arrows) are Type B or Type C subtype. Intermediated expression of FOXI1 in BSND positive cells is marked by overlapping yellow and red arrows. Right panels show nuclei in white to demarcate the cell more clearly. Representative images of n = 7 ALI cultures. c,d, Lineage tracing of FOXI1-CreERT2::ROSA-TG ALI culture following hydroxytamoxifen (TAM) treatment on (c) day 1–17 or (d) day 14–22 produce different proportions of EGFP+ATP6V1G3+ ionocytes and EGFP+ATP6V1G3 other rare cell types. Yellow and green arrowheads indicate traced ionocytes or traced non-ionocytes, respectively. Representative image from n = 16 independent samples from TAM day 1–17 group and n = 15 independent samples from TAM day 14–22 group. e, Percentage of FOXI1-CreERT2 traced EGFP+ cells that also expressed ATP6V1G3 from scRNA-seq and the two TAM treatment protocols (Mean ± s.e.m.; n = 8 independent samples in scRNA-seq group, n = 16 independent samples from 4 different animals in ALI TAM Day 1–17 group, n = 15 independent samples from 4 different animals in ALI TAM Day 14–22 group; P value determined by one-way ANOVA and Tukey’s multiple comparisons test). f,g, Lineage tracing of PNECs in actively differentiating FOXI1-CreERT2::ROSA-TG basal cells treated with TAM on day 1–17 of ALI culture. Cultures were immunostained with PNEC marker SYP on day 21. Yellow, red, and green arrowheads indicate traced PNEC, untraced PNEC, or traced non-PNEC, respectively. Representative image of 11 independent cultures. h, Cell-cell Pearson correlation coefficient matrix (r, color bar) across species (human, mouse, ferret) ordered by cluster assignment (tuft, PNEC, ionocyte). Source Data
Extended Data Fig. 11
Extended Data Fig. 11. FOXI1-lineage rare cell progenitor has the capacity to generate ionocytes, PNECs, and tuft cells in vivo.
a, Confocal images of lineage-traced trachea following 5 sequential tamoxifen injections in FOXI1-CreERT2::ROSA-TG ferrets at 1 or 5 months of age (harvested one week after the last tamoxifen injection). Traced EGFP+ATP6V1G3+ ionocytes and EGFP+ATP6V1G3 non-ionocyte were identified in one month old trachea (upper panel). In adult FOXI1-CreERT2::ROSA-TG ferret trachea, only traced EGFP+ATP6V1G3+ ionocytes were observed (lower panel). Representative images from n = 3 independent ferrets were traced in each group. b, Percentage of FOXI1-CreERT2 labeled EGFP+ cells in the trachea for the indicated phenotypic classifications following colocalization with markers for ionocytes (ATP6V1G3), PNEC (synaptophysin/SYP), and tuft cells (TRPM5) at 1 and 5 months of age (Mean ± s.e.m.; n = 3 ferrets quantified for each age; each datapoint represents quantification from a 1.41 mm2 area for the number of fields indicated). Lineage tracing of 1 month old FOXI1-CreERT2::ROSA-TG ferrets demonstrated FOXI1-lineage cells (EGFP+) were composed of ionocytes (74.5%), PNEC (8.6%) and tuft cells (6.5%). Lineage tracing of 5 month old (adult) FOXI1-CreERT2::ROSA-TG ferrets demonstrated 95.7% of FOXI1-lineage cells (EGFP+) were ATP6V1G3+ ionocytes. The 4.3% EGFP+ATP6V1G3 cells in adult animals is consistent with a small fraction of mature ionocytes (~4%) expressing no ATP6V1G3 by scRNAseq. c, Maximum intensity projection of traced EGFP+ATPV61G3+ pulmonary ionocytes from adult FOXI1-CreERT2::ROSA-TG ferret trachea. Representative image from n = 3 ferrets. d, Maximum intensity projection of traced EGFP+SYP+ PNECs from one month old FOXI1-CreERT2::ROSA-TG ferret trachea. Images show sensory nerves associated with PNECs. Representative image from n = 3 ferrets. e, Maximum intensity projection of traced EGFP+TRPM5+ tuft cells from one month old FOXI1-CreERT2::ROSA-TG ferret trachea. Representative image from n = 3 ferrets. f, Representative image of adult FOXI1-CreERT2::ROSA-TG ferret trachea following lineage tracing demonstrating the lack of TRPM5 staining in EGFP+ presumed ionocytes. Representative image from n = 3 ferrets. g, Representative confocal image of ionocytes (ATP6V1G3+) and PNECs (SYP+) in epithelia from WT and FOXI1-KO air-liquid interface (ALI) cultures. n = 4 ferrets (WT), n = 5 ferrets (FOXI1-KO). h, Frequency of ionocytes (ATP6V1G3+) and PNECs (SYP+) in epithelia from FOXI1-KO and WT ALI cultures (n = ferret donors, 3-5 independent cultures quantified from each donor and averaged). Graphs show the mean ± s.e.m. Statistical significance was determined by two-tailed Student’s t-test. Source Data
Extended Data Fig. 12
Extended Data Fig. 12. Computational lineage inference of rare ferret airway epithelial cell types using pseudotime.
a, Partition-based graph abstraction (PAGA) embedding of 1,497 rare airway epithelial cells (PNEC, tuft cells, ionocytes) and putative progenitor group (color legend), all previously identified by unsupervised clustering (Fig. 3 and Fig. 5). b, Subset of ionocytes, colored by their assignment to novel ionocyte subtypes, also by unsupervised clustering (Fig. 4). c-d, PAGA embedding of 1,497 rare airway epithelial cells, colored pseudo-time coordinate (c), and lineage transcription factors for each rare cell type (d). Trajectory (large points) and branches (color legend) in (c) were fit using elastic principal graphs.

References

    1. Montoro DT, et al. A revised airway epithelial hierarchy includes CFTR-expressing ionocytes. Nature. 2018;560:319–324. - PMC - PubMed
    1. Plasschaert LW, et al. A single-cell atlas of the airway epithelium reveals the CFTR-rich pulmonary ionocyte. Nature. 2018;560:377–381. - PMC - PubMed
    1. Sun X, et al. Lung phenotype of juvenile and adult cystic fibrosis transmembrane conductance regulator-knockout ferrets. Am. J. Respir. Cell Mol. Biol. 2014;50:502–512. - PMC - PubMed
    1. Sun X, et al. In utero and postnatal VX-770 administration rescues multiorgan disease in a ferret model of cystic fibrosis. Sci. Transl. Med. 2019;11:eaau7531. - PMC - PubMed
    1. Jaenisch R, Mintz B. Simian virus 40 DNA sequences in DNA of healthy adult mice derived from preimplantation blastocysts injected with viral DNA. Proc. Natl Acad. Sci. USA. 1974;71:1250–1254. - PMC - PubMed

Publication types

MeSH terms

Substances