. 2023 Oct;622(7982):367-375.
doi: 10.1038/s41586-023-06570-y. Epub 2023 Sep 20.

Transcriptional linkage analysis with in vivo AAV-Perturb-seq

Affiliations

Transcriptional linkage analysis with in vivo AAV-Perturb-seq

Antonio J Santinha et al. Nature. 2023 Oct.

Abstract

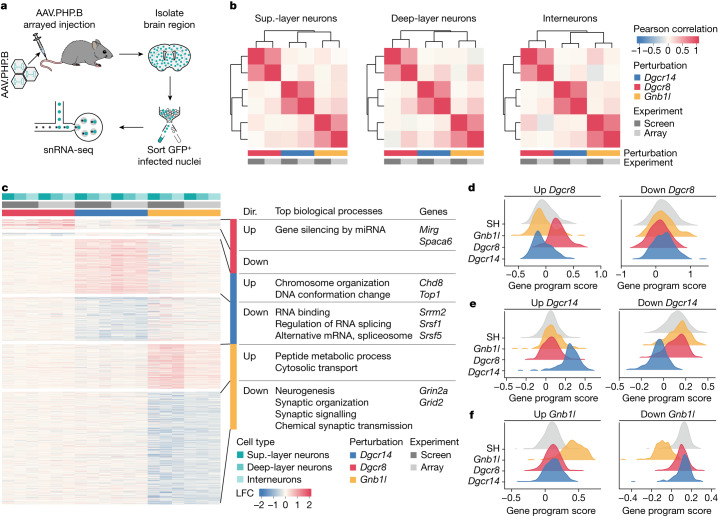
The ever-growing compendium of genetic variants associated with human pathologies demands new methods to study genotype-phenotype relationships in complex tissues in a high-throughput manner1,2. Here we introduce adeno-associated virus (AAV)-mediated direct in vivo single-cell CRISPR screening, termed AAV-Perturb-seq, a tuneable and broadly applicable method for transcriptional linkage analysis as well as high-throughput and high-resolution phenotyping of genetic perturbations in vivo. We applied AAV-Perturb-seq using gene editing and transcriptional inhibition to systematically dissect the phenotypic landscape underlying 22q11.2 deletion syndrome3,4 genes in the adult mouse brain prefrontal cortex. We identified three 22q11.2-linked genes involved in known and previously undescribed pathways orchestrating neuronal functions in vivo that explain approximately 40% of the transcriptional changes observed in a 22q11.2-deletion mouse model. Our findings suggest that the 22q11.2-deletion syndrome transcriptional phenotype found in mature neurons may in part be due to the broad dysregulation of a class of genes associated with disease susceptibility that are important for dysfunctional RNA processing and synaptic function. Our study establishes a flexible and scalable direct in vivo method to facilitate causal understanding of biological and disease mechanisms with potential applications to identify genetic interventions and therapeutic targets for treating disease.


Conflict of interest statement

A.J.S. and R.J.P. are listed as inventors on a patent application relating to work in this manuscript.

Figures

Fig. 1
Fig. 1. In vivo single-nucleus pooled CRISPR screening in the adult brain enabled by systemic administration of AAV.PHP.B and 5′ gRNA capture.
a, The AAV-Perturb-seq experimental pipeline. b, Expression of mTagBFP, Venus and mCherry in the prefrontal cortex after systemic injection of an equal mixture of 5.0 × 109 total AAV particles. Scale bars, 100 µm. The experiments were repeated in n = 3 mice. c, Representation of the 22q11.2 locus showing the genes expressed in the adult mouse prefrontal cortex. The human 22q11.2 locus is conserved in mouse chromosome (chr.) 16. d, UMAP embedding of around 150,000 AAV.PHP.B-infected nuclei isolated from the mouse prefrontal cortex. e, The number of nuclei with a unique gRNA for each perturbation across cell types.
Fig. 2
Fig. 2. Perturbation of the 22q11.2-linked genes Dgcr8, Dgcr14, Gnb1l and Ufd1l results in strong transcriptional changes in adult brain cell types.
a, Schematic of the analysis pipeline. The SH control was nuclei with control gRNAs targeting the SH locus. P, perturbation. n is the total number of perturbations. b, The number of DEGs for all perturbations in individual cell types. The dashed line indicates five DEGs with an adjusted P value (Padj) of less than 0.05. P values were calculated using edgeR-LRT with FDR correction for multiple comparisons. c, Heat map and hierarchical clustering of the 20 top upregulated genes (rows) after Dgcr8, Dgcr14, Gnb1l and Ufd1l perturbation in the indicated neuron types (columns). d, UMAP embedding of control nuclei and nuclei passing the filter after perturbation in Dgcr8, Dgcr14, Gnb1l and Ufd1l for each neuron type using DEGs as variables (LFC > 0.5 and FDR < 0.01). e, Deep-sequencing-based gene editing (indel) analysis of four gRNAs targeting 22q11.2 genes with strong transcriptional phenotypes (Dgcr8, Dgcr14, Gnb1l and Ufd1l) and four gRNAs targeting genes without apparent transcriptional phenotypes (Comt, Med15, Ranbp1 and Pi4ka). n = 3 biologically independent animals per target gene. Data are mean ± s.d.
Fig. 3
Fig. 3. Perturbation of 22q11.2 genes results in the disruption of distinct sets of biological processes.
a, Schematic of the arrayed validation experiments. b, Pearson correlation and hierarchical clustering of transcriptional signatures (LFC values) mediated by Dgcr8, Dgcr14 or Gnb1l perturbation in pooled screen and arrayed confirmation experiments for each neuron type. c, Heat map showing the six transcriptional programs (grouped rows) altered in Dgcr8-, Dgcr14- and Gnb1l-perturbed cells (columns) across cell types and experiments (screen or arrayed). Left, LFC values for each altered gene across neuron types and experiments. Right, disrupted biological process for each genetic program (top biological processes), direction of expression change (dir.) and representative genes. df, Gene program scores for upregulated (up) and downregulated (down) genes in interneurons with Dgcr8 (d), Dgcr14 (e) and Gnb1l (f) perturbation from the screen dataset. Extended Data Figure 8b–d contains ridge plots with gene expression scores for all neuron types and experiments. Statistical analysis was performed using one-way analysis of variance with post hoc Tukey’s test; adjusted P < 0.01 (SH control versus gene program perturbation); comparisons of SH control versus other perturbations were not significant.
Fig. 4
Fig. 4. Transcriptional changes found in LgDel model neurons are partially explained by perturbation of Dgcr8, Dgcr14 and Gnb1l.
a, Schematic of the LgDel single-nucleus cortex atlas experimental design. snRNA-seq analysis of 10-week-old LgDel+/− (LgDel) and WT control (LgDel+/+) mouse brain prefrontal cortex. n = 3 male mice for each condition. b, UMAP embedding depicting the cell types identified in WT and LgDel samples (left). Right, individual UMAP representations of WT and LgDel nuclei. c, Pseudobulk differential expression analysis of genes targeted in the pooled screen across cell types, comparing LgDel against the WT control. Dgcr2 and Rimbp3 were omitted due to their low expression levels and therefore inaccuracy in calculating the LFC. d, Biological processes enriched in LgDel transcriptional profiles from each cell type. NES, normalized enrichment score; Padj, P value adjusted using Bonferroni’s multiple-comparison test. e, Cosine similarity of LFC profiles between individual perturbations and LgDel for each cell type. f, Heat map showing the LFC values for the top 100 predicted genes in individual perturbations, LgDel and the model (LgDel = 0.21 Dgcr8 + 0.18 Gnb1l + (−0.11) Dgcr14, dcor = 0.40) prediction based on individual perturbation profiles. Extended Data Fig. 11 shows similar heat maps for the other neuron types. g, The gene program score in WT control and LgDel nuclei for the upregulated program in Dgcr8-perturbed nuclei. Statistical analysis was performed using two-sided Student’s t-tests, FDR-adjusted P values: <0.01 (superficial-layer neurons), <0.01 (deep-layer neurons) and <0.01 (interneurons). h, The gene program score in WT control and LgDel nuclei for the downregulated program in Gnb1l-perturbed nuclei. Statistical analysis was performed using two-sided Student’s t-tests; FDR-adjusted P values: <0.01 (superficial-layer neurons), <0.01 (deep-layer neurons) and <0.01 (interneurons).
Fig. 5
Fig. 5. LgDel and individual 22q11.2 gene perturbations alter the expression of disease-associated risk genes.
Heat map highlighting genes that are commonly dysregulated in individual perturbations and LgDel transcriptional profiles (right) and their association with neurodevelopmental disorders (left). ADHD, attention deficit hyperactivity disorder; BP, bipolar disorder; SCZ, schizophrenia.
Extended Data Fig. 1
Extended Data Fig. 1. Establishing a method to capture both mRNA and CRISPR gRNA information from the same AAV-infected nucleus.
a. Schematic representation of AAV genomes used to deliver and express mTagBFP, Venus, or mCherry under the control of the CBh promoter. b. Schematic representation of the triple colour experiment. An equal-ratio mix of the three AAVs was injected in LSL-Cas9 animals with different doses (Low: 2.5 ×10⁹; Medium: 5.0 ×10⁹; High: 2.5 ×10¹⁰, total AAV particles). c. Percentage of infected nuclei (i.e., nuclei expressing at least one fluorescent protein) after systemic injection of different viral doses, n = 3 biologically independent animals. Data are presented as mean values +/− SD. d. Percentage of infected nuclei expressing one, two, or the three FPs. Data shown for injections with 5.0 ×10⁹ and 2.5 ×10¹⁰ total AAV particles, n = 3 biologically independent animals. Data are presented as mean values +/− SD. e. Fluorescence imaging of brain cells expressing GFP four weeks after systemic injection of 5.0 ×10⁹ AAV particles. Experiments were repeated in n = 3 mice. Scale Bar is 100 μm. f. Flow cytometry gating strategy to sort GFP-positive nuclei. g-h. Schematic representation of the AAV genome engineered for 3’ capture (pAS006) (g) and 5’ capture (pAS088) (h) of gRNA molecules. i. Percentage of nuclei with detected gRNAs (i.e., at least one gRNA molecule recovered) for 3’ or 5’ capture methods. j. Percentage of nuclei with a unique gRNA (i.e., all gRNA molecules found have the same sequence) for 3’ or 5’ capture methods. k. Median number of UMIs associated with gRNAs in each nucleus for 3’ or 5’ capture methods.
Extended Data Fig. 2
Extended Data Fig. 2. AAV-Perturb-seq of 22q11.2DS genes yields a rich single-nucleus dataset spanning genes and brain cell types from adult mice.
a. Normalized expression of 22q11.2 locus target genes (columns) in brain prefrontal cortex cell types (rows). Data from DropViz mouse brain cell atlas project. b. Data analysis workflow and filtering strategies to reveal perturbation-associated transcriptional phenotypes. cd. UMAP representation with normalized expression of neuron type (c) or non-neuronal brain cell (d) marker genes. e. Average UMI and gene counts for each cell type in the screen dataset.
Extended Data Fig. 3
Extended Data Fig. 3. Identification of perturbed nuclei and transcriptional phenotypes.
a. Percentage of gRNAs detected per nucleus for all cell types combined. b. Percentage of gRNAs detected per nucleus for each cell type individually. c. Number of total UMI counts per nucleus across cell types. d. Average number of nuclei per perturbation across cell types. e. Correlation between the number of nuclei in a given cell type cluster and the average number of nuclei per perturbation. f. Correlation between LFC values calculated with scRNA-seq or pseudobulk methods for each target gene. The colour gradient indicates average gene expression. g. Hoteling T-squared statistics of transcriptional phenotypes induced by 22q11.2 gene perturbations in different cell types. h. Heatmap with all up-regulated differentially expressed (LFC > 0.5 and FDR < 0.01) genes (rows) for each cell type and perturbation (columns). i. AUGUR score for each cell type and perturbation. Bubble size indicates number of DEGs (LFC > 0.5; FDR < 0.01). j. Pearson correlation of transcriptional profiles induced by different perturbations across neuron types.
Extended Data Fig. 4
Extended Data Fig. 4. Testing the robustness of AAV-Perturb-seq.
a. Percentage of frameshift and in-frame Cas9-induced indels mediated by four gRNAs targeting genes that either induce a strong transcriptional phenotype (Ufd1l, Gnb1l, Dgcr14, and Dgcr8) or do not induce a strong transcriptional phenotype (Comt, Med15, Ranbp1, and Pi4ka), n = 3 biologically independent animals. Data are presented as mean values +/− SD. b. Percentage of nuclei passing LDA filtering for perturbations across neuron types. c. Correlation between LFC values calculated with all gRNA-containing nuclei before filtering and nuclei after passing LDA filtering. d. Volcano plots with LFC values for Ufd1l-perturbed nuclei across neuron types. Purple colour indicates up-regulated DEGs related with cell death processes. P-values were calculated using edgeR-LRT with FDR multiple comparison test correction e. Biological processes (GO:BP) associated with up-regulated genes in Ufd1l-perturbed nuclei. P-values were adjusted with Bonferroni’s multiple comparison test.
Extended Data Fig. 5
Extended Data Fig. 5. Arrayed perturbation experiments confirm the pooled screen results.
a. Schematic of AAV genome used in arrayed experiments. b. UMAP embedding of prefrontal cortex nuclei from arrayed experiments using gRNAs targeting SH control, Dgcr8, Dgcr14, and Gn1bl. c. Percentage of nuclei from individual perturbations for each cell type. d. UMAP embedding of SH control nuclei and nuclei passing filter perturbed in Dgcr8, Dgcr14, or Gnb1l, for each neuron type individually in arrayed experiments using DEGs identified in the pooled dataset as variables. e. Pearson correlation of transcriptional profiles induced by different perturbations across neuron types in arrayed experiments. f. Heatmap with all up-regulated differentially expressed (LFC > 0.5 and FDR < 0.01) genes for each cell type and perturbation (columns) in arrayed experiments.
Extended Data Fig. 6
Extended Data Fig. 6. Computational stratification of zygosity cell states in perturbed nuclei.
ac. Diffusion map-based stratification of SH control and perturbed nuclei. df. Histogram and density plots highlighting the position of SH control and nuclei across the first diffusion component (DC). gi. Stratification of perturbed nuclei into three zygosity states. jo. Expression of DEGs calculated with all perturbed nuclei together (j, l, and n) and correlation of LFC between zygosity states and all nuclei (k, m, and o).
Extended Data Fig. 7
Extended Data Fig. 7. Modelling haploinsufficiency with CRISPRi.
a. Schematic representation of arrayed CRISPRi experiments. b. UMAP embedding of ~8,000 AAV.PHP.B-infected nuclei isolated from the dCas9-KRAB mouse prefrontal cortex. c. LFC values of the Dgcr8 mRNA between Dgcr8 perturbation and control nuclei across cell types. d. Cosine similarity of gene expression values between Dgcr8 perturbation and control nuclei across cell types. e. Area under the curve (AUC) showing the reliability of differential expression identification (DE) in knock-out (KO, screen profiles) and knock-down (KD, CRISPRi) experiments. False positive and true positive rates comparison of snRNA-seq profiles of Dgcr8 KO and KD. True positives are DE genes (LFC > 0.4 and FDR < 0.05) identified in the KO experiment. False positives are genes considered DE in the KO dataset, but not in the KD. f. LFC values (for both KO and KD experiments) of DEGs identified in the screen KO dataset across cell types. P-values were calculated with edgeR-LRT with FDR multiple comparison test correction. g. Hierarchical clustering of LFC profiles from perturbations across cell types and experiments (screen or arrayed).
Extended Data Fig. 8
Extended Data Fig. 8. Gene program scores show perturbation-specific signatures across cell types and experiments.
a. Bubble plot showing biological processes (GO:BP) altered by perturbing Dgcr8, Dgcr14, or Gnb1l, for both up and down-regulated gene programs. P-values were adjusted with Bonferroni’s multiple comparison test. bd. Gene program scores for up-regulated (UP) and down-regulated (DOWN) genes in Dgcr8, Dgcr14, and Gnb1l perturbed neuron types across experiments (screen and array).
Extended Data Fig. 9
Extended Data Fig. 9. Perturbation of Dgcr8 disrupts RNA processing and leads to the accumulation of pri-miRNAs.
a. Schematic representation of pri-miRNA processing mediated in SH control and Dgcr8-perturbed cells. b. Normalized expression of Spaca6 and Mirg in SH control and Dgcr8-perturbed nuclei for all cell types. c. Normalized expression of Mir9-3hg, Mir124a-1hg, and Mir181a-1hg in SH control and Dgcr8-perturbed nuclei for all cell types. d. miRNA target enrichment analysis for miRNA-181a targets in up-regulated genes across perturbations and cell types. Dashed line indicates FDR = 0.1. P-values were corrected with FDR multiple comparison test.
Extended Data Fig. 10
Extended Data Fig. 10. Single-nucleus prefrontal cortex atlas of the LgDel 22q11.2DS mouse model.
a. Average UMI and gene counts for each cell type in WT and LgDel snRNA-seq libraries. b. UMAP embeddings separated by individual samples from WT and LgDel snRNA-seq libraries. c. Cell type frequency in WT and LgDel samples. Data are presented as mean values +/− SD (n = 3 biologically independent animals, Two-sided Student’s t-test, FDR < 0.05, ns = non-significant). d. Hierarchical clustering of pseudobulk gene counts for each sample separated by cell type and condition. e. Number of up- and down-regulated DEG (abs(LFC) > 0.5 and FDR < 0.01) in LgDel for each cell type. f. Heatmap with Pearson correlation of LFC LgDel profiles in different cell types. g. Extended heatmap with GSEA normalized enrichment score (NES) of biological processes (GO:BP) identified in all LgDel cell types. The asterisk (*) indicates adjusted p-value (p.adj) <0.05. P-values were adjusted with Bonferroni’s multiple comparison test. h. Biological processes altered in human cerebral spheroids derived from 22q11.2 patients’ cells. Data from Khan et al 2020.
Extended Data Fig. 11
Extended Data Fig. 11. Individual perturbations partially explain LgDel transcriptional changes.
a. Heatmap showing the LFC values for the top 100 predicted genes in individual perturbations, LgDel, and the model prediction (LgDel = 0.03 Dgcr8 + 0.06 Gnb1l + 0.04 Dgcr14, dcor = 0.15) based on individual perturbations profiles in Superficial Layer Neurons. b. Heatmap showing the LFC values for the top 100 predicted genes in individual perturbations, LgDel, and the model prediction (LgDel = 0.18 Dgcr8 + 0.11 Gnb1l + (−0.13) Dgcr14, dcor = 0.37) based on individual perturbation profiles in Deep Layer Neurons. c. Number of genes similarly dysregulated in LgDel and individual perturbation gene programs. P-values calculated with hypergeometric test without multiple comparison correction d. Gene program score in WT and LgDel nuclei for the up-regulated program in Gnb1l-perturbed nuclei. e. DisGeNET enrichment analysis of genes commonly dysregulated in individual perturbations and LgDel transcriptional profiles (SCZ: Schizophrenia; BP: Bipolar Disorder; ADHD: Attention Deficit Hyperactivity Disorder; ASD: Autism Spectrum Disorder). P-values were adjusted with Bonferroni’s multiple comparison test. f. Gene ontology analysis of schizophrenia-associated genes commonly dysregulated in individual perturbations and LgDel transcriptional profiles. P-values were adjusted with Bonferroni’s multiple comparison test.

References

    1. Kuhn M, Santinha AJ, Platt RJ. Moving from in vitro to in vivo CRISPR screens. Gene. Genome Ed. 2021;2:100008. doi: 10.1016/j.ggedit.2021.100008. - DOI
    1. Bock, C. et al. High-content CRISPR screening. Nat. Rev. Methods Primer2, 8 (2022). - PMC - PubMed
    1. Meechan DW, et al. Modeling a model: mouse genetics, 22q11.2 deletion syndrome, and disorders of cortical circuit development. Prog. Neurobiol. 2015;130:1–28. doi: 10.1016/j.pneurobio.2015.03.004. - DOI - PMC - PubMed
    1. Du Q, de la Morena MT, van Oers NSC. The genetics and epigenetics of 22q11.2 deletion syndrome. Front. Genet. 2020;10:1365. doi: 10.3389/fgene.2019.01365. - DOI - PMC - PubMed
    1. Datlinger P, et al. Pooled CRISPR screening with single-cell transcriptome read-out. Nat. Methods. 2017;14:297. doi: 10.1038/nmeth.4177. - DOI - PMC - PubMed

Publication types