. 2023 Oct;622(7982):383-392.
doi: 10.1038/s41586-023-06568-6. Epub 2023 Sep 20.

The β1-adrenergic receptor links sympathetic nerves to T cell exhaustion

Affiliations

The β1-adrenergic receptor links sympathetic nerves to T cell exhaustion

Anna-Maria Globig et al. Nature. 2023 Oct.

Abstract

CD8+ T cells are essential components of the immune response against viral infections and tumours, and are capable of eliminating infected and cancerous cells. However, when the antigen cannot be cleared, T cells enter a state known as exhaustion1. Although it is clear that chronic antigen contributes to CD8+ T cell exhaustion, less is known about how stress responses in tissues regulate T cell function. Here we show a new link between the stress-associated catecholamines and the progression of T cell exhaustion through the β1-adrenergic receptor ADRB1. We identify that exhausted CD8+ T cells increase ADRB1 expression and that exposure of ADRB1+ T cells to catecholamines suppresses their cytokine production and proliferation. Exhausted CD8+ T cells cluster around sympathetic nerves in an ADRB1-dependent manner. Ablation of β1-adrenergic signalling limits the progression of T cells towards the exhausted state in chronic infection and improves effector functions when combined with immune checkpoint blockade (ICB) in melanoma. In a pancreatic cancer model resistant to ICB, β-blockers and ICB synergize to boost CD8+ T cell responses and induce the development of tissue-resident memory-like T cells. Malignant disease is associated with increased catecholamine levels in patients2,3, and our results establish a connection between the sympathetic stress response, tissue innervation and T cell exhaustion. Here, we uncover a new mechanism by which blocking β-adrenergic signalling in CD8+ T cells rejuvenates anti-tumour functions.


Conflict of interest statement

Competing interests The remaining authors declare no conflicts of interest.

Figures

Extended Data Fig. 1 |
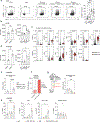
Extended Data Fig. 1 |. Exhausted CD8+ T cells express ADRB1 and are associated with sympathetic nerves in the spleen and in tumors.
a, Volcano plot depicting genes upregulated in terminal exhausted cells vs in progenitor exhausted cells respectively. Data from PRJNA497086, TEXprog = CD101 TIM3, TEXeff = CD101 TIM3+, TEXterm = CD101+ TIM3+. b, Frequency of ADRB1 expressing cells within the different exhausted subsets depicted at d30 p.i. with LCMV clone 13. PD-1 = PD-1 P14+, TEXprog = TCF1+ PD-1+ P14+, TEXeff = CX3CR1+ TIM3+ PD-1+ P14+, TEXterm = CD101+ TIM3+ PD-1+ P14+. N = 7 per subset pooled from 2 independent experiments, Friedman test with Dunn’s multiple comparisons test. c, Representative flow plots depicting ADRB1 expression on naïve CD8+ T cells (CD44) and gp33+ CD8+ T cells from mice infected with LCMV Armstrong (d8) and LCMV clone 13 (d30), representative of 3 independent experiments. d, Representative overview image of WT P14+ cells (cyan), CD101 expression (magenta), and tyrosine hydroxylase (yellow) at d14 p.i. in the spleen of a recipient mouse infected with LCMV clone 13. Four different regions such as this were imaged across the spleens of two different mice from 2 independent experiments and the shortest distance to TH signal for CD101+ P14+ cells vs CD101 P14+ cells was calculated. Image collected using ×20 objective tiled across a 3×3 region. e + f, Representative images of nerves within PDAC tumors with T cell clusters (representative of 5 individual tumors from 2 independent experiments). Scale bar: 50 μm. Image was collected using a ×40 objective tiled across the entire PDAC tumor within the pancreas, with 1.5 μm z step sizes to acquire a 30 μm imaging depth. g, Density of TH+ stromal cells across 164 primary human NSCLCs. h, Density of CD8+ TILs in NSCLCs with low (bottom 80%, n = 130) and high TH (top 20%, n = 34) expression. Mann-Whitney test. Unless otherwise specified, mean ± SEM is indicated in scatter plots. Two-sided statistical tests were used. **** indicates a p value < 0.0001, ***<0.001, **<0.01, *<0.05.
Extended Data Fig. 2 |
Extended Data Fig. 2 |. Catecholamine signaling through ADRB1 impairs CD8+ T cell cytokine production and proliferation.
a, Verification of Adrb1 overexpression. qPCRs were performed in duplicates. b, Flow plots of cytokine production by Adrb1 OE P14+ cells and control empty vector (EV) P14+ cells. Cells were stimulated with gp33 in the presence or absence of 10 μM adrenaline (A) or noradrenaline (NA). Plots are gated on GFP+ CD8+ T cells and indicative of one of 3 independent experiments. c, Cytokine production by control empty vector (EV) retroviral (RV)-transduced P14+ cells (n = 3 individual experiments). Cells were stimulated with gp33 in the presence or absence of 10 μM A or NA. d, Representative flow plots depicting frequency of Adrb1 overexpressing (OE) P14+ cells and control (EV) P14+ cells at d0 and d6 of culture. Cells were mixed at a 1:1 ratio and cultured for 6 days total with and without the addition of 10 μM A or NA. Representative of 4 independent experiments. e, Ratio of Adrb1 OE P14+ cells to control (EV) P14+ cells over 6 days of culture. Cells were mixed at a 1:1 ratio and cultured for 6 days total with and without the addition of 10 μM A or NA. Quantification from 4 independent experiments. Unless otherwise specified, mean ± SEM is indicated in scatter plots.
Extended Data Fig. 3 |
Extended Data Fig. 3 |. Adrb1 knockout prevents terminal differentiation of antigen-specific CD8+ T cells.
a, Verification of knockout in Adrb1fl/fl Granzyme BCre+ mice (Adrb1 cKO). Splenocytes were isolated and stimulated with anti-CD3/CD28. Cells were cultured in vitro for 4 days with IL-2 and subsequently CD8+ T cells were sorted. Adrb1 expression was assessed with qPCR performed in triplicates. b, Expression of PD-1 on Adrb1 cKO P14+ cells (red) and WT P14+ cells (black) at d7 p.i. (n = 9) and d40 p.i. (n = 16). Paired t-test. Flow data for both d7 and d40 are each pooled from 3 independent experiments. c, Cytokine production of Adrb1 cKO P14+ cells (red) and wild type P14+ cells (black) at d40 p.i. after 6 h stimulation with gp33. N = 16, paired t-test, pooled from 3 independent experiments. d, Viral titers in spleen from Adrb1 cKO and WT P14+ recipients at d36 p.i. with LCMV clone13 and treated with antiPD-L1 or IgG2B from d23-d36 p.i. Ordinary one-way ANOVA with Holm–Šídák’s multiple comparisons test with a single pooled variance. WT IgG2B n = 7, WT anti-PD-L1 n = 8, cKO IgG2B n = 8, cKO anti-PD-L1 n = 8, pooled from 2 independent experiments. e, Verification of Crem knockdown using shCrem and qPCR performed in triplicates to determine Crem expression. Splenocytes were transduced with shCrem or shCd19 as control and cultured for 3 days before sorting on Ametrine+ CD8+ T cells. Unpaired t-test. f, Frequency and phenotype of Crem knockdown P14+ and control knockdown P14+ at d7 p.i. with LCMV clone 13. 15,000 Crem knockdown P14+ cells and control knockdown P14+ cells each were mixed at a 1:1 ratio and transferred into recipient mice that were infected with LCMV clone 13 on the same day (n = 15, pooled from 3 independent experiments). Wilcoxon test. g, Representative image of Adrb1 cKO P14+ (red) and WT P14+ cells (cyan) at d31 p.i. in the spleen of a recipient mouse infected with LCMV clone 13. Image is representative of 3 independent regions and 2 independent experiments. B220 stain in blue and F4/80 stain in grey. Image was collected using a ×20 objective tiled across a 3×3 region. Unless otherwise specified, mean ± SEM is indicated in scatter plots. Two-sided statistical tests were used. **** indicates a p value < 0.0001, ***<0.001, **<0.01, *<0.05.
Extended Data Fig. 4 |
Extended Data Fig. 4 |. Pharmacological blockade of ADRB1 prevents advanced exhaustion differentiation of antigen-specific CD8+ T cells.
a + b, Absolute cell counts of gp33+ CD8+ T cells (a), and of different exhausted subsets of gp33+ CD8+ T cells (b) isolated from the spleens of mice treated with atenolol or control water during chronic infection with LCMV clone 13, assessed at d37 p.i. (n = 7 per group, pooled from 3 independent experiments). Mann-Whitney test. c, Absolute cell counts of cytokine producing cells after antigen-specific stimulation with gp33. Cells were isolated from the spleens of mice treated with atenolol or control water during chronic infection with LCMV clone 13, assessed at d37 p.i. (n = 8 per group, pooled from 3 independent experiments). Mann-Whitney test. Unless otherwise specified, mean ± SEM is indicated in scatter plots. Two-sided statistical tests were used. **** indicates a p value < 0.0001, ***<0.001, **<0.01, *<0.05.
Extended Data Fig. 5 |
Extended Data Fig. 5 |. Pharmacological blockade of ADRB1 synergizes with immune checkpoint blockade to increase T cell function.
a, Flow plots depicting ADRB1 expression by different subsets of exhausted T cells isolated from MC38 tumors, plots are gated on the indicated cell populations (left panel). Quantification of ADRB1 expression on different subsets of exhausted CD8+ T cells isolated from MC38 tumors implanted into wild type B6 mice (right panel, n = 16 each, pooled from 3 independent experiments). Friedman test with Dunn’s multiple comparisons test. b, cAMP levels in ADRB1 vs ADRB1+ CD8+ T cells isolated from MC38 tumors (left panel, n = 8), Wilcoxon test was used to determine statistical significance. cAMP levels in different subsets of exhausted CD8+ T cells isolated from MC38 tumors (right panel, n = 8 each). Friedman test with Dunn’s multiple comparisons test. Data pooled from 2 independent experiments. PD-1 = PD-1CD8+, TEXprog = TIM3 PD-1+ CD8+, TEXeff = CX3CR1+ TIM3+ PD-1+ CD8+, TEXterm = CD101+ TIM3+ PD-1+ CD8+. c, Expression analysis of the indicated exhaustion markers in ADRB1high and ADRB1low CD8+ T cells in RNA Seq data generated from 16 human colorectal cancer samples. Data from GSE200997. Statistics were calculated using a linear mixed model. Boxplots show median. The lower and upper hinges correspond to the first and third quartiles. The upper whisker extends from the hinge to the largest value no further than 1.5 * IQR from the hinge. d, cAMP levels in ADRB1 vs ADRB1+ CD8+ T cells isolated from YUMMER tumors (n = 4), Wilcoxon test was used to determine statistical significance. cAMP levels in different subsets of exhausted CD8+ T cells isolated from YUMMER tumors (n = 4 each). Friedman test with Dunn’s multiple comparisons test. Data representative of one of 2 independent experiments. PD-1 = PD-1 CD8+, TEXprog = TIM3 PD-1+ CD8+, TEXeff = CX3CR1+ TIM3+ PD-1+ CD8+, TEXterm = CD101+ TIM3+ PD-1+ CD8+. e, Normalized tumor mass of YUMMER tumors from mice under the indicated treatment conditions relative to IgG control (IgG n = 9, atenolol + ICB n = 8, atenolol + ICB + CD8+ depletion n = 9), pooled from 2 independent experiments. Kruskal-Wallis Test with Dunn’s multiple comparisons test. f, ADRB1/ADRB2 selectivity of atenolol and CGP 20712A according to ref. . g, Schematic of the experimental setup used in the subsequent figure panels showing YUMMER tumor experiments (left panel). Normalized tumor mass of YUMMER tumors relative to IgG control (IgG n = 5, CGP 20712A n = 7, ICB n = 8, CGP 20712A + ICB n = 8, pooled from 2 independent experiments). Kruskal-Wallis Test with Dunn’s multiple comparisons test (right panel). h, Flow cytometric assessment of production of cytokines by CD8+ T cells after stimulation with PMA/ionomycin (IgG n = 5, CGP 20712A n = 7, ICB n = 8, CGP 20712A + ICB n = 7, pooled from 2 independent experiments). Kruskal-Wallis Test with Dunn’s multiple comparisons test. Unless otherwise specified, mean ± SEM is indicated in scatter plots. Two-sided statistical tests were used. **** indicates a p value < 0.0001, ***<0.001, **<0.01, *<0.05.
Extended Data Fig. 6 |
Extended Data Fig. 6 |. Exhausted CD8+ T cells in PDAC tumors express ADRB1.
a, Representative flow cytometry plots depicting ADRB1 expression of different CD8+ T cell subsets in PDAC tumors implanted into wild type B6 mice. Plots are gated on the indicated cell populations and representative of 2 independent experiments. b, Expression analysis of the indicated exhaustion markers in ADRB1high and ADRB1low CD8+ T cells in RNA Seq data generated from 16 human pancreatic cancer samples. Data from GSE155698. Statistics were calculated using a linear mixed model. Boxplots show median. The lower and upper hinges correspond to the first and third quartiles. The upper whisker extends from the hinge to the largest value no further than 1.5 * IQR from the hinge. Two-sided statistical tests were used. **** indicates a p value < 0.0001, ***<0.001, **<0.01, *<0.05.
Extended Data Fig. 7 |
Extended Data Fig. 7 |. Pharmacological blockade of ADRB1 or ADRB2 alone is ineffective in PDAC.
a, cAMP levels in ADRB1 vs ADRB1+ CD8+ T cells isolated from PDAC tumors (left panel, n = 6 pooled from 2 independent experiments), Wilcoxon test. cAMP levels in different subsets of exhausted CD8+ T cells isolated from PDAC tumors (second to left panel, n = 6 each pooled from 2 independent experiments). Friedman test with Dunn’s multiple comparisons test. PD-1 = PD-1 CD8+, TEXprog = TIM3 PD-1+ CD8+, TEXeff = CX3CR1+ TIM3+ PD-1+ CD8+, TEXterm = CD101+ TIM3+ PD-1+ CD8+. CREM expression in ADRB1+ vs ADRB1 CD8+ T cells isolated from PDAC tumors (second to right panel, n = 6 pooled from 2 independent experiments), Wilcoxon test. CREM expression in different subsets of exhausted CD8+ T cells isolated from PDAC tumors (right panel, n = 10 each, pooled from 3 independent experiments). Friedman test with Dunn’s multiple comparisons test. PD-1 = PD-1 CD8+, TEXprog = SLAMF6+ PD-1+ CD8+, TEXeff = CX3CR1+ TIM3+ PD-1+ CD8+, TEXterm = CD101+ TIM3+ PD-1+ CD8+. b, Normalized tumor mass of PDAC tumors relative to IgG control (IgG n = 5, atenolol n = 5, ICB n = 5, atenolol + ICB n = 5), representative of 2 independent experiments. Kruskal-Wallis Test with Dunn’s multiple comparisons test. c, ADRB1/ADRB2 selectivity of atenolol and ICI 118551 according to ref. (left panel). Normalized tumor mass of PDAC tumors relative to IgG control (IgG n = 9, ICI 118551 n = 9, ICB n = 8, ICI 118551 + ICB n = 10), pooled from 2 independent experiments. ICI 118551 hydrochloride was administered at 0.2 μg/g i.p. daily. Kruskal-Wallis Test with Dunn’s multiple comparisons test. Unless otherwise specified, mean ± SEM is indicated in scatter plots. Two- sided statistical tests were used. **** indicates a p value < 0.0001, ***<0.001, **<0.01, *<0.05.
Extended Data Fig. 8 |
Extended Data Fig. 8 |. Single cell RNA Seq analysis of tumor infiltrating T cells from PDAC tumors.
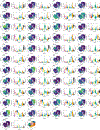
UMAP and violin plots depicting the MAGIC imputed expression of the indicated marker genes for the T cell clusters within the PDAC scRNA Seq dataset.
Extended Data Fig. 9 |
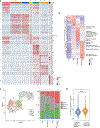
Extended Data Fig. 9 |. Pharmacological blockade of adrenergic receptors reprograms tumor infiltrating T cells in PDAC.
a, Heatmap showing the top 10 marker genes for each T cell cluster. Expression is normalized across cells. b, Heatmap showing differentially regulated pathways in CD8+ T cells extracted from the PDAC scRNA Seq dataset. T cells were grouped by condition and z score of median pathway activity is shown. c, UMAP visualization of CD8+ T cells extracted from the PDAC scRNA Seq dataset. Cells were annotated using SingleR with the published exhaustion subsets from PRJNA497086. Stacked bar graphs show frequency of exhaustion subsets per treatment condition as annotated per PRJNA497086. d, Expression of the beta-blocker signature identified in Fig. 5l in human T cells isolated from PDAC patients under beta-blocker therapy (n = 2) vs PDAC patients without beta-blocker therapy (n = 15). Data from GSE155698. Tukey’s test. Boxplots show median. The lower and upper hinges correspond to the first and third quartiles. The upper whisker extends from the hinge to the largest value no further than 1.5 * IQR from the hinge. Two-sided statistical tests were used. **** indicates a p value < 0.0001, ***<0.001, **<0.01, *<0.05.
Extended Data Fig. 10 |
Extended Data Fig. 10 |. Pharmacological blockade of adrenergic receptors does not directly affect tumor cell proliferation.
a, Tumor expression of Ki67 relative to IgG determined by IHC in YUMMER tumors from mice under the indicated treatment conditions (IgG n = 14, atenolol n = 6, pooled from 4 independent experiments). Mann Whitney test. b, Tumor expression of Ki67 relative to IgG determined by IHC in YUMMER tumors from mice under the indicated treatment conditions (IgG n = 7, CGP 20712A n = 7, pooled from 2 independent experiments). Mann Whitney test. c, Tumor expression of Ki67 relative to IgG determined by IHC in PDAC tumors from mice under the indicated treatment conditions (IgG n = 8, propranolol n = 8, pooled from 2 independent experiments). Mann Whitney test. Unless otherwise specified, mean ± SEM is indicated in scatter plots. Two-sided statistical tests were used.
Fig. 1 |
Fig. 1 |. Exhausted CD8+ T cells express the adrenergic receptor ADRB1 and are associated with sympathetic nerves in the chronically infected spleen and in human and mouse tumours.
a, Expression of Adrb1, Adrb2, Adrb3 and Crem in TEX cells at day 45 p.i. with LCMV clone 13. Data from Bioproject PRJNA497086. TEXprog, CD101TIM3; TEXeff, CD101TIM3+; TEXterm, CD101+TIM3+. b, Annotation of TEX subsets and Adrb1 expression based on scRNA-seq data (NCBI Gene Expression Omnibus (GEO) database identifier GSE122713, day 28 clone 13). c, ADRB1 expression on gp33+ CD8+ T cells in LCMV Armstrong (day 8, n = 6), clone 13 (day 30, n = 7) and naive CD8+ T cells (n = 6), pooled from 3 independent experiments. One-way analysis of variance (ANOVA) with Dunnett’s multiple comparisons test. d, Gene set enrichment analysis using gene ontology adrenergic receptor signalling pathway and day 45 LCMV clone 13 data from PRJNA497086. e, Serum noradrenaline levels of mice infected with LCMV clone 13 at day 7 and day 21 p.i., and of naive mice (n = 5 mice per group, pooled from 2 independent experiments). Mann–Whitney test. f, Expression of ADRB1 and other canonical TEX genes in CD8+ T cells isolated from HIV-infected donors and from uninfected donors. Data from GSE157829. g, ADRB1 expression on PD-1 and PD-1+ CD8+ T cells in the blood of HIV-infected donors (n = 4) and of uninfected donors (n = 2). Paired Student’s t-test. h, Flow plots showing CD8+ T cells in the blood of a HIV-infected donor. Red frame indicates ADRB1+ cells. i, Expression of exhaustion markers on ADRB1 (black) versus ADRB1+ (red) CD8+ T cells in the blood of HIV-infected donors (n = 4) and uninfected donors (n = 2). Paired Student’s t-test. j, Representative image of WT P14+ cells (cyan) and CD101 expression (magenta) in the spleen at day 14 p.i. with LCMV clone 13. TH (yellow) was used as a marker for sympathetic nerves. k, Quantification of the shortest distance to the TH signal for CD101+ P14+ cells versus CD101 P14+ cells calculated from 4 different splenic regions of 2 different mice. ×20 objective. Dashed line indicates the median distance of CD101 P14+ cells to the TH signal. Linear mixed model. Boxplots show the median. The lower and upper hinges correspond to the first and third quartiles, respectively. The upper whisker extends from the hinge to the largest value no further than 1.5 times the interquartile range (IQR) from the hinge. l, Representative images of nerves within PDAC tumours with T cell clusters (representative of five individual tumours). ×40 objective. m, Distances of CD8+ T cell subsets to TH+ nerves in PDAC tumours, pooled from five individual tumours. Kruskal–Wallis test with Dunn’s multiple comparisons test. Dotted line indicates the median. n, Representative images of human NSCLC samples with low and high local TH expression. o, Density of exhausted CD8+ TILs in human NSCLCs with low (bottom 80%, n = 130) and high TH (top 20%, n = 34) expression. Mann–Whitney test. Unless otherwise specified, mean ± s.e.m. is indicated in scatter plots. Two-sided statistical tests were used. ****P < 0.0001, ***P < 0.001, **P < 0.01, *P < 0.05.
Fig. 2 |
Fig. 2 |. Adrb1 OE promotes CD8+ T cell exhaustion through increased cAMP levels.
a, Cytokine production by P14+ cells with Adrb1 OE and control EV RV-transduced P14+ cells (n = 3 individual experiments) stimulated with gp33 in the presence or absence of 10 μM adrenaline or noradrenaline. Ordinary one-way ANOVA with Dunnett’s multiple comparisons test. NS, not significant. b, CellTrace Violet (CTV) staining of Adrb1 OE P14+ cells and control EV RV-transduced P14+ cells cultured for 3 days with or without 10 μM adrenaline or noradrenaline. One out of three experiments is shown. Plots gated on congenic+ GFP+ CD8+ T cells. c,d, Experimental setup (c) and representative calcium flux plots (d). Adrb1 OE P14+ cells and EV control P14+ cells were cultured in the presence or absence of catecholamines and the calcium flux was measured after TCR stimulation with CD3 crosslink or gp33 stimulation using indo-1 staining. One out of four experiments is shown. Plots gated on congenic+ GFP+ CD8+ T cells. e, Western blot showing phosphorylation of PLCγ1 in Adrb1 OE and EV control P14+ cells after TCR stimulation in the presence or absence of noradrenaline. Western blot is representative of one out of seven independent experiments quantified in the bottom panel. Wilcoxon test. For source data, see Supplementary Fig. 1. f,g, Frequency (f) and phenotype (PD-1+TIM3+; g) of Adrb1 OE P14+ cells on day 7 p.i. with LCMV clone 13. n = 10,000 Adrb1 OE P14+ cells and EV P14+ cells each were transferred into recipient mice at a 1:1 ratio (n = 11, pooled from 3 independent experiments). Wilcoxon test. h, cAMP levels in Adrb1 OE P14+ cells and EV P14+ cells on day 7 p.i. with LCMV clone 13 (n = 11, pooled from 3 independent experiments). Wilcoxon test. i, cAMP levels in gp33+ CD8+ T cells from mice infected with LCMV Armstrong (day 8 p.i.), LCMV clone 13 (day 30 p.i.) or from naive cells (CD44 CD8+ T cells). n = 5 mice per group, representative of 1 out of 2 independent experiments. cAMP levels in ADRB1+ and ADRB1 gp33+ CD8+ T cells on day 30 p.i. with LCMV clone 13 (n = 13 per group, pooled from 2 independent experiments). CREM expression in gp33+ CD8+ T cells from mice infected with LCMV Armstrong (day 8 p.i., n = 4) or LCMV clone 13 (day 30 p.i., n = 5) or from naive cells (CD44 CD8+ T cells, n = 4, representative of 1 out of 3 independent experiments). CREM expression in ADRB1+ and ADRB1 gp33+ CD8+ T cells on day 30 p.i. with LCMV clone 13 (n = 10 per group, pooled from 2 independent experiments). Kruskal–Wallis test with Dunn’s multiple comparisons test or Wilcoxon test. j, Left, cAMP levels in subsets of exhausted gp33+ CD8+ T cells. PD-1 cells; TEXprog, TIM3PD-1+; TEXeff, CX3CR1+TIM3+PD-1+; TEXterm, CD101+TIM3+PD-1+. n = 13 per group, pooled from 2 independent experiments. Right, CREM expression in subsets of exhausted gp33+ CD8+ T cells. PD-1, PD-1 cells; TEXprog, TCF1+PD-1+; TEXeff, CX3CR1+TIM3+PD-1+; TEXterm, CD101+TIM3+PD-1+. n = 8 per group, pooled from 2 independent experiments. Friedman test with Dunn’s multiple comparisons test. k, Representative overlay histogram of CREM expression in Adrb1 KO and control cells. Representative of two independent experiments. Unless otherwise specified, mean ± s.e.m. is indicated in scatter plots. Two-sided statistical tests were used. ****P < 0.0001, ***P < 0.001, **P < 0.01, *P < 0.05.
Fig. 3 |
Fig. 3 |. Adrb1 KO prevents terminal differentiation of antigen-specific CD8+ T cells in chronic viral infection.
a, Experimental setup. Adrb1fl/fl Gzmbcre+ and Adrb1fl/flGzmbcre–P14+ cells with different congenic markers were mixed at a 1:1 ratio with 7,500 P14+ cells of each genotype co-adoptively transferred into B6 recipients that were infected with LCMV clone 13 one day later. Flow data for day 7 and day 40 were each pooled from 3 independent experiments. b, Frequency of Adrb1 cKO P14+ and WT P14+ cells at day 7 and day 40 p.i. with LCMV clone 13. n = 9 for day 7, n = 16 for day 40. Paired Student’s t-test. c, Expression of TOX on Adrb1 cKO P14+ and WT P14+ cells at day 7 p.i. (n = 9) and day 40 p.i. (n = 16). Paired Student’s t-test. d, Representative flow plots gated on P14+ CD8+ T cells showing KLRG1 and CD127 expression of Adrb1 cKO P14+ cells and WT P14+ cells at day 7 p.i. with LCMV clone 13. e, Quantification of CD127−KLRG1+ Adrb1 cKO P14+ cells and WT P14+ cells at day 7 p.i. (n = 9). Paired Student’s t-test. fh, Expression of TIM3, CD101, CD39, CXCR6, CX3CR1 and TCF1 on Adrb1 cKO P14+ cells and WT P14+ cells (f) and quantification of exhaustion subsets (g,h) at day 40 p.i. (n = 16). Paired Student’s t-test. i, Granzyme B production of Adrb1 cKO P14+ cells and WT P14+ cells at day 40 p.i. (n = 16). Paired Student’s t-test. j, Viral titres from the spleen of Adrb1 cKO (n = 10) and WT P14+ recipients (n = 9) at day 30 p.i. with LCMV clone 13, pooled from 2 independent experiments. Unpaired Student’s t-test. FFU, focus forming unit. k, Frequency of Adrb1 cKO P14+ cells and WT P14+ cells after treatment with anti-PD-L1 or IgG2B from day 23 to day 36. Frequency assessed at day 36 p.i. with LCMV clone 13. Values shown as ratio to mean WT IgG2B, n = 5 per group pooled from 2 independent experiments. Mixed effects-analysis with Dunnett’s multiple comparisons test. l, cAMP levels (left) and CREM expression (right) in Adrb1 cKO P14+ cells and WT P14+ cells at day 40 p.i. (n = 16). Paired Student’s t-test. m, Left, representative image of Adrb1 cKO P14+ cells and WT P14+ cells in the spleen at day 31 p.i. TH staining was used as a marker for sympathetic nerves. Right, quantification of the shortest distance to nerve staining for Adrb1 cKO P14+ cells and WT P14+ cells calculated from six different splenic regions of two different mice. Image collected using a ×10 objective. Linear mixed model. Boxplots show the median. The lower and upper hinges correspond to the first and third quartiles, respectively. The upper whisker extends from the hinge to the largest value no further than 1.5 times the IQR from the hinge. Unless otherwise specified, mean ± s.e.m. is indicated in scatter plots. Two-sided statistical tests were used. ****P < 0.0001, ***P < 0.001, **P < 0.01, *P < 0.05. MFI, mean fluorescence intensity.
Fig. 4 |
Fig. 4 |. Pharmacological blockade of ADRB1 prevents advanced exhaustion differentiation of antigen-specific CD8+ T cells and combines with checkpoint therapy to increase T cell function.
a, LCMV clone 13-infected mice were left untreated or treated with atenolol throughout the infection and analysed at day 37 p.i. Data are pooled from 3 independent experiments, n = 7 per group. Mann–Whitney test. Flow plot gated on CD8+ T cells. b, Frequency of TEXprog, TEXeff and TEXterm subtypes of gp33+ CD8+ T cells in mice treated with atenolol (n = 7) or without treatment (n = 7), pooled from 3 independent experiments. Mann–Whitney test. c, Flow plot gated on CD8+ T cells, depicting cytokine production of CD8+ T cells in mice treated with atenolol or without treatment at day 37 p.i. after antigen-specific stimulation with gp33 for 6 h. d, Cytokine production of CD8+ T cells in mice treated with atenolol (n = 8) or without treatment (n = 8) at day 37 p.i. after stimulation with gp33 for 6 h, pooled from 3 independent experiments. Mann–Whitney test. e,f, cAMP (e) and CREM (f) levels in gp33+ CD8+ T cells at day 37 p.i. in untreated mice and mice treated with atenolol. Histograms show representative cAMP staining (left, e) and bar graphs show cumulative data from 3 independent experiments (e, n = 10 or 14 mice per group) or CREM staining (f) from 2 independent experiments (n = 4 mice per group). Mann–Whitney test. g, Viral titres in the serum of LCMV clone 13-infected mice treated with atenolol (n = 10) or without treatment (n = 8), pooled from 3 independent experiments. Mann–Whitney test. h, Flow plots (left) and quantification (right, n = 17 each, pooled from 3 independent experiments) of ADRB1 expression by TEX isolated from YUMMER1.7 tumours implanted into WT B6 mice. Plots gated on the indicated cell populations. Friedman test with Dunn’s multiple comparisons test. PD-1, PD-1-negative CD8+. i, Experimental setup for YUMMER1.7 tumour experiments. j, Normalized tumour mass of YUMMER1.7 tumours relative to IgG control (IgG n = 14, atenolol n = 9, ICB n = 12, atenolol + ICB n = 13, pooled from 3 independent experiments). Plot shows median with IQR. Kruskal–Wallis test with Dunn’s multiple comparisons test. k, Flow plots depicting IFNγ and TNF production by CD8+ T cells isolated from YUMMER1.7 tumours following stimulation with phorbol 12-myristate-13-acetate (PMA) and ionomycin for 5 h. Plots gated on CD8+ T cells. l, Cytokine production by CD8+ T cells after stimulation with PMA and ionomycin (IgG n = 10, atenolol n = 9, ICB n = 7, atenolol + ICB n = 8, pooled from 2 independent experiments). Kruskal–Wallis test with Dunn’s multiple comparisons test. Unless otherwise specified, mean ± s.e.m. is indicated in scatter plots. Two-sided statistical tests were used. ****P < 0.0001, ***P < 0.001, **P < 0.01, *P < 0.05.
Fig. 5 |
Fig. 5 |. β-blocker treatment enables effective checkpoint therapy in pancreatic cancer.
a, ADRB1 expression on TEX subsets (n = 9, pooled from 2 independent experiments). One-way ANOVA with Friedman test. PD-1, PD-1-negative CD8+; TEXprog, SLAMF6+PD-1+ CD8+; TEXeff, CX3CR1+TIM3+PD-1+ CD8+; TEXterm, CD101+TIM3+PD-1+ CD8+. b, Experimental setup. c, Tumour volume of PDAC tumours determined by ultrasound (IgG n = 9; propranolol n = 9; ICB n = 10; propranolol + ICB n = 9). Ordinary two-way ANOVA with Tukey’s multiple comparisons test, pooled from two independent experiments. d, Normalized tumour mass of PDAC tumours relative to IgG control (IgG n = 21; propranolol n = 18; ICB n = 19; propranolol + ICB n = 24). Ordinary one-way ANOVA with Holm–Šídák’s multiple comparisons test. Pooled from five independent experiments. Colours same as c. e, Tumour volume determined by ultrasound in mice treated with isotype control (n = 5), propranolol and ICB (n = 5) or propranolol and ICB with CD8+ depletion (n = 7). Ordinary two-way ANOVA with Tukey’s multiple comparisons test, pooled from two independent experiments. f, Frequency of CD8+ T cells, expression of exhaustion markers and production of cytokines after stimulation with PMA and ionomycin (IgG n = 17; propranolol n = 13; ICB n = 14; propranolol + ICB n = 18 for CD8, PD-1, TIM3; IgG n = 7, propranolol n = 8; ICB n = 10; propranolol + ICB n = 9 for SLAMF6; IgG n = 12 propranolol n = 10 ICB n = 9, propranolol + ICB n = 14 for IFNγ and granzyme B, pooled from 4 independent experiments). Kruskal–Wallis test with Dunn’s multiple comparisons test. g, UMAP dimensional reduction of scRNA-seq data from PDAC tumours coloured by cell types. DCs, dendritic cells; ILCs, innate lymphoid cells; NK, natural killer. h, UMAP depicting eight T cell clusters within the T cell cluster identified in g. Stacked bar graphs depict the frequency of T cell clusters in different treatment conditions. TFH, follicular helper; TReg, regulatory. i, Heatmap of manually selected marker genes used for cell type annotation as depicted in h. j, Gene signature analysis in CD8+ T cells using AUCell. Gene signatures for T cell exhaustion and TRM cells were obtained from ref. and ref. , respectively. Boxplots show the median. The lower and upper hinges correspond to the first and third quartiles, respectively. The upper whisker extends from the hinge to the largest value no further than 1.5 times the IQR from the hinge. k, Heatmap of manually selected cytokines and chemokines in different treatment conditions. l, Venn diagram depicting upregulated genes in CD8+ T cells in the indicated treatment conditions versus IgG control. Numbers in the Venn diagram indicate the number of upregulated genes. Unless otherwise specified, mean ± s.e.m. is indicated in scatter plots. ****P < 0.0001, ***P < 0.001, **P < 0.01, *P < 0.05.

Comment in

  • Stress can be exhausting for T cells.
    Minton K. Minton K. Nat Rev Drug Discov. 2023 Nov;22(11):870. doi: 10.1038/d41573-023-00157-y. Nat Rev Drug Discov. 2023. PMID: 37783811 No abstract available.

References

    1. Amezquita RA & Kaech SM Immunology: the chronicles of T-cell exhaustion. Nature 543, 190–191 (2017). - PubMed
    1. Xie H. et al. Association of increased circulating catecholamine and glucocorticoid levels with risk of psychological problems in oral neoplasm patients. PLoS ONE 9, e99179 (2014). - PMC - PubMed
    1. Bastos DB et al. Circulating catecholamines are associated with biobehavioral factors and anxiety symptoms in head and neck cancer patients. PLoS ONE 13, e0202515 (2018). - PMC - PubMed
    1. Wherry EJ & Kurachi M. Molecular and cellular insights into T cell exhaustion. Nat. Rev. Immunol 15, 486–499 (2015). - PMC - PubMed
    1. Alfei F. et al. TOX reinforces the phenotype and longevity of exhausted T cells in chronic viral infection. Nature 571, 265–269 (2019). - PubMed

Publication types

MeSH terms