

Single-cell RNA sequencing shows the immune cell landscape in the kidneys of patients with idiopathic membranous nephropathy
- PMID: 37731504
- PMCID: PMC10507359
- DOI: 10.3389/fimmu.2023.1203062
Single-cell RNA sequencing shows the immune cell landscape in the kidneys of patients with idiopathic membranous nephropathy
Abstract
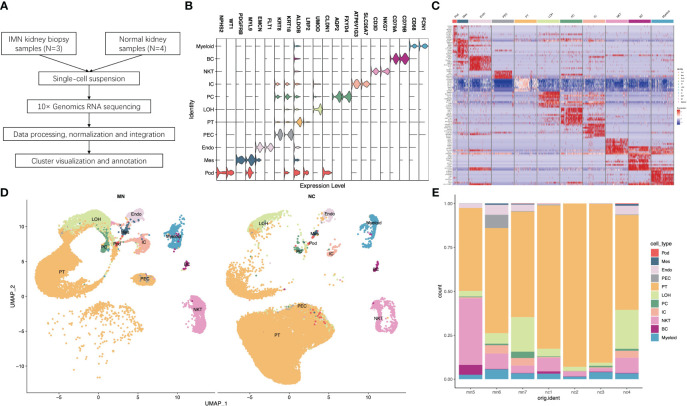
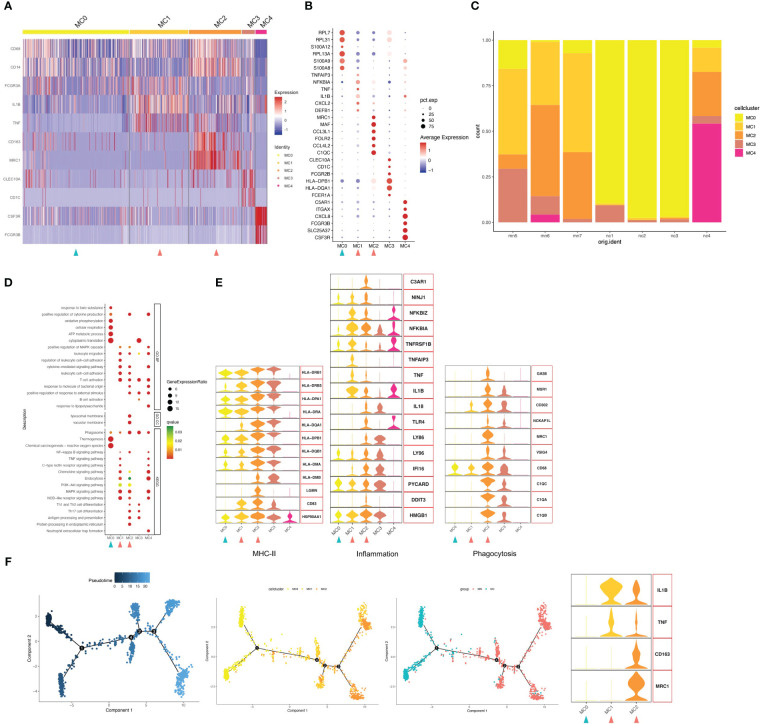
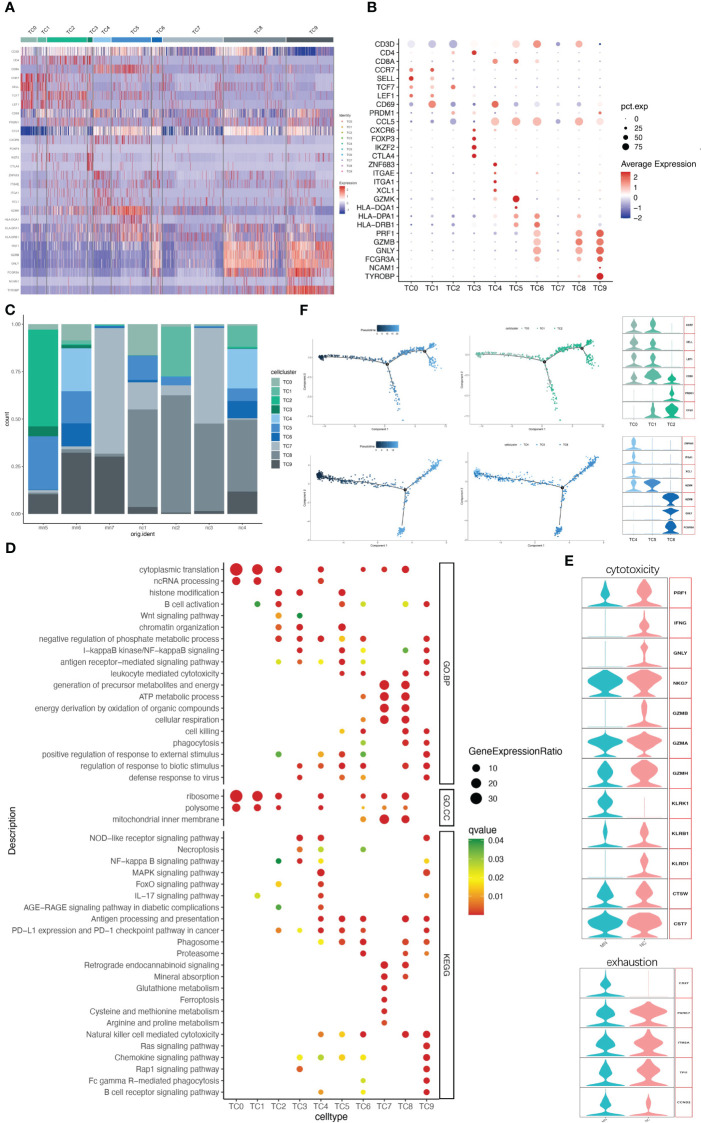
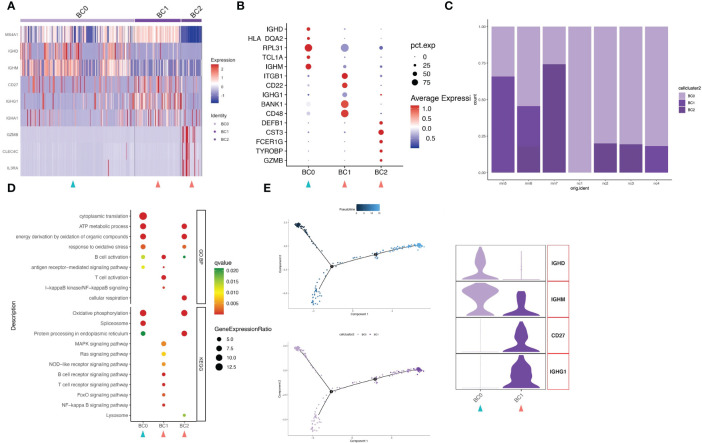
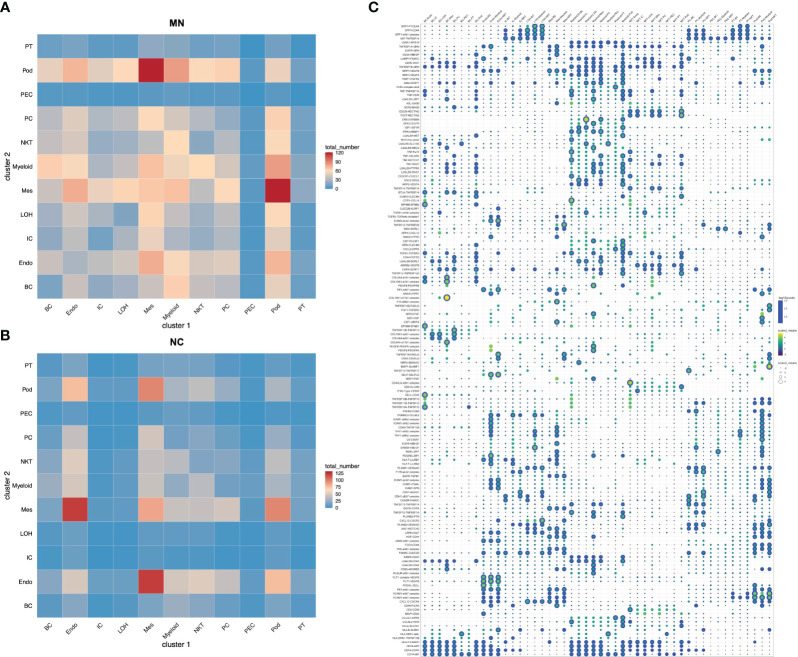
Idiopathic membranous nephropathy (IMN) is a leading pathological type of the adult primary nephrotic syndrome. Some patients develop end-stage renal disease due to poor response to treatment with steroid and immunosuppressive agents. In order to explore the molecular mechanism of IMN, we collected renal tissue samples from IMN patients and healthy controls and performed analysis by single-cell RNA sequencing (scRNA-seq). A total of 11 kidney cell clusters were identified, including multiple myeloid cell clusters, NK/T cell clusters, and B cell clusters. Most kidney parenchymal and immune cells were enriched in the regulation of immune response, inflammation, fibrosis and endoplasmic reticulum stress. The macrophage population in the IMN group showed a highly activated profile with up-regulated genes related to chemotaxis, inflammation, phagocytosis and fibrosis. CD8+ T cells continued to be cytotoxic in IMN; however, a transition to "inflammageing" GZMK+ CD8+ T cells was observed. The proportion of activated B cells in renal tissues of IMN patients was much higher than that of normal controls, indicating that B cells in IMN might be activated by constant antigenic stimulation. Moreover, the cell-cell interaction analysis revealed the potential communication between renal glomerular cells and immune cells in IMN. Overall, scRNA-seq was applied to IMN to unravel the characteristics of immune cells and elucidate possible underlying mechanisms involved in the pathogenesis of IMN.
Keywords: idiopathic membranous nephropathy; immune cell; pathogenesis; pro-inflammatory; single-cell RNA sequencing.
Copyright © 2023 Shi, Wang, Zhang, Ling, Chen, Wang, Liu and Ma.
Conflict of interest statement
The authors declare that the research was conducted in the absence of any commercial or financial relationships that could be construed as a potential conflict of interest.
Figures
Similar articles
-
Single-Cell Profiling Reveals Transcriptional Signatures and Cell-Cell Crosstalk in Anti-PLA2R Positive Idiopathic Membranous Nephropathy Patients.Front Immunol. 2021 May 31;12:683330. doi: 10.3389/fimmu.2021.683330. eCollection 2021. Front Immunol. 2021. PMID: 34135910 Free PMC article.
-
Proteomic analysis of glomeruli, tubules and renal interstitium in idiopathic membranous nephropathy (IMN): A statistically observational study.Medicine (Baltimore). 2023 Dec 15;102(50):e36476. doi: 10.1097/MD.0000000000036476. Medicine (Baltimore). 2023. PMID: 38115247 Free PMC article.
-
Application of miR-193a/WT1/PODXL axis to estimate risk and prognosis of idiopathic membranous nephropathy.Ren Fail. 2019 Nov;41(1):704-717. doi: 10.1080/0886022X.2019.1642210. Ren Fail. 2019. PMID: 31352863 Free PMC article.
-
Immune system-mediated cellular and molecular mechanisms in idiopathic membranous nephropathy pathogenesis and possible therapeutic targets.Life Sci. 2019 Dec 1;238:116923. doi: 10.1016/j.lfs.2019.116923. Epub 2019 Oct 11. Life Sci. 2019. PMID: 31610191 Review.
-
Idiopathic membranous nephropathy and IgG4: an interesting relationship.Clin Nephrol. 2014 Jul;82(1):7-15. doi: 10.5414/CN107768. Clin Nephrol. 2014. PMID: 23380389 Free PMC article. Review.
Cited by
-
GZMK+CD8+ T cells Target A Specific Acinar Cell Type in Sjögren's Disease.Res Sq [Preprint]. 2024 Jul 11:rs.3.rs-3601404. doi: 10.21203/rs.3.rs-3601404/v2. Res Sq. 2024. PMID: 38196575 Free PMC article. Preprint.
-
Impact of immune cell metabolism on membranous nephropathy and prospective therapy.Commun Biol. 2025 Mar 10;8(1):405. doi: 10.1038/s42003-025-07816-3. Commun Biol. 2025. PMID: 40065158 Free PMC article. Review.
-
Innate immune cells in acute and chronic kidney disease.Nat Rev Nephrol. 2025 Jul;21(7):464-482. doi: 10.1038/s41581-025-00958-x. Epub 2025 Apr 22. Nat Rev Nephrol. 2025. PMID: 40263532 Review.
-
Identification Exploring the Mechanism and Clinical Validation of Mitochondrial Dynamics-Related Genes in Membranous Nephropathy Based on Mendelian Randomization Study and Bioinformatics Analysis.Biomedicines. 2025 Jun 17;13(6):1489. doi: 10.3390/biomedicines13061489. Biomedicines. 2025. PMID: 40564208 Free PMC article.
-
Multi-omics insights of immune cells in the risk and prognosis of idiopathic membranous nephropathy.Commun Biol. 2025 Aug 10;8(1):1192. doi: 10.1038/s42003-025-08642-3. Commun Biol. 2025. PMID: 40783650 Free PMC article.
References
Publication types
MeSH terms
LinkOut - more resources
Full Text Sources
Medical
Molecular Biology Databases
Research Materials