. 2022 Jun;1(2):183-197.
doi: 10.1002/mlf2.12022. Epub 2022 Jun 15.

Distinct gut microbiota and health outcomes in asymptomatic infection, viral nucleic acid test re-positive, and convalescent COVID-19 cases

Affiliations

Distinct gut microbiota and health outcomes in asymptomatic infection, viral nucleic acid test re-positive, and convalescent COVID-19 cases

Ruqin Lin et al. mLife. 2022 Jun.

Abstract

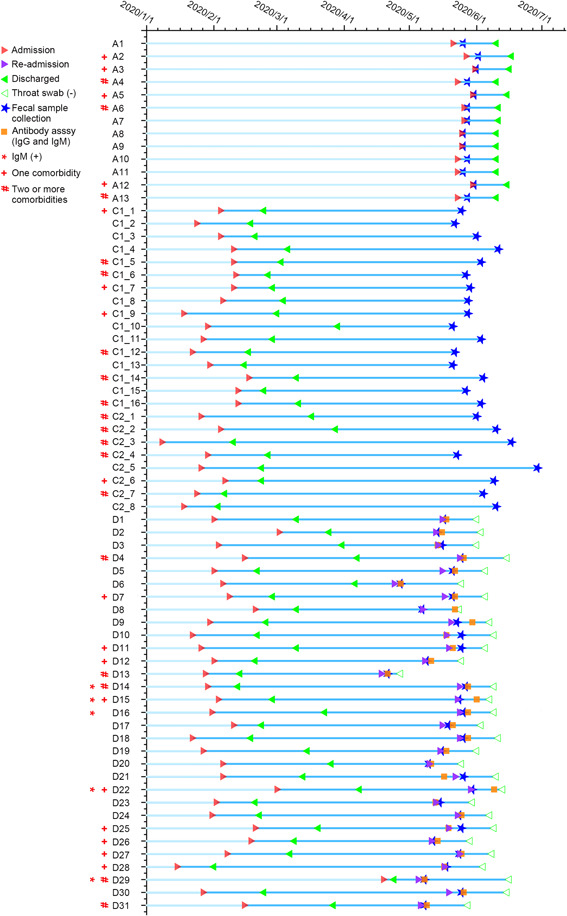
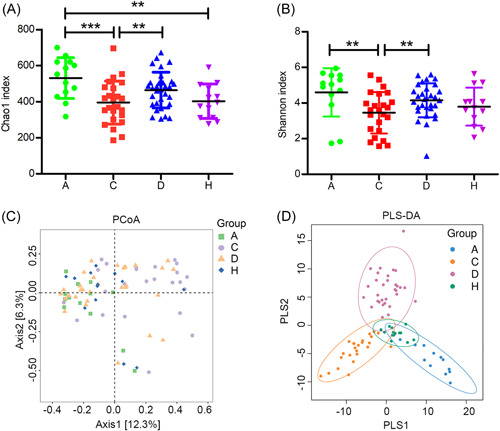
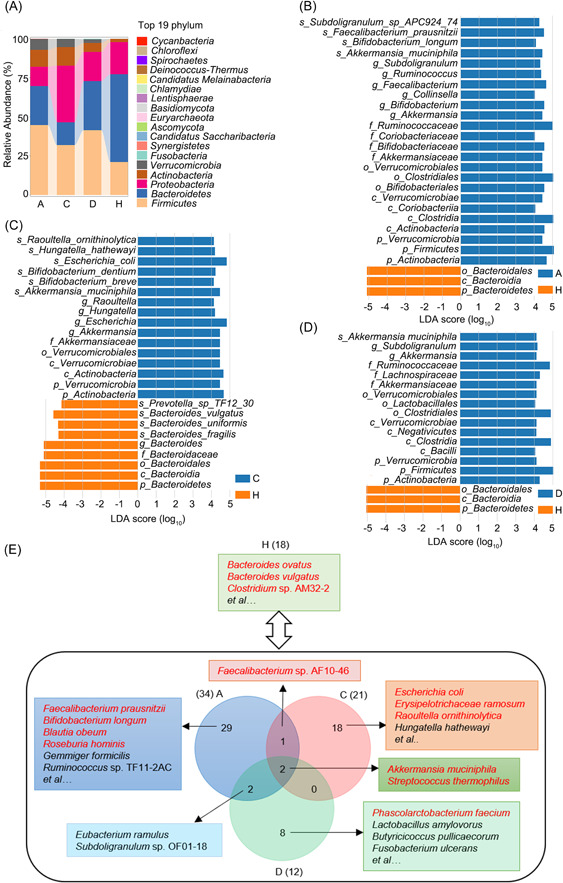
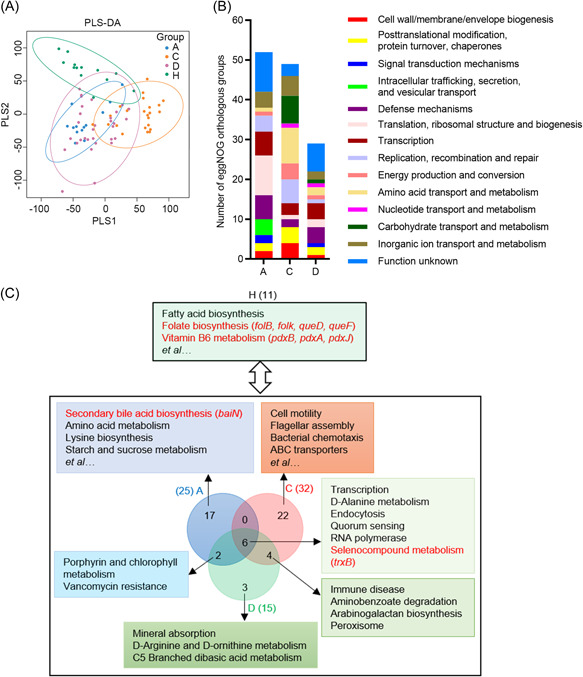
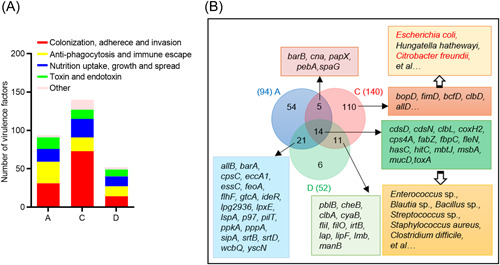
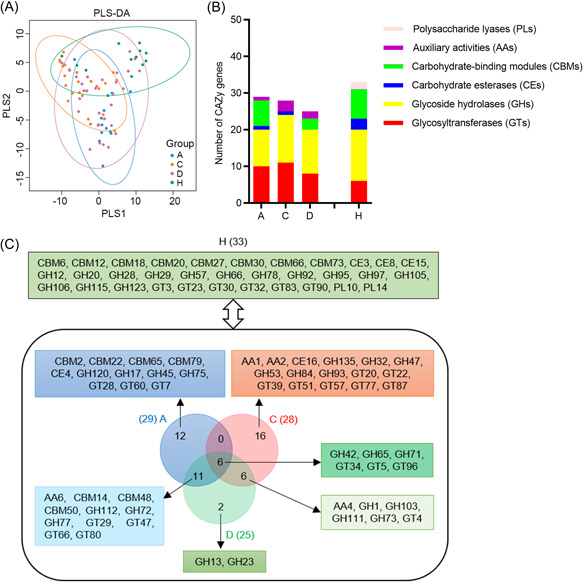
Gut microbiota composition is suggested to associate with coronavirus disease 2019 (COVID-19) severity, but the impact of gut microbiota on health outcomes is largely unclear. We recruited 81 individuals from Wuhan, China, including 13 asymptomatic infection cases (Group A), 24 COVID-19 convalescents with adverse outcomes (Group C), 31 severe acute respiratory syndrome coronavirus 2 (SARS-CoV-2) re-positive cases (Group D), and 13 non-COVID-19 healthy controls (Group H). The microbial features of Groups A and D were similar and exhibited higher gut microbial diversity and more abundant short-chain fatty acid (SCFA)-producing species than Group C. Group C was enriched with opportunistic pathogens and virulence factors related to adhesion and toxin production. The abundance of SCFA-producing species was negatively correlated, while Escherichia coli was positively correlated with adverse outcomes. All three groups (A, C, and D) were enriched with the mucus-degrading species Akkermansia muciniphila, but decreased with Bacteroides-encoded carbohydrate-active enzymes. The pathways of vitamin B6 metabolic and folate biosynthesis were decreased, while selenocompound metabolism was increased in the three groups. Specifically, the secondary bile acid (BA) metabolic pathway was enriched in Group A. Antibiotic resistance genes were common among the three groups. Conclusively, the gut microbiota was related to the health outcomes of COVID-19. Dietary supplementations (SCFAs, BA, selenium, folate, vitamin B6) may be beneficial to COVID-19 patients.

Keywords: COVID‐19; SARS‐CoV‐2; gut microbiota; health outcomes; re‐positive.


Conflict of interest statement

The authors declare no conflict of interests.

Figures

Figure 1
Figure 1
Schematic diagram of fecal sample collection and patient information. Three categories of coronavirus disease 2019 (COVID‐19)‐related cases were recruited, including 13 asymptomatic infection (Group A), 24 COVID‐19 convalescents (Group C), 31 discharged patients with recurrent severe acute respiratory syndrome coronavirus 2 (SARS‐CoV‐2) positivity (Group D). The infection period in Group A was 16–21 days (median 16 days), and the fecal samples were collected within 1–6 days (median 2 days). The acute infection period in Group C was 12–60 days (median 25 days), and the fecal samples were collected after the patients' discharge for 53–128 days (median 92.5 days). The acute infection period in Group D was 5–61 days (median 27 days) and recurred SARS‐CoV‐2 positive on Days 11–106 (median 70) after the first discharge. The fecal samples of Group D were collected on Days 0–7 (median 2) after recurred SARS‐CoV‐2 positive (re‐admission). The re‐positive patients of Group D showed SARS‐CoV‐2 negative on Days 9–42 (median 18) after re‐admission.
Figure 2
Figure 2
Variation of microbial α‐ and β‐diversity in coronavirus disease 2019 (COVID‐19)‐related and control groups. Microbial α‐diversity was represented by Chao1 index (A) and Shannon index (B) in Group A (N = 13), Group C (N = 24), Group D (N = 31), and Group H (N = 13). One‐way analysis of variance with the least significant difference (LSD) test was used to calculate the variation in microbial α‐diversity. Data are shown as mean ± SD. **p < 0.01; ***p < 0.001. Microbial β‐diversity variation was visualized by (C) principal coordinate analysis (PCoA) and (D) partial least‐squares discriminant analysis (PLS‐DA) ordination in four groups. PCoA ordination was calculated based on the Bray–Curtis distance matrix.
Figure 3
Figure 3
Microbial taxonomic composition and enriched taxa in COVID‐19‐related and control groups. (A) Average relative abundance of microbial phyla in four groups. The Firmicutes/Bacteroidetes ratio was calculated in each group, and a t test was performed to compare the differences between the control group (H) and each COVID‐19‐related group (A/C/D). Enriched microbial taxa in Group A (B), Group C (C), and Group D (D) compared with Group H (linear discriminant analysis effect size analysis, least‐squares discriminant analysis (LDA) score > 4, p < 0.05). (E) Representative enriched microbial species in Groups A, C, D, and H (LDA score > 3, p < 0.05). There were 34, 21, 12, and 18 species enriched in Groups A, C, D, and H, respectively. Two enriched species, Akkermansia muciniphila and Streptococcus thermophilus, were shared by three COVID‐19‐related groups. Two enriched species, Eubacterium ramulus and Subdoligranulum sp. OF01‐18, were shared by Groups A and D. The bacterial Growth Rate InDex (GRiD) was calculated based on read coverage differences in bacterial replication origin and terminal regions. A one‐sample t test was used to assess the GRiD values. The fast‐growing species are formatted in red font.
Figure 4
Figure 4
Microbial functional pathways enriched in COVID‐19‐related and control groups, The functional profiling of gut microbiota in COVID‐19‐related and healthy groups based on eggNOG and KO annotation. (A) Partial least‐squares discriminant analysis (PLS‐DA) ordination in Groups A, C, D, and H according to eggNOG annotations. (B) Number of enriched eggNOG orthologous groups in Groups A, C, and D compared with Group H (linear discriminant analysis effect size (LEfSe) analysis, LDA score > 2, p < 0.05). There were 53, 49, and 29 enriched eggNOG orthologous groups in Groups A, C, and D, respectively. (C) Enriched microbial functional pathways in Groups A, C, D, and H based on KO annotations (LEfSe analysis, LDA score > 2, p < 0.05). There were 25, 32, 15, and 11 enriched functional pathways in Groups A, C, D, and H, respectively. Six enriched pathways were shared by three COVID‐19 groups, two were shared by Groups A and D, and four were shared by Groups C and D. The enriched genes and pathways are formatted in red font.
Figure 5
Figure 5
Virulence genes enriched in COVID‐19‐related groups. (A) Number of enriched virulence genes in COVID‐19‐related groups compared with the healthy group (LEfSe analysis, LDA score > 2, p < 0.05). The virulent genes were annotated based on the virulence factor database (VFDB). Group A had 31 enriched genes related to colonization, 28 related to anti‐phagocytosis and immune escape, 17 related to nutrition uptake, growth, and spread and 15 related to toxin and endotoxin production. Group C had 73 enriched genes related to colonization, 18 related to anti‐phagocytosis, and immune escape, 24 related to nutrition uptake, growth, and spread, and 12 related to toxin and endotoxin production. Group D had 14 enriched genes related to colonization, 13 related to anti‐phagocytosis and immune escape, 13 related to nutrition uptake, growth, and spread, and 12 related to toxin and endotoxin production. (B) Enriched virulence genes in COVID‐19‐related groups compared with the control group. The COVID‐19‐related groups had 14 shared virulence genes, mainly derived from Enterococcus sp., Blautia sp., Bacillus sp., Streptococcus sp., Staphylococcus aureus, Clostridium difficile, and other opportunistic pathogens, based on sequence similarity analysis. Group C had 110 specific virulence genes, mainly derived from Escherichia coli, Hungatella hathewayi, and Citrobacter freundii.
Figure 6
Figure 6
Carbohydrate‐active enzyme (CAZy) families enriched in COVID‐19‐related groups. (A) Partial least‐squares discriminant analysis (PLS‐DA) ordination in Groups A, C, D, and H according to CAZy annotations. (B) Number of enriched CAZy families in COVID‐19‐related groups compared with the control group (LEfSe analysis, LDA score > 2, p < 0.05). Thirty‐three CAZy families were enriched in Group H, including 14 glycoside hydrolases (GHs), 8 carbohydrate‐binding modules (CBMs), 6 glycosyltransferases (GTs), 3 carbohydrate esterases (CEs), and 2 polysaccharide lyases (PLs). Twenty‐nine CAZy families were enriched in Group A, including 10 GTs, 10 GHs, 1 CE, 7 CBMs, and 1 auxiliary activities (AAs). Twenty‐eight CAZy enriched in Group C, including 11 GTs, 13 GHs, 1 CE, and 3 AAs. Twenty‐five CAZy enriched in Group D, including 8 GTs, 12 GHs, 3 CBMs, and 2 AAs. (C) Enriched CAZy families in COVID‐19‐related groups compared with the control group. A total of 6 enriched CAZy families were shared by 3 COVID‐19‐related groups, 11 shared by Groups A and D, and 6 shared by Groups C and D.

References

    1. Guan WJ, Ni ZY, Hu Y, Liang WH, Ou CQ, He JX, et al. Clinical characteristics of coronavirus disease 2019 in China. N Engl J Med. 2020;382:1708–20. - PMC - PubMed
    1. Cheung KS, Hung IFN, Chan PPY, Lung KC, Tso E, Liu R, et al. Gastrointestinal manifestations of SARS‐CoV‐2 infection and virus load in fecal samples from a Hong Kong Cohort: systematic review and meta‐analysis. Gastroenterology. 2020;159:81–95. - PMC - PubMed
    1. Wang W, Xu Y, Gao R, Lu R, Han K, Wu G, et al. Detection of SARS‐CoV‐2 in different types of clinical specimens. JAMA. 2020;323:1843–4. - PMC - PubMed
    1. Xiao F, Sun J, Xu Y, Li F, Huang X, Li H, et al. Infectious SARS‐CoV‐2 in feces of patient with severe COVID‐19. Emerging Infect Dis. 2020;26:1920–2. - PMC - PubMed
    1. Hoffmann M, Kleine‐Weber H, Schroeder S, Krüger N, Herrler T, Erichsen S, et al. SARS‐CoV‐2 cell entry depends on ACE2 and TMPRSS2 and is blocked by a clinically proven protease inhibitor. Cell. 2020;181:271–80.e8. - PMC - PubMed