. 2023 Aug 16;26(10):107629.
doi: 10.1016/j.isci.2023.107629. eCollection 2023 Oct 20.

A GWAS in the pandemic epicenter highlights the severe COVID-19 risk locus introgressed by Neanderthals

Affiliations

A GWAS in the pandemic epicenter highlights the severe COVID-19 risk locus introgressed by Neanderthals

Matteo Breno et al. iScience. .

Abstract

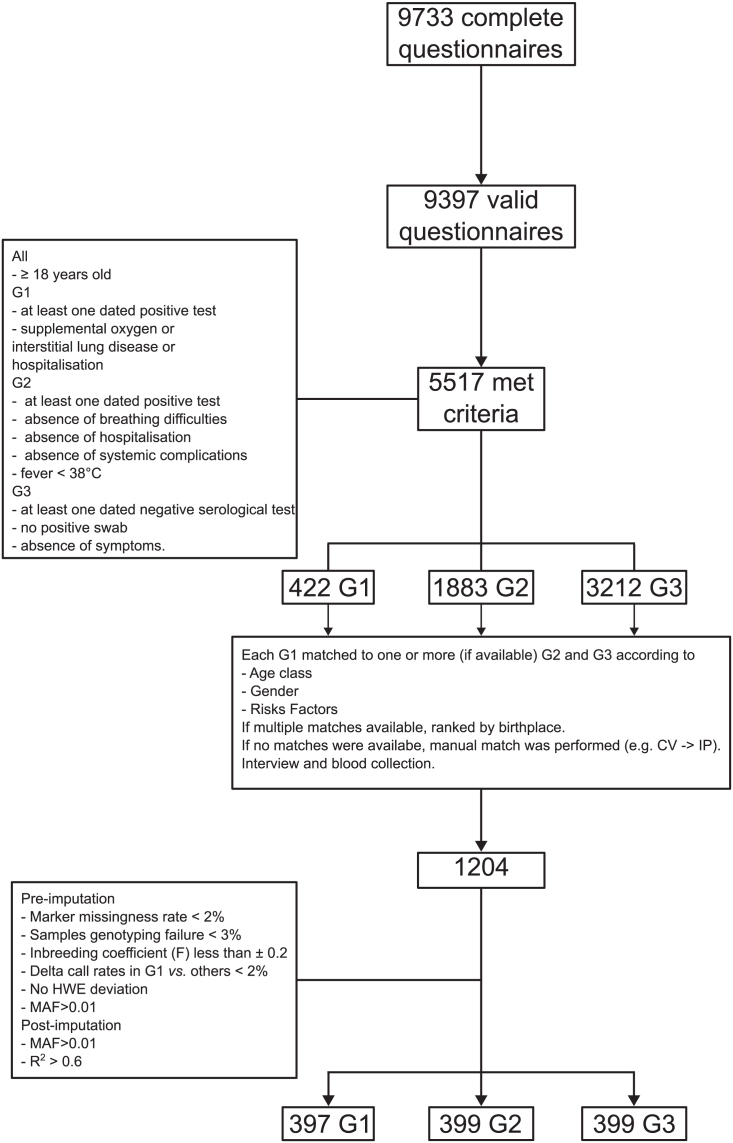
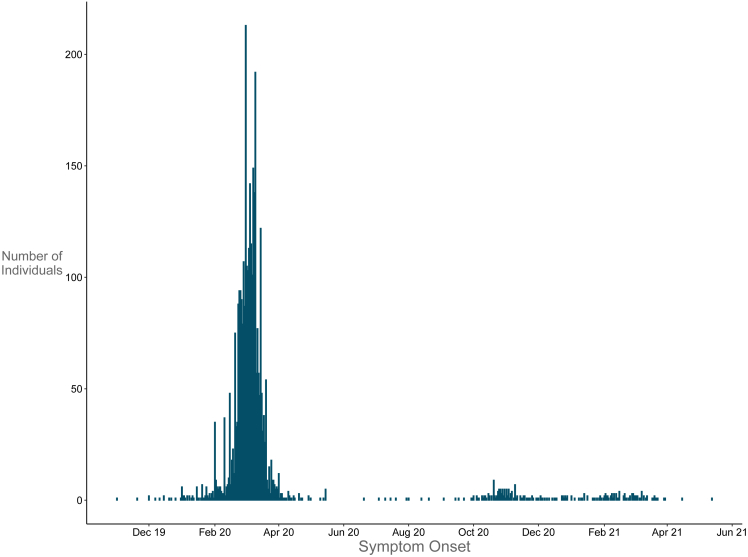
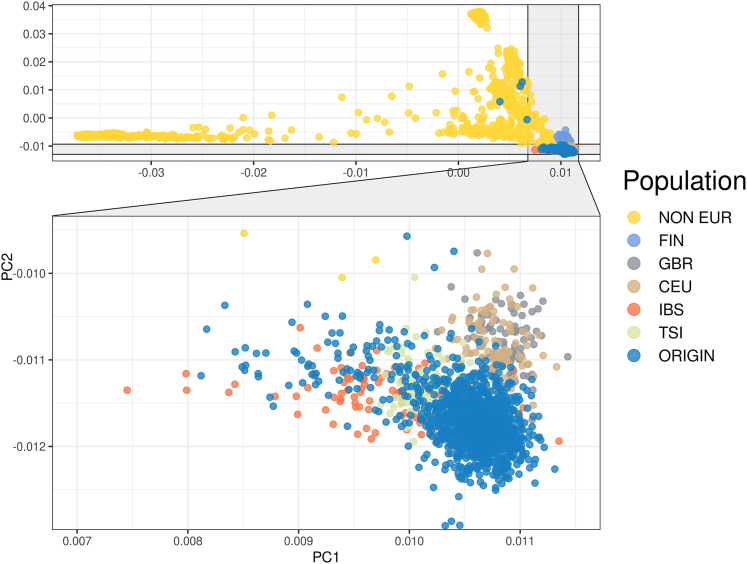
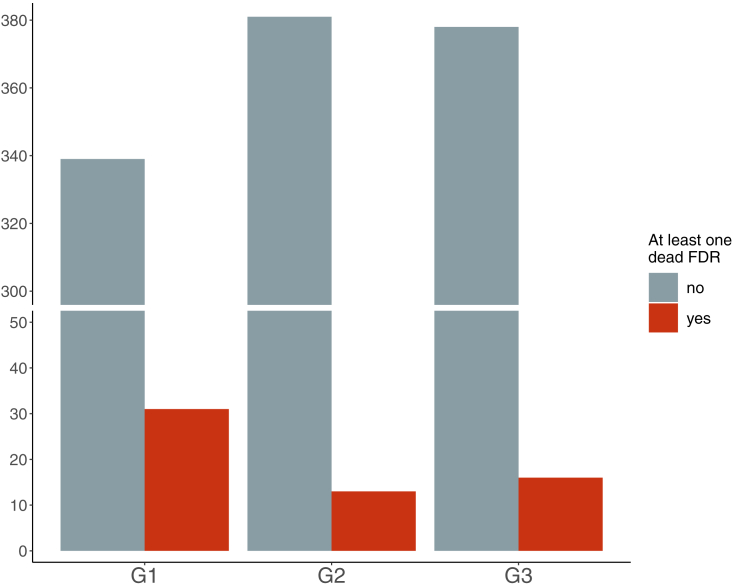
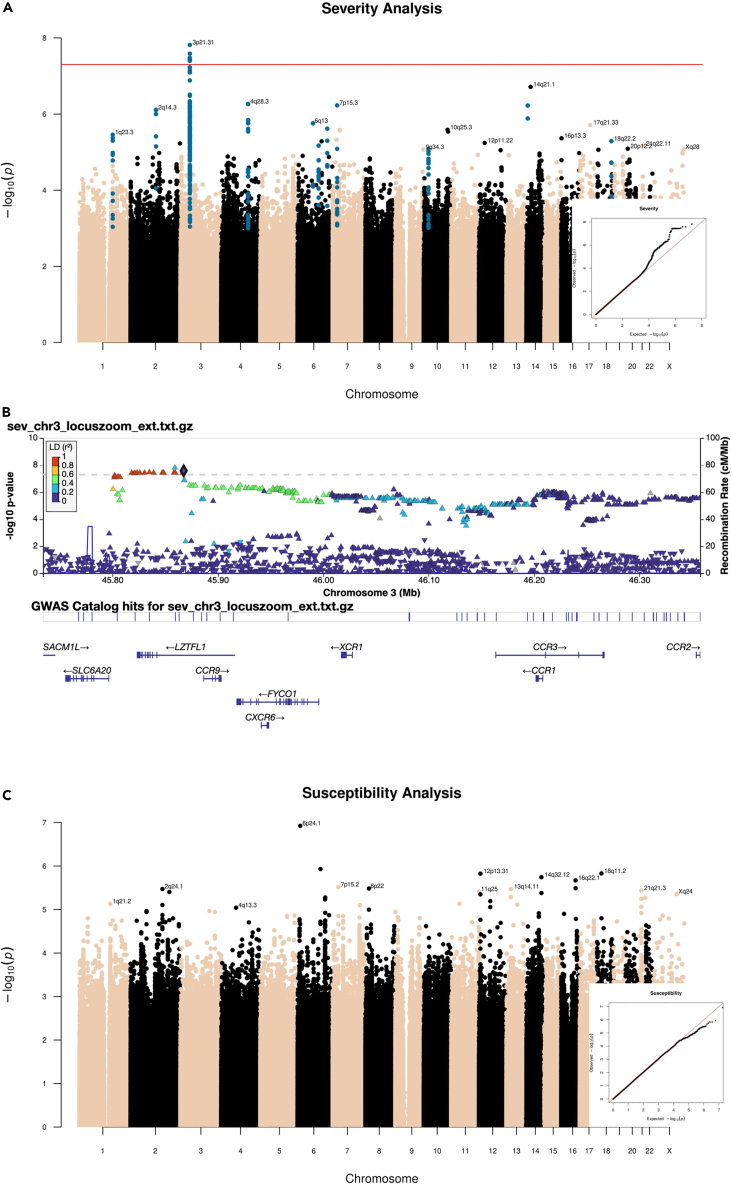
Large GWAS indicated that genetic factors influence the response to SARS-CoV-2. However, sex, age, concomitant diseases, differences in ancestry, and uneven exposure to the virus impacted the interpretation of data. We aimed to perform a GWAS of COVID-19 outcome in a homogeneous population who experienced a high exposure to the virus and with a known infection status. We recruited inhabitants of Bergamo province-that in spring 2020 was the epicenter of the SARS-Cov-2 pandemic in Europe-via an online questionnaire followed by personal interviews. Cases and controls were matched by age, sex and risk factors. We genotyped 1195 individuals and replicated the association at the 3p21.31 locus with severity, but with a stronger effect size that further increased in gravely ill patients. Transcriptome-wide association study highlighted eQTLs for LZTFL1 and CCR9. We also identified 17 loci not previously reported, suggestive for an association with either COVID-19 severity or susceptibility.

Keywords: Genomics; Public health; Respiratory medicine; Virology.


Conflict of interest statement

The authors declare no competing interests.

Figures

None
Graphical abstract
Figure 1
Figure 1
Experimental design and analysis work-flow
Figure 2
Figure 2
Symptoms onset Declared symptoms onset of the participants to the questionnaire who reported at least one SARS-Cov2 positive tests and COVID-19 related symptoms with the date of onset or of hospital admission (n = 3413).
Figure 3
Figure 3
Population stratification Principal Component Analysis of the merged callset of the ORIGIN cohort and the 1000 genome populations. ORIGIN, ORIGIN cohort. CEU, Utah residents with Northern and Western European ancestry. GBR, British in England and Scotland. FIN, Finnish in Finland. IBS, Iberian populations in Spain. TSI, Toscani in Italy. NON EUR, other, non-European, 1000 genomes populations. The 4 ORIGIN non-European participants are all from South America.
Figure 4
Figure 4
Dead first-degree relatives Number of subjects reporting at least one first degree relative that died after SARS-Cov2 infection across the three group. FDR, first degree relative.
Figure 5
Figure 5
GWAS results (A) Manhattan plot and q-q plot (right bottom) of the Severity analysis of the ORIGIN cohort. The horizontal red line is drawn at the genome-wide significance threshold (P=5e-08). (B) Locus plot of the significant peak on chromosome 3 in the ORIGIN Severity analysis. Markers are colored according to their linkage disequilibrium (LD, r2) with the lead variant. Bottom, gene annotations for the region. (C) Manhattan plot and QQ plots with results of GWAS susceptibility analysis. The QQ plot shows a slight deflection (genomic inflation factor = 1.012.
Figure 6
Figure 6
Comparison with COVID-19-HGI lead variants Lead variants for severity (circles) and susceptibility (triangles) reported by COVID-19-HGI. Each point represents the odds ratio (with 95% confidence intervals) from the COVID -19 HGI (purple) or the ORIGIN (dark red) studies, respectively. The last marker (X:15602217:T:C) was not present in the final ORIGIN dataset.
Figure 7
Figure 7
The distribution of the ABO blood groups among groups

References

    1. Perico N., Fagiuoli S., Di Marco F., Laghi A., Cosentini R., Rizzi M., Gianatti A., Rambaldi A., Ruggenenti P., La Vecchia C., et al. Bergamo and Covid-19: How the Dark Can Turn to Light. Front. Med. 2021;8:609440. doi: 10.3389/fmed.2021.609440. - DOI - PMC - PubMed
    1. Horowitz J. The Lost Days that Made Bergamo a Coronavirus Tragedy. N. Y. Times. 2020
    1. Meduri G. Terminati Screening Sierologici Nella Bassa Valle Seriana. 2020. https://www.lombardianotizie.online/sierologici-valle-seriana/
    1. Williamson E.J., Walker A.J., Bhaskaran K., Bacon S., Bates C., Morton C.E., Curtis H.J., Mehrkar A., Evans D., Inglesby P., et al. Factors associated with COVID-19-related death using OpenSAFELY. Nature. 2020;584:430–436. doi: 10.1038/s41586-020-2521-4. - DOI - PMC - PubMed
    1. Severe Covid-19 GWAS Group. Ellinghaus D., Degenhardt F., Bujanda L., Buti M., Albillos A., Fernández J., Fernández J., Prati D., Baselli G., et al. Genomewide Association Study of Severe Covid-19 with Respiratory Failure. N. Engl. J. Med. 2020;383:1522–1534. doi: 10.1056/nejmoa2020283. - DOI - PMC - PubMed

LinkOut - more resources