[Preprint]. 2024 Apr 1:arXiv:2309.04019v2.

Evaluation of large language models for discovery of gene set function

Affiliations

Evaluation of large language models for discovery of gene set function

Mengzhou Hu et al. ArXiv. .

Update in

Abstract

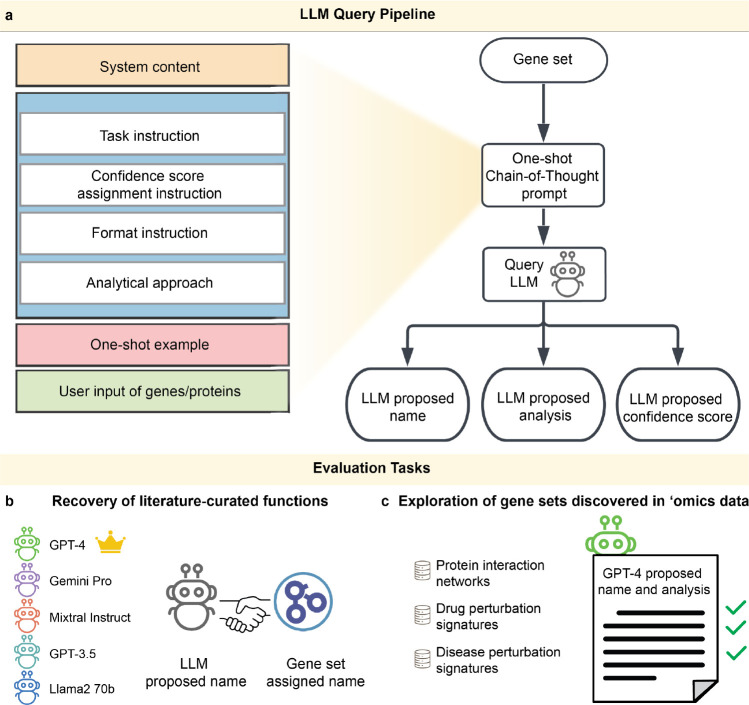
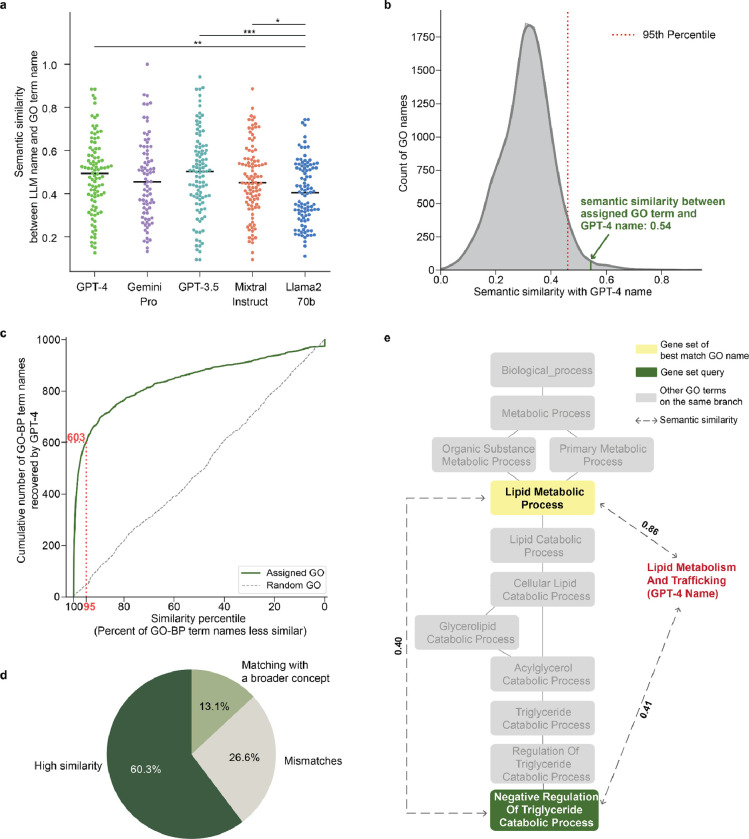
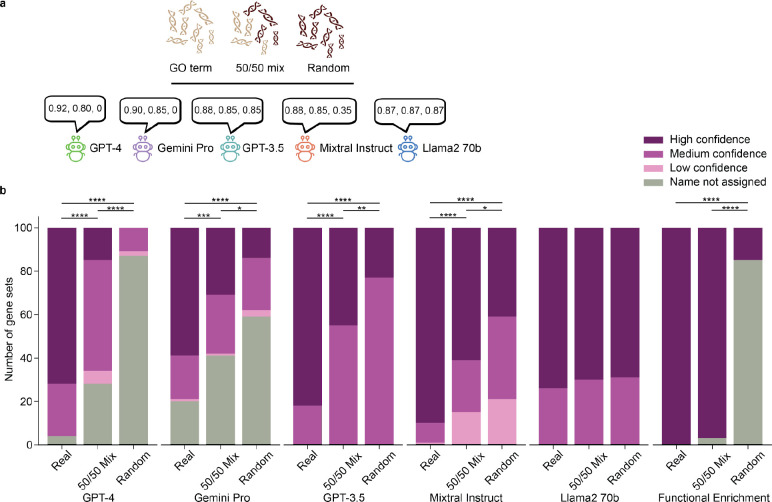
Gene set analysis is a mainstay of functional genomics, but it relies on curated databases of gene functions that are incomplete. Here we evaluate five Large Language Models (LLMs) for their ability to discover the common biological functions represented by a gene set, substantiated by supporting rationale, citations and a confidence assessment. Benchmarking against canonical gene sets from the Gene Ontology, GPT-4 confidently recovered the curated name or a more general concept (73% of cases), while benchmarking against random gene sets correctly yielded zero confidence. Gemini-Pro and Mixtral-Instruct showed ability in naming but were falsely confident for random sets, whereas Llama2-70b had poor performance overall. In gene sets derived from 'omics data, GPT-4 identified novel functions not reported by classical functional enrichment (32% of cases), which independent review indicated were largely verifiable and not hallucinations. The ability to rapidly synthesize common gene functions positions LLMs as valuable 'omics assistants.


Conflict of interest statement

Author Declarations TI is a co-founder, member of the advisory board, and has an equity interest in Data4Cure and Serinus Biosciences. TI is a consultant for and has an equity interest in Ideaya Biosciences. The terms of these arrangements have been reviewed and approved by the University of California San Diego in accordance with its conflict-of-interest policies.

Figures

Extended Data Fig. 1:
Extended Data Fig. 1:. Schematic of the citation module.
a, GPT-4 is asked to provide gene symbol keywords and functional keywords separately. Multiple gene keywords and functions are combined and used to search PubMed for relevant paper titles and abstracts in the scientific literature. GPT-4 is queried to evaluate each abstract, saving supporting references. b, Prompts used to query the GPT-4 model.
Extended Data Fig. 2:
Extended Data Fig. 2:. Distribution of GO term gene sizes.
a, Distribution of term size (number of genes) for terms in the Biological Process branch (GO-BP). Terms with 3–100 genes shown (n = 8,910). b, Distribution of term size for the 1000 GO terms used in Task 1.
Extended Data Fig. 3:
Extended Data Fig. 3:. Evaluation of GPT-4 in recovery of GO-CC and GO-MF names.
a, Cumulative number of GO-CC term names recovered by GPT-4 (y-axis) at a given similarity percentile (x-axis). 0 = least similar, 100 = most similar. Blue curve: semantic similarities between GPT-4 names and assigned GO-CC term names. Grey dashed curve: semantic similarities between GPT-4 names and random GO-CC term names. The red dotted line marks that 642 of the 1000 sampled GO-CC names are recovered by GPT-4 at a similarity percentile of 95%. b, As for panel a, but for GO-MF terms rather than GO-CC. The red dotted line marks that 757 of the 1000 sampled GO-MF names are recovered by GPT-4 at a similarity percentile of 95%.
Extended Data Fig. 4:
Extended Data Fig. 4:. Distribution of ‘omics gene set sizes.
Distribution shown for all ‘omics gene sets considered in this study (n = 300).
Extended Data Fig. 5:
Extended Data Fig. 5:. Evaluation of required overlap.
The percentage of omics gene sets (y-axis) matched to GO terms with the required overlap (Jaccard Index, x-axis). The vertical red dashed line marks a threshold Jaccard Index = 0.1.
Fig. 1:
Fig. 1:. Use and evaluation of LLMs for functional analysis of gene sets.
a, The LLM prompt (left boxes) includes system content, detailed chain of thought instructions, and an example gene set query with desired response (full prompt given in Extended Data Table 1). The specific list of genes is inserted into the “User input of genes/proteins” field at the end of the prompt template, resulting in generation of a proposed name, a supporting analysis essay and a confidence score (right flowchart). b, Benchmarking LLM names against names assigned by GO (Evaluation Task 1). The proposed name from each of five LLMs (left robot icons) is compared to the name assigned by the GO curators (handshake icon). GPT-4 (crowned) was the winning model for this task. c, Exploration of gene sets discovered in ‘omics data (Evaluation Task 2). The GPT-4 name and analysis are scored for novelty and accuracy (right green check marks). Gene sets derived from three different data types (left database icons).
Fig. 2:
Fig. 2:. Evaluation of LLMs in recovering GO gene set names.
a, Performance of each LLM (colors) is scored by the semantic similarity between its proposed name for a gene set and the name assigned by the GO curators. Results for 100 GO terms are shown (dots; black horizontal lines show median semantic similarities). Significant difference in distributions is denoted by asterisks (*p<0.05; **p<0.01; ***p<0.001) using Mann–Whitney U test. b, Percentile calibration of semantic similarity between the GO and GPT-4 names for a gene set, shown for the GO term “Response to X-ray” and the corresponding GPT-4 name “DNA Damage Response and Repair”. The plot shows the semantic similarity between these two names (vertical dark green line, 0.54) versus the complete distribution of semantic similarity scores between the GPT-4 name and each name in the GO Biological Process database (GO-BP, gray). The score of the GPT-4 name is converted to a percentile, i.e. the percentage of all names in GO with lower similarity (here, 99%). Red dashed line denotes the 95th percentile threshold. c, Cumulative number of GO term names recovered by GPT-4 (y-axis) at a given similarity percentile (x-axis). 0 = least similar, 100 = most similar. Dark green curve: semantic similarities between GPT-4 names and assigned GO term names. Grey dashed curve: semantic similarities between GPT-4 names and random GO term names. The red dotted line marks that 603 of 1000 sampled GO names are recovered by GPT-4 at the 95th similarity percentile. d, Pie chart summarizing the results of the GPT-4 name / GO name similarity comparison. e, Hierarchical view of the GO term “Negative Regulation of Triglyceride Catabolic Process” and its ancestors. Blue box: gene set query, yellow box: gene set of best match GO name (most similar GO name to GPT-4 name), dashed lines with arrows: semantic similarities between names, red text: GPT-4 proposed name.
Fig. 3:
Fig. 3:. Evaluation of LLM self-confidence.
a, Investigation of model-assigned confidence scores (chat bubbles) for the ability to distinguish actual GO terms from 50/50 mix and random gene sets (light DNA strands from the same GO term, dark DNA strands randomly selected from outside the GO term). b, Bar graphs showing the confidence rating assigned by each model for real, contaminated, or random gene sets. IncreasingV shades of purple indicate low to high score bins. “High confidence” (dark purple): 0.87–1.00; “Medium confidence” (medium purple): 0.80–0.86; “Low confidence” (light purple): 0.01–0.79; and “Name not assigned” (gray): 0. For comparison to functional enrichment (rightmost group of bars), “High confidence” for a gene set is defined as p ≤ 0.05 (dark purple, Benjamini-Hochberg correction), otherwise “Name not assigned” (gray) is used. Significant difference in confidence distributions between real, 50/50 mix and random is denoted by asterisks (*p<0.05; **p<0.01; ***p<0.001, ****p<0.0001) using chi-squared test.

Similar articles

References

    1. Zeeberg B. R. et al. GoMiner: a resource for biological interpretation of genomic and proteomic data. Genome Biol. 4, R28 (2003). - PMC - PubMed
    1. Breitling R., Amtmann A. & Herzyk P. Iterative Group Analysis (iGA): a simple tool to enhance sensitivity and facilitate interpretation of microarray experiments. BMC Bioinformatics 5, 34 (2004). - PMC - PubMed
    1. Beissbarth T. & Speed T. P. GOstat: find statistically overrepresented Gene Ontologies within a group of genes. Bioinformatics 20, 1464–1465 (2004). - PubMed
    1. Subramanian A. et al. Gene set enrichment analysis: a knowledge-based approach for interpreting genome-wide expression profiles. Proc. Natl. Acad. Sci. U. S. A. 102, 15545–15550 (2005). - PMC - PubMed
    1. Al-Shahrour F. et al. From genes to functional classes in the study of biological systems. BMC Bioinformatics 8, 114 (2007). - PMC - PubMed

Publication types