[Preprint]. 2023 Sep 6:2023.09.06.556565.
doi: 10.1101/2023.09.06.556565.

Anatomical Modeling and Optimization of Speckle Contrast Optical Tomography

Affiliations

Anatomical Modeling and Optimization of Speckle Contrast Optical Tomography

Chen-Hao P Lin et al. bioRxiv. .

Abstract

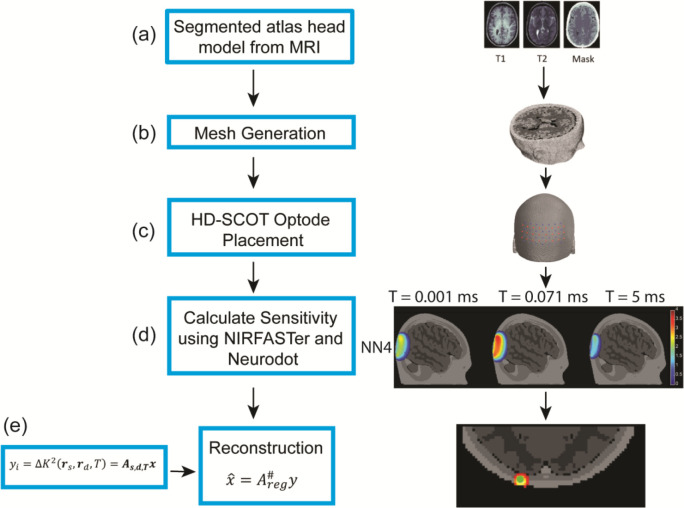
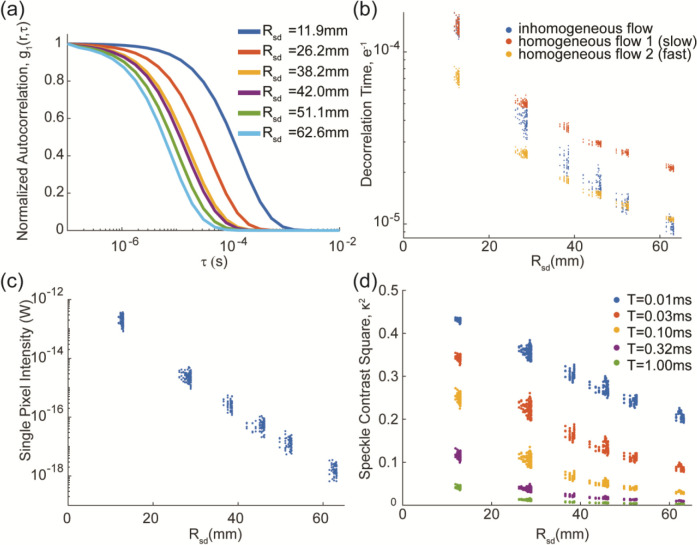
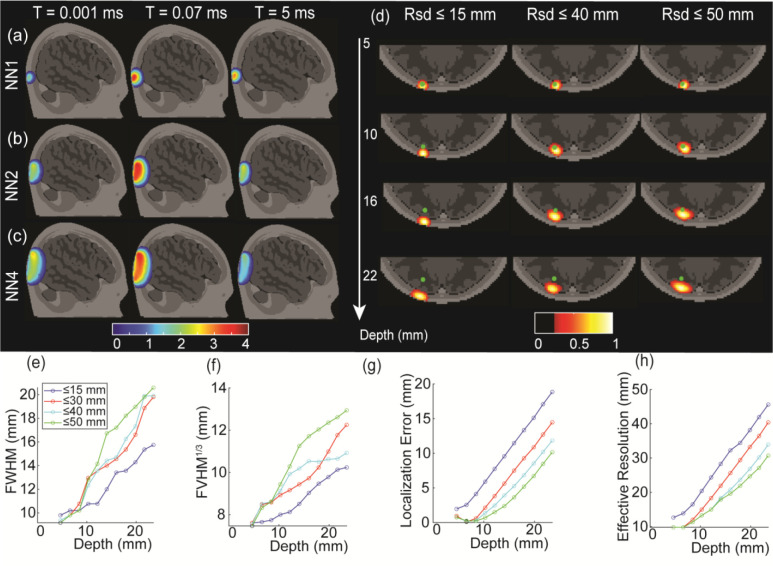
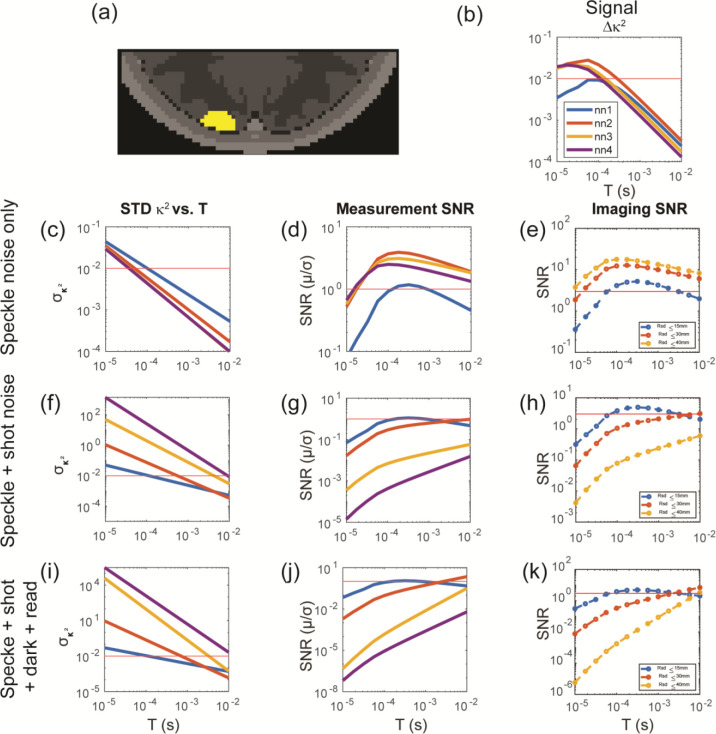
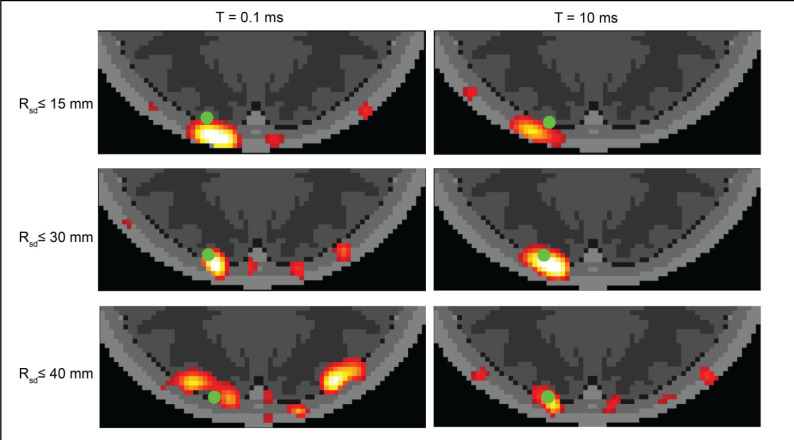
Traditional methods for mapping cerebral blood flow (CBF), such as positron emission tomography and magnetic resonance imaging, offer only isolated snapshots of CBF due to scanner logistics. Speckle contrast optical tomography (SCOT) is a promising optical technique for mapping CBF. However, while SCOT has been established in mice, the method has not yet been demonstrated in humans - partly due to a lack of anatomical reconstruction methods and uncertainty over the optimal design parameters. Herein we develop SCOT reconstruction methods that leverage MRI-based anatomical head models and finite-element modeling of the SCOT forward problem (NIRFASTer). We then simulate SCOT for CBF perturbations to evaluate sensitivity of imaging performance to exposure time and SD-distances. We find image resolution comparable to intensity-based diffuse optical tomography at superficial cortical tissue depth (~1.5 cm). Localization errors can be reduced by including longer SD-measurements. With longer exposure times speckle contrast decreases, however, noise decreases faster, resulting in a net increase in SNR. Specifically, extending exposure time from 10μs to 10ms increased SCOT SNR by 1000X. Overall, our modeling methods provide anatomically-based image reconstructions that can be used to evaluate a broad range of tissue conditions, measurement parameters, and noise sources and inform SCOT system design.

Keywords: Brain imaging; cerebral blood flow; cortical mapping; laser speckle contrast tomography; mathematical modeling.


Conflict of interest statement

8.Declaration of conflicting interests The Author(s) declare(s) that there is no conflict of interest

Figures

Figure 1:
Figure 1:
Image reconstruction and simulation methods for SCOT using an anatomical head model. Five tissue types (skin, skull, cerebral spinal fluid, gray matter, and white matter) were segmented from the MNI 152 MRI atlas (a) and used to generate a mesh (b). We positioned 24 source and 28 detector optodes on the head (c) to simulate a high-density (HD) SCOT array. Time-dependent sensitivity matrices for SCOT (d) were simulated using two Matlab packages, NIRFASTer and NeuroDOT. The pipeline is similar to our methods for conventional HD-DOT, with the addition of an exposure time parameter for SCOT imaging. We reconstructed simulated head images (e) using the Moore-Penrose pseudoinverse with spatially varying regularization.
Figure 2:
Figure 2:
Elements of a simulated SCOT data set using an anatomical head model. Our SCOT sensitivity matrix is built from normalized autocorrelation curves g1(r,τ), (a), with representative curves shown for each nearest-neighbor distance). Decorrelation times (b) were extracted from the autocorrelation curves for all 672 SCOT measurements, and for three flow conditions (two homogeneous, one inhomogeneous). For the inhomogeneous flow condition, simulation data included effective continuous-wave intensity (light falloff curve), (c), scaled to model sCMOS acquisition, and speckle contrast squared, κ2, versus source-detector distance Rsd(d), shown for several exposure times.
Figure 3:
Figure 3:
Time-dependent SCOT sensitivity matrices and the reconstruction under various conditions. Short source-detector distance measurements (13 mm, NN1, (a)) show high sensitivity to superficial tissues, while longer source-detector measurements (29 mm, NN2, (b), and 46 mm, NN4, (c)) show higher sensitivity to deeper, cortical tissue. In contrast to HD-DOT, SCOT measurements are highly sensitive to system exposure time, peaking at intermediate times. Intensity is shown on a log scale, with 4 orders of magnitude and scaled to the maximum intensity for each nearest neighbor distance (each row). Reconstructed SCOT point-spread function (PSF, (d)) with varying maximum source-detector distance (Rsd15, 40, 50 mm) showed the importance of including longer source-detector distances. PSF images were analyzed to assess depth-dependent performance in spatial resolution in full-width half maximum (e), cube root of full-volume half maximum (f), localization error of the reconstructed blood flow (g), and effective resolution (f), again with data sets of varying maximum source-detector distance
Figure 4:
Figure 4:
Evaluation of SCOT performance versus noise and exposure time, for data sets with varying maximum source-detector distance Rsd15,30,40mm. SCOT measurements and images were simulated for a volumetric CBF perturbation (40% increase in flow) (a), resulting in differential SCOT measurements Δκ2 (b). Three increasingly inclusive SCOT noise models (speckle noise only (c,d,e), speckle + shot noise (f,g,h), and speckle + shot + dark + read noise (i,j,k)) were incorporated, allowing calculation of SNR in both measurements and reconstructed images. Noise models characterized baseline variance in κ2 as a function of exposure time T (c,f,i). Measurement SNR (d,g,j) and imaging SNR (e,h,k) generally increased with T and decreased with Rsd. For the more inclusive noise models, SNR plateaued around T=5ms and was maximized with Rsd30mm. Imaging SNR values assume a 2x increase in κ2 window area (relative to noise model assumptions) and a 1 Hz frame rate. The red lines in (b,c,f,j) were plotted at y=102, the red lines in (d,g,j) showed the measurement SNR at 1, and the red lines at (e,h,k) represented the target imaging SNR of 3.
Figure 5:
Figure 5:
Simulated SCOT images vs. exposure time and source detector distance. Images were reconstructed from data sets with varying maximum source-detector distance Rsd15,30,40mm) and with two exposure times (T=0.1,10ms) to demonstrate the variance of imaging SNR over a range of possible settings in a SCOT instrument. Images were simulated for the volumetric CBF perturbation (green dot) as in Fig. 4a.

References

    1. Stephens JA, Liu P, Lu H, et al. Cerebral Blood Flow after Mild Traumatic Brain Injury: Associations between Symptoms and Post-Injury Perfusion. J Neurotrauma 2018; 35: 241–248. - PMC - PubMed
    1. Thamm T, Guo J, Rosenberg J, et al. Contralateral Hemispheric Cerebral Blood Flow Measured With Arterial Spin Labeling Can Predict Outcome in Acute Stroke. Stroke 2019; 50: 3408–3415. - PMC - PubMed
    1. Guo J, Gong E, Fan AP, et al. Predicting 15O-Water PET cerebral blood flow maps from multi-contrast MRI using a deep convolutional neural network with evaluation of training cohort bias. J Cereb Blood Flow Metab 2020; 40: 2240–2253. - PMC - PubMed
    1. Fan AP, Jahanian H, Holdsworth SJ, et al. Comparison of cerebral blood flow measurement with [15O]-water positron emission tomography and arterial spin labeling magnetic resonance imaging: A systematic review. J Cereb Blood Flow Metab Off J Int Soc Cereb Blood Flow Metab 2016; 36: 842–861. - PMC - PubMed
    1. Durduran T, Choe R, Baker WB, et al. Diffuse optics for tissue monitoring and tomography. Rep Prog Phys 2010; 73: 076701. - PMC - PubMed

Publication types