[Preprint]. 2023 Sep 10:2023.09.08.23295131.
doi: 10.1101/2023.09.08.23295131.

Deep Learning Model for Tumor Type Prediction using Targeted Clinical Genomic Sequencing Data

Affiliations

Deep Learning Model for Tumor Type Prediction using Targeted Clinical Genomic Sequencing Data

Madison Darmofal et al. medRxiv. .

Update in

Abstract

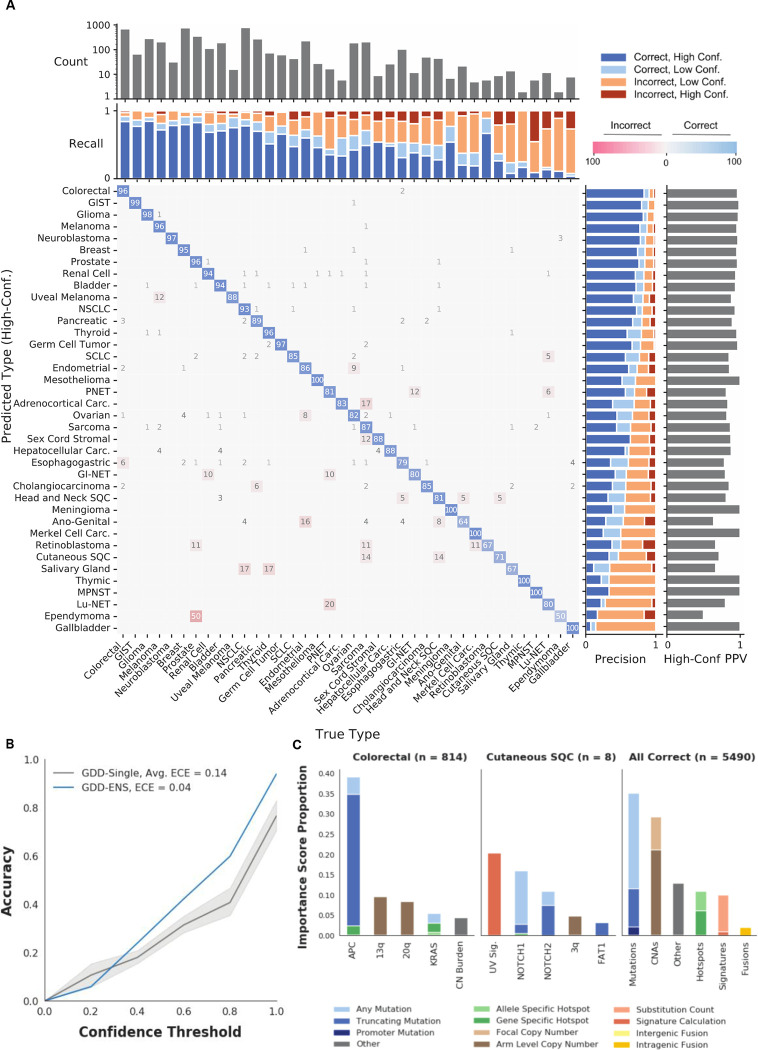
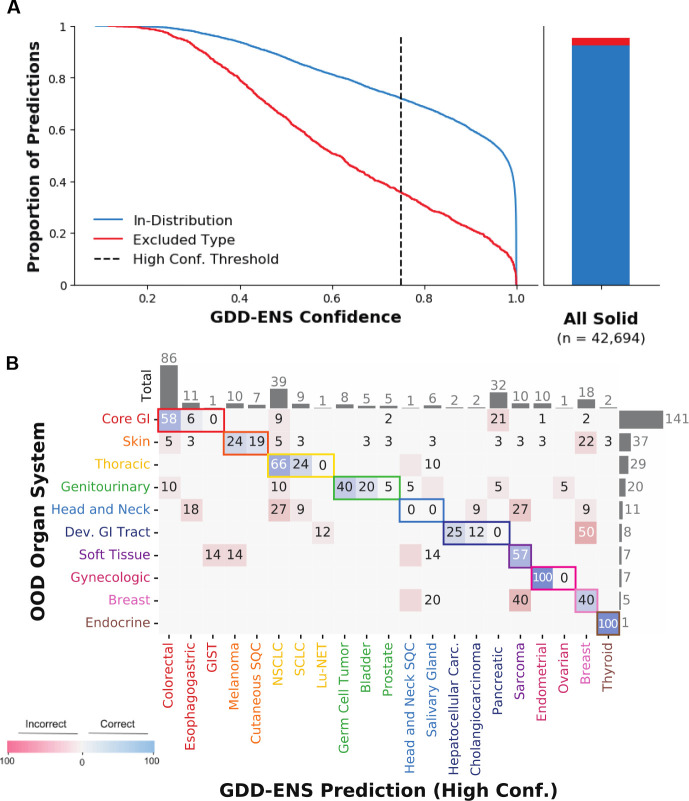
Tumor type guides clinical treatment decisions in cancer, but histology-based diagnosis remains challenging. Genomic alterations are highly diagnostic of tumor type, and tumor type classifiers trained on genomic features have been explored, but the most accurate methods are not clinically feasible, relying on features derived from whole genome sequencing (WGS), or predicting across limited cancer types. We use genomic features from a dataset of 39,787 solid tumors sequenced using a clinical targeted cancer gene panel to develop Genome-Derived-Diagnosis Ensemble (GDD-ENS): a hyperparameter ensemble for classifying tumor type using deep neural networks. GDD-ENS achieves 93% accuracy for high-confidence predictions across 38 cancer types, rivalling performance of WGS-based methods. GDD-ENS can also guide diagnoses on rare type and cancers of unknown primary, and incorporate patient-specific clinical information for improved predictions. Overall, integrating GDD-ENS into prospective clinical sequencing workflows has enabled clinically-relevant tumor type predictions to guide treatment decisions in real time.


Conflict of interest statement

Conflict of interest: M.B. reported receiving personal fees from Eli Lilly, AstraZeneca and Paige.AI all unrelated to this study. All other authors declared that they have no competing interests.

Figures

Fig. 1.
Fig. 1.. Overview of GDD-ENS model.
(A) Cohort diagram, detailing samples used to form a training and testing cohort. Hematological refers to blood-based cancers (i.e. Leukemias) sequenced using MSK-IMPACT before development of a separate non-solid tumor assay. (B) Training set distribution of cancer types included after expanding GDD-RF to GDD-ENS, colored by model inclusion. Any type with less than 350 examples is upsampled via replacement during training. NSCLC, Non-Small Cell Lung Cancer; GIST, Gastrointestinal Stromal Tumor; SQC, Squamous Cell Carcinoma; SCLC, Small Cell Lung Cancer; PNET, Pancreatic Neuroendocrine Tumor; Lu-NET, Lung Neuroendocrine Tumor; GI-NET, Gastro-intestinal Neuroendocrine Tumor; Carc., Carcinoma; MPNST, Malignant Peripheral Nerve Sheath Tumor. (C) Distribution of informative feature types. “Other” refers to clinical features or numerical features representing overall mutational burden across categories. Allele specific hotspot features annotate hotspot mutation (i.e. KRAS G12C) whereas gene specific hotspot features only specify the gene altered (KRAS Hotspot). CNAs, Copy Number Alterations. (D) GDD-ENS workflow from patient to output. All non-clinical features are derived from the MSK-IMPACT sequencing assay, then fed into GDD-ENS. GDD-ENS reports top three tumor type predictions with confidence estimates, along with ten most important features for the top prediction on a patient-specific basis. Workflow overview created with BioRender (https://www.biorender.com/).
Fig. 2.
Fig. 2.. GDD-ENS Performance across cancer types.
(A) Row-normalized confusion matrix of high-confidence predictions across cancer types. Off diagonal values correspond to proportion of the row, predicted cancer type that is column, true type. The true prostate cancer, predicted ependymoma off diagonal value indicates a single prostate cancer sample that was predicted as ependymoma, likely due to low tumor burden as it just passed the inclusion thresholds for purity. Due to rounding, some rows may sum to more than 100. Upper bar graphs indicate test set count (top) and type-specific recall across confidence levels. Left bargraphs represent high-confidence Positive Predictive Value (High Conf. PPV, right) and type-specific precision. Sorted by overall type precision on both axes. (B) Calibration plot for GDD-Single models and GDD-ENS ensemble. X-axis represents maximum confidence after binning outputs into five equally sized ranges, Y-axis represents overall accuracy of all predictions within that range. Blue line represents the GDD-ENS model, dark gray line and shaded regions represent mean GDD-Single accuracy and 95% confidence interval, respectively. Expected Calibration Error (ECE) calculated as per Methods. (C) Shapley value score distributions for correct GDD-ENS predictions across individual types (left, middle) and all predictions (right). Importance Score Proportion represents proportion of total Shapley Value scores after summing the absolute Shapley value per feature across the specified subset, normalized as per Methods.
Fig. 3.
Fig. 3.. GDD-ENS performance on excluded cancer samples.
(A) Empirical cumulative distribution function comparing probability of In-Distribution test set and excluded samples (left). 72% of the In-Distribution test set are high confidence, compared to only 36% of excluded samples. Relative fraction of excluded samples among the entire discovery cohort indicates the vast majority of high-purity, solid tumors are In-Distribution (right). HP, High Purity; Conf., Confidence. (B) Row-normalized confusion matrix of the organ system of the true type for excluded samples vs the high confidence GDD-ENS prediction organ system. Colors represent broad organ systems annotated, many predictions are conserved within correct organ systems. Rows and columns ordered by total number of excluded type samples within each organ system (right), and number of conserved predictions for each cancer type (top). GDD-ENS predictions correspond to types from the same organ system for 162/266 excluded samples with specific organ system annotations (61%). Dev., Developmental;
Fig. 4.
Fig. 4.. Adaptable prior distribution enables incorporation of non-genomic information for enhanced predictions.
(A) Proportion of all in-distribution discovery cohort samples that are either primary or metastatic (top), or have broad histological annotations (middle, top) per cancer type. Underlying distributions of metastatic site (middle) and histology (bottom) for all in-distribution discovery cohort samples across 19 metastatic sites and 2 histological subtypes. Heatmaps are row normalized, but only show 10 types (full heatmap in Fig. S6). Met., Metastatic; Prim., Primary; Adeno., Adenocarcinoma; SQC, Squamous Cell Carcinoma;. (B) Overview of adaptable prior methodology. (C) Flow of results for combination prior using both metastatic site and histology for all test set examples. Arrow base represents pre-adjustment category, arrow head represents post-adjustment. Circle arrows indicates the number of samples that did not change categories after adjustment, i.e. 4618 samples that were correct and high confidence before and after applying the prior. (D) Walkthrough of patient with head and neck squamous cell cancer predicted bladder by GDD-ENS with .85 confidence. After applying priors specific to the site of metastasis and annotated histology, the sample was correctly predicted with high-confidence (.96). Overview and flow diagram created with BioRender (https://biorender.com/).
Fig. 5.
Fig. 5.. GDD-ENS predictions on CUP patients can identify targetable alterations.
(A) Distribution of GDD-ENS predictions for all 1,441 CUP patients. (B) Barplot indicating total number of patients with targetable alterations after GDD-ENS predictions (bottom axis). Only 550 CUP patients had potentially actionable alterations at level 3B or higher in CUP patients before GDD-ENS predictions, top axis indicates overall proportion of these patients with identified alterations. (C) Most frequently identified targetable alteration for only high confidence GDD-ENS predictions. Targetable alteration representing a specific allele change or structural variant are annotated as such, otherwise counts represent combination of broad oncogenic mutations across multiple alteration types and allele changes.

References

    1. Pavlidis N., Briasoulis E., Hainsworth J., and Greco F.A. (2003). Diagnostic and therapeutic management of cancer of an unknown primary. European Journal of Cancer 39, 1990–2005. 10.1016/S0959-8049(03)00547-1. - DOI - PubMed
    1. Varghese A.M., Arora A., Capanu M., Camacho N., Won H.H., Zehir A., et al. (2017). Clinical and molecular characterization of patients with cancer of unknown primary in the modern era. Annals of Oncology 28, 3015–3021. 10.1093/annonc/mdx545. - DOI - PMC - PubMed
    1. Kato S., Alsafar A., Walavalkar V., Hainsworth J., and Kurzrock R. (2021). Cancer of Unknown Primary in the Molecular Era. Trends Cancer 7, 465–477. 10.1016/j.trecan.2020.11.002. - DOI - PMC - PubMed
    1. Greco F.A. (2013). Molecular diagnosis of the tissue of origin in cancer of unknown primary site: useful in patient management. Curr Treat Options Oncol 14, 634–642. 10.1007/s11864-013-0257-1. - DOI - PubMed
    1. Zehir A., Benayed R., Shah R.H., Syed A., Middha S., Kim H.R., et al. (2017). Mutational landscape of metastatic cancer revealed from prospective clinical sequencing of 10,000 patients. Nat Med 23, 703–713. 10.1038/nm.4333. - DOI - PMC - PubMed

Publication types