[Preprint]. 2023 Sep 8:2023.09.04.23295019.
doi: 10.1101/2023.09.04.23295019.

ParSE-seq: A Calibrated Multiplexed Assay to Facilitate the Clinical Classification of Putative Splice-altering Variants

Affiliations

ParSE-seq: A Calibrated Multiplexed Assay to Facilitate the Clinical Classification of Putative Splice-altering Variants

Matthew J O'Neill et al. medRxiv. .

Update in

Abstract

Background: Interpreting the clinical significance of putative splice-altering variants outside 2-base pair canonical splice sites remains difficult without functional studies.

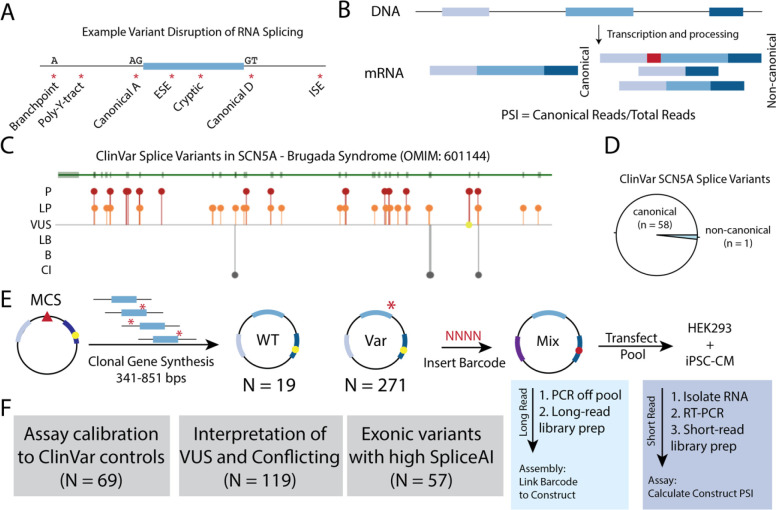
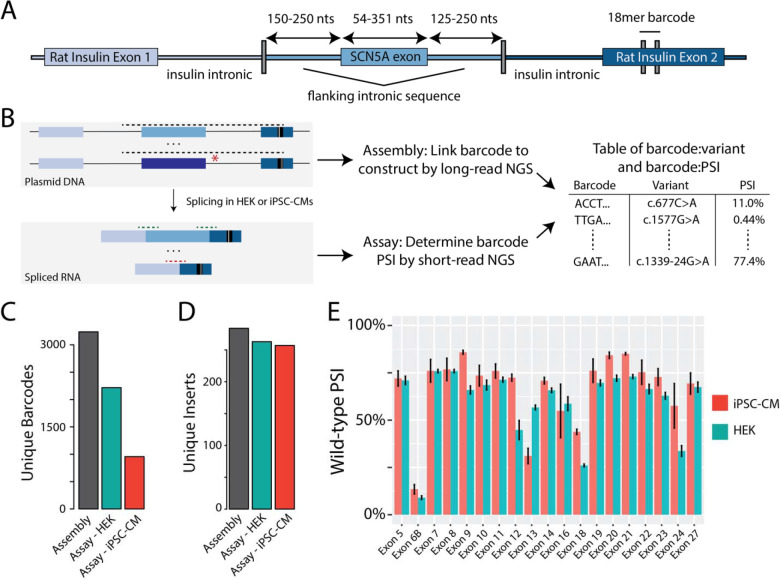
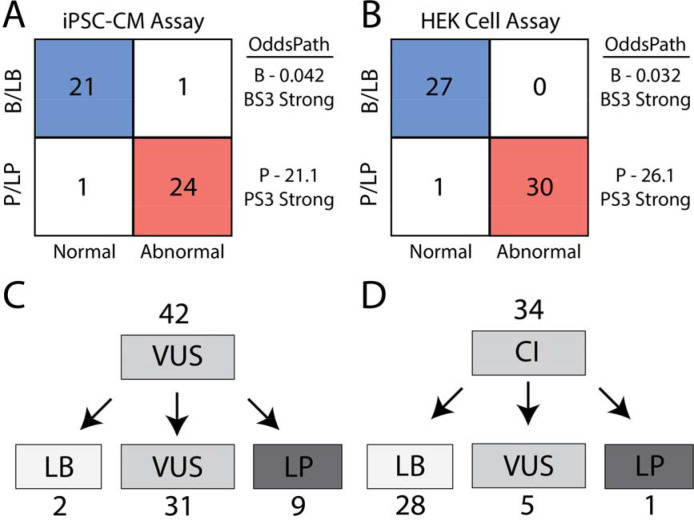
Methods: We developed Parallel Splice Effect Sequencing (ParSE-seq), a multiplexed minigene-based assay, to test variant effects on RNA splicing quantified by high-throughput sequencing. We studied variants in SCN5A, an arrhythmia-associated gene which encodes the major cardiac voltage-gated sodium channel. We used the computational tool SpliceAI to prioritize exonic and intronic candidate splice variants, and ClinVar to select benign and pathogenic control variants. We generated a pool of 284 barcoded minigene plasmids, transfected them into Human Embryonic Kidney (HEK293) cells and induced pluripotent stem cell-derived cardiomyocytes (iPSC-CMs), sequenced the resulting pools of splicing products, and calibrated the assay to the American College of Medical Genetics and Genomics scheme. Variants were interpreted using the calibrated functional data, and experimental data were compared to SpliceAI predictions. We further studied some splice-altering missense variants by cDNA-based automated patch clamping (APC) in HEK cells and assessed splicing and sodium channel function in CRISPR-edited iPSC-CMs.

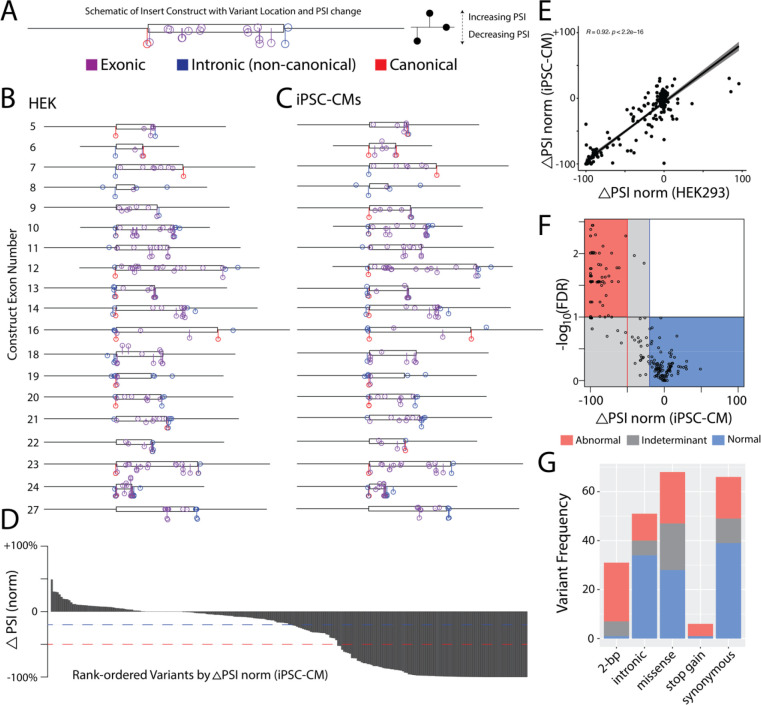
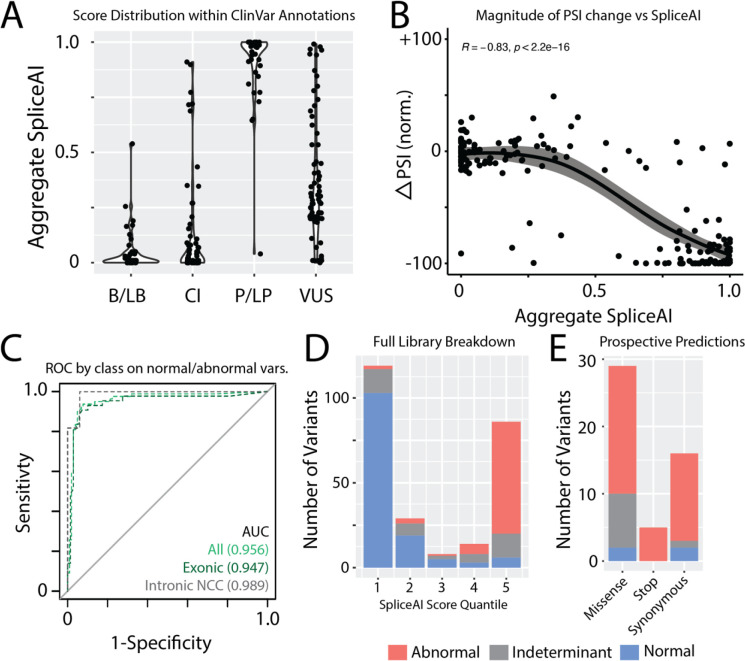
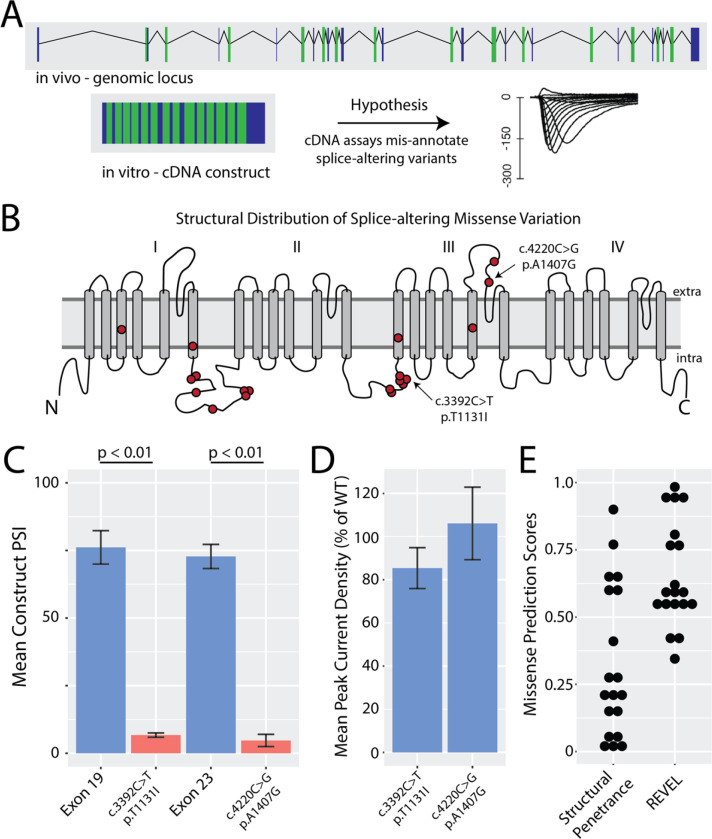
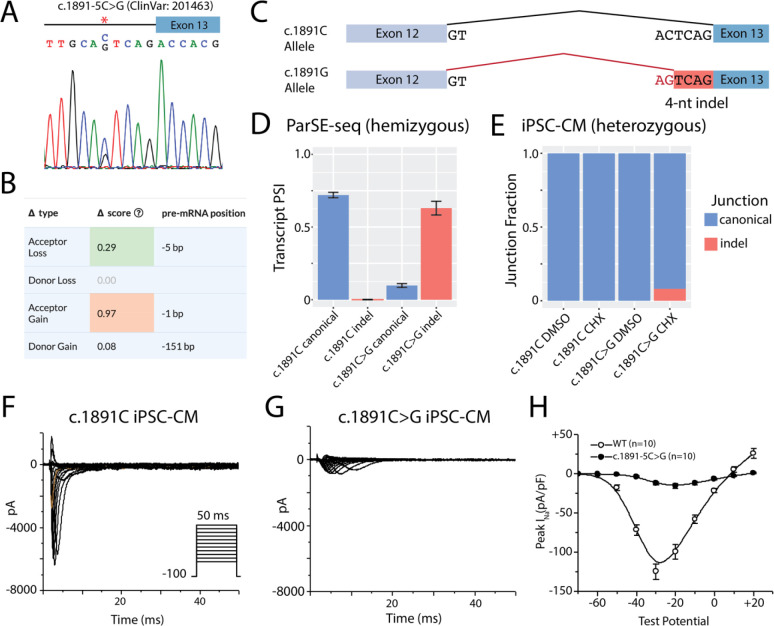
Results: ParSE-seq revealed the splicing effect of 224 SCN5A variants in iPSC-CMs and 244 variants in HEK293 cells. The scores between the cell types were highly correlated (R2=0.84). In iPSCs, the assay had concordant scores for 21/22 benign/likely benign and 24/25 pathogenic/likely pathogenic control variants from ClinVar. 43/112 exonic variants and 35/70 intronic variants with determinate scores disrupted splicing. 11 of 42 variants of uncertain significance were reclassified, and 29 of 34 variants with conflicting interpretations were reclassified using the functional data. SpliceAI computational predictions correlated well with experimental data (AUC = 0.96). We identified 20 unique SCN5A missense variants that disrupted splicing, and 2 clinically observed splice-altering missense variants of uncertain significance had normal function when tested with the cDNA-based APC assay. A splice-altering intronic variant detected by ParSE-seq, c.1891-5C>G, also disrupted splicing and sodium current when introduced into iPSC-CMs at the endogenous locus by CRISPR editing.

Conclusions: ParSE-seq is a calibrated, multiplexed, high-throughput assay to facilitate the classification of candidate splice-altering variants.

Keywords: Brugada syndrome; RNA; SCN5A; Splicing; arrhythmias; clinical genetics; iPSC-CM; non-coding; variant classification.


Conflict of interest statement

Declaration of Interests The authors declare no competing interests.

Figures

Figure 1.
Figure 1.. Splice-altering Variants and Assay Schematic.
A) Splicing regulatory sequences disrupted or introduced by cis-genetic variants. A – acceptor site. D – donor site. ESE – exonic splicing enhancer. ISE – intronic splicing enhancer. Y – pyrimidine. B) Quantification of Percent Spliced In (PSI) from transcripts associated with WT- or variant-containing transcripts. Canonical reads are divided by the total amount of reads for a given exon triplet cassette. C) ClinVar view of splice-altering variants for the gene SCN5A. Most known splice variants are P/LP. D) Most SCN5A splice variants in ClinVar are associated with canonical splice sites, with only 1 ClinVar example of a non-canonical splice variant. E) Schematic of ParSE-seq assay. A clonal gene library is cloned into a minigene vector (modified pET01), pooled, and barcoded. Barcode are assigned to the WT or variant inserts by long-read sequencing through assembly, and the splicing outcomes are determined with short-read sequencing after transfection into cells. Yellow circle represents restriction site for barcode in downstream exon. F) The SCN5A variant library was designed to evaluate three categories of variants: assay calibration, classification of clinically relevant variants, and testing of exonic variants with high SpliceAI scores. VUS – Variant of Uncertain Significance. CI – Conflicting Interpretation.
Figure 2.
Figure 2.. ParSE-seq assay in HEK cells and iPSC-CMs.
A) Detailed schematic of the minigene plasmid. An 18-mer barcode inserts into downstream rat insulin exon 2. B) Overview schematic of assembly and assay steps, and subsequent integration. Dashed lines represent amplicons for long- and short-read sequencing. C) Barcode counts for the assembly, and recovered barcodes present across three replicates in HEK and iPSC-CM assays. D) Unique WT or variant inserts covered by barcodes in panel C. E) PSI for all WT exons in iPSC-CMs and HEK cells. Data is averaged across three replicates and error bars represent the standard error of the mean.
Figure 3.
Figure 3.. ParSE-seq results for a library of SCN5A variants.
A) Example of variants superimposed along construct design – iPSC-CM construct 23 is shown. Y-axis corresponds to change in ΔPSI_norm, and X-axis position along the exonic (box) and intronic (line) segments of the synthetic insert. B) Distribution of ParSE-seq investigated variants in HEK cells. Change in y-axis corresponds to changes in ΔPSI_norm. C) Distribution of ParSE-seq investigated variants in iPSC-CMs. Change in y-axis corresponds to changes in ΔPSI_norm. D) Waterfall plot of ΔPSI_norm by variant. Red dashed line corresponds to −50% normalized ΔPSI, and blue to −20% normalized ΔPSI. E) Correlation of normalized ΔPSI between HEK and iPSC-CMs (n=207). F) Volcano plot of normalized ΔPSI and −log10(FDR). Each dot represents a variant studied in iPSC-CMs. G) Barplot of ParSE-seq variant outcomes by variant mutation type in iPSC-CMs.
Figure 4.
Figure 4.. Comparison of experimental data and in silico SpliceAI scores.
A) Aggregate SpliceAI scores for each ClinVar variant class. B) Correlation of normalized ΔPSI against aggregate SpliceAI scores. Confidence interval fit using Loess. C) Receiver operating characteristic curves for SpliceAI applied to normal and abnormal variants. Indeterminant variants are not included. AUC=area under the curve, NCC – non-canonical splice sites. D) Distribution of variant effect in ParSE-seq stratified by SpliceAI score quantiles. E) Results of prospectively identified exonic variants by SpliceAI score >0.8 stratified by mutation type and ParSE-seq outcome.
Figure 5.
Figure 5.. Assay calibration and evidence-based variant classification.
A) ParSE-seq results for B/LB and P/LP controls in iPSC-CMs. As described in the methods, we obtain 2 OddsPath values to implement BS3 and PS3, both at a strong level of evidence. B) ParSE-seq results for B/LB and P/LP controls in HEK cells. As described in the methods, we obtain 2 OddsPath values to implement BS3 and PS3, both at a strong level of evidence. C) VUS were reclassified using functional data from ParSE-seq at the strong level of evidence. BS3 evidence was applied exclusively to synonymous and intronic VUS. PS3 evidence is applied to all VUS. D) Classifications of Conflicting Interpretation variants using functional evidence. BS3/PS3 applied as for VUS in Panel C.
Figure 6.
Figure 6.. Investigation of missense variants with ParSE-seq and automated patch clamp studies.
A) Schematic of genomic locus vs cDNA-based plasmid used in many SCN5A functional assays. These assays do not account for splice-altering variant effects. B) Structural distribution of splice-altering missense variants in SCN5A revealed by ParSE-seq. C) ParSE-seq results for two splice-altering variants compared with their corresponding wildtype exons (n=3 per group; error bars correspond to standard error of the mean, p < 0.01 [2-sided t-test]). D) Plots of missense variant peak current densities normalized to WT. Variants were studied with the SyncroPatch 384 PE automated patch clamp system compared to WT. 19–41 cells studied per variant. Error bars correspond to standard error of the mean. E) Scores of in silico predictors from Bayesian structural penetrance strategy and REVEL. Bayes score >0.2 indicates higher risk of pathogenicity. REVEL scores >0.5 are considered pathogenic.
Figure 7.
Figure 7.. Intronic variant at the endogenous SCN5A locus disrupts SCN5A RNA splicing and protein-level sodium current.
A) The c.1891–5C>G variant was introduced as a heterozygous edit with CRISPR-Cas9 into a control iPSC line. Both control and edited lines underwent differentiation to iPSC-CMs. B) Variant level SpliceAI predictions of the c.1891C>G variant. New motif is predicted to abolish canonical splice site and introduce a novel splice site at the de novo AG motif. C) Schematic depiction of splicing outcomes for the WT allele and variant allele. The variant allele is predicted to use a cryptic splice site and retain 4 nucleotides of intronic sequence as a frame-shifting indel. D) Hemizygous ParSE-seq results of the PSI for the WT splicing product vs the specifically predicted 4-bp indel created by the competing AG motif in the WT and variant constructs. E) Fraction of canonical vs ParSE-seq predicted indel in WT lines and heterozygous edited lines. Blue indicates canonical splicing, whereas red indicated the 4-nucleotide pseudoexon. F) Sodium current traces of the healthy control line. Voltage protocol provided in inset. G) Sodium current traces of the heterozygous c.1891C>G line. Same voltage protocol as in F. F) Quantification of peak current at −30 mV of the isogenic lines. p < 0.01 (2-sided t-test).

References

    1. Green E. D. et al. Strategic vision for improving human health at The Forefront of Genomics. Nature 586, 683–692 (2020). 10.1038/s41586-020-2817-4 - DOI - PMC - PubMed
    1. Truty R. et al. Spectrum of splicing variants in disease genes and the ability of RNA analysis to reduce uncertainty in clinical interpretation. Am J Hum Genet 108, 696–708 (2021). 10.1016/j.ajhg.2021.03.006 - DOI - PMC - PubMed
    1. Sibley C. R., Blazquez L. & Ule J. Lessons from non-canonical splicing. Nat Rev Genet 17, 407–421 (2016). 10.1038/nrg.2016.46 - DOI - PMC - PubMed
    1. Vaz-Drago R., Custódio N. & Carmo-Fonseca M. Deep intronic mutations and human disease. Hum Genet 136, 1093–1111 (2017). 10.1007/s00439-017-1809-4 - DOI - PubMed
    1. Jaganathan K. et al. Predicting Splicing from Primary Sequence with Deep Learning. Cell 176, 535–548.e524 (2019). 10.1016/j.cell.2018.12.015 - DOI - PubMed

Publication types