[Preprint]. 2023 Sep 5:2023.09.03.556059.
doi: 10.1101/2023.09.03.556059.

Drugs of abuse hijack a mesolimbic pathway that processes homeostatic need

Affiliations

Drugs of abuse hijack a mesolimbic pathway that processes homeostatic need

Bowen Tan et al. bioRxiv. .

Update in

Abstract

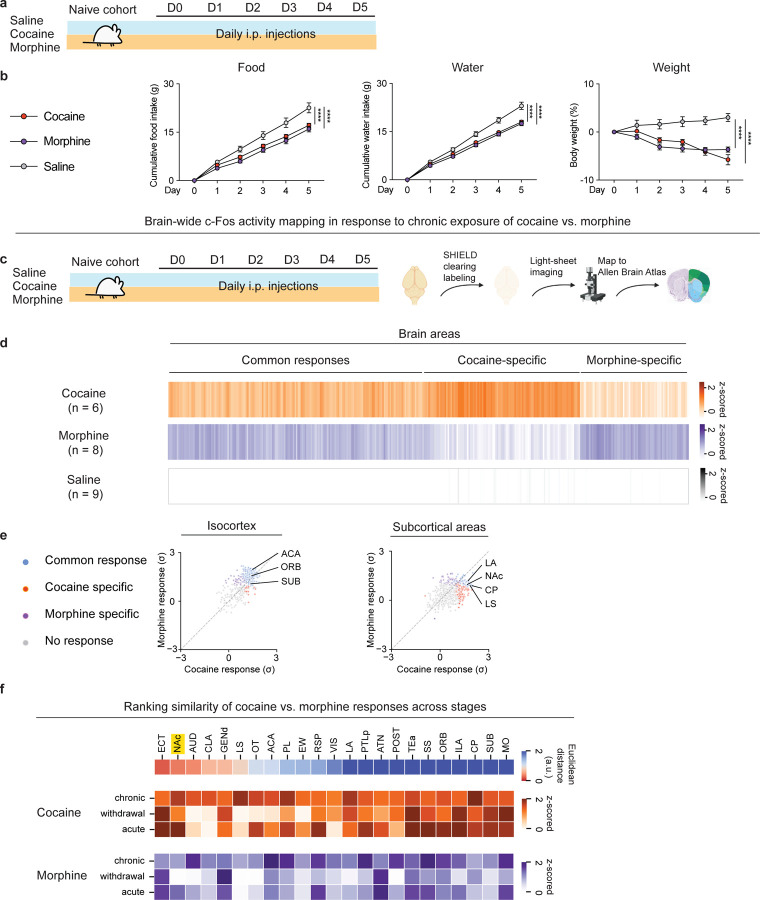
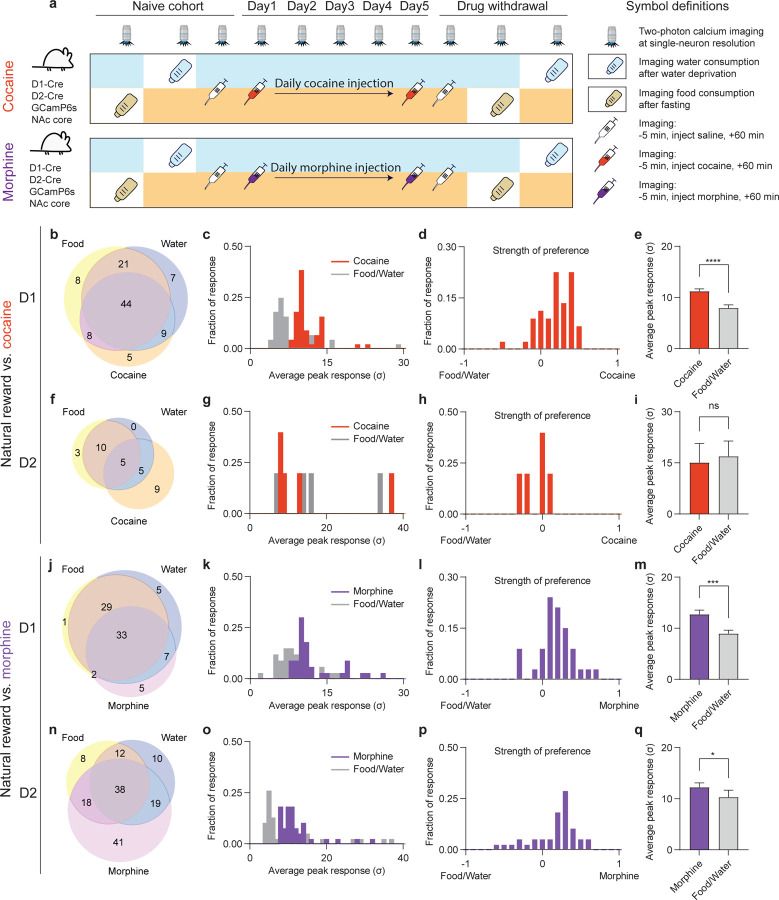
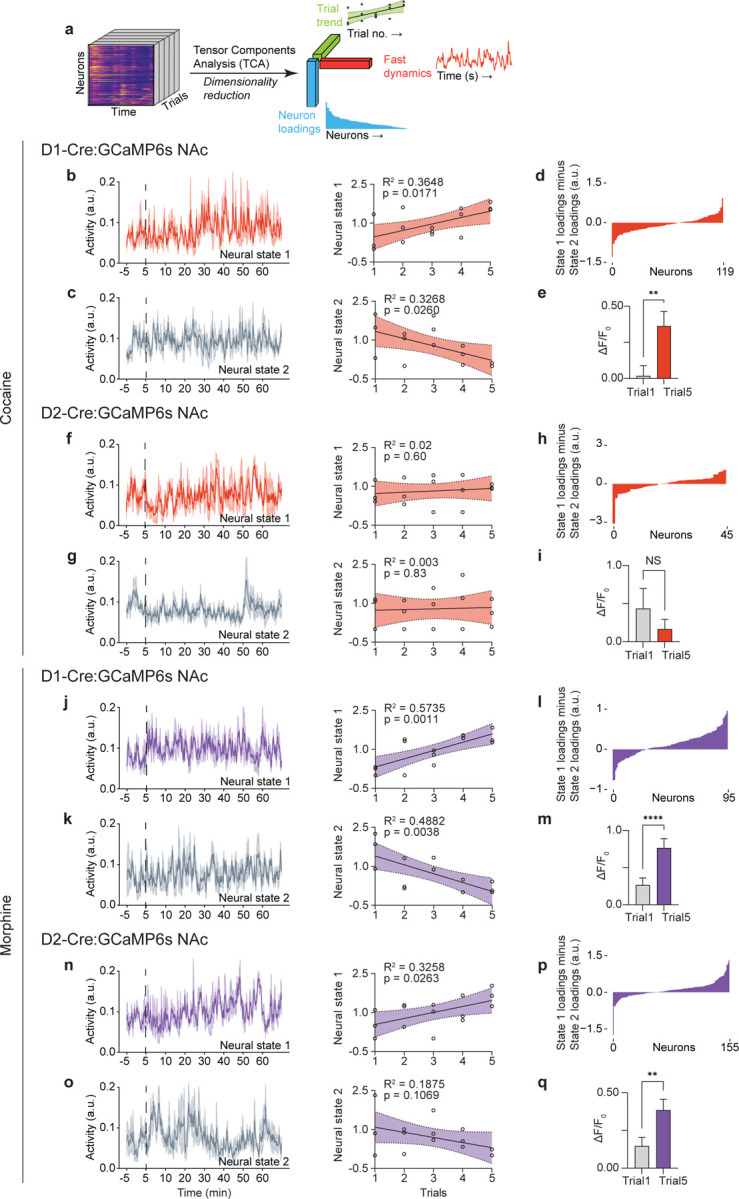
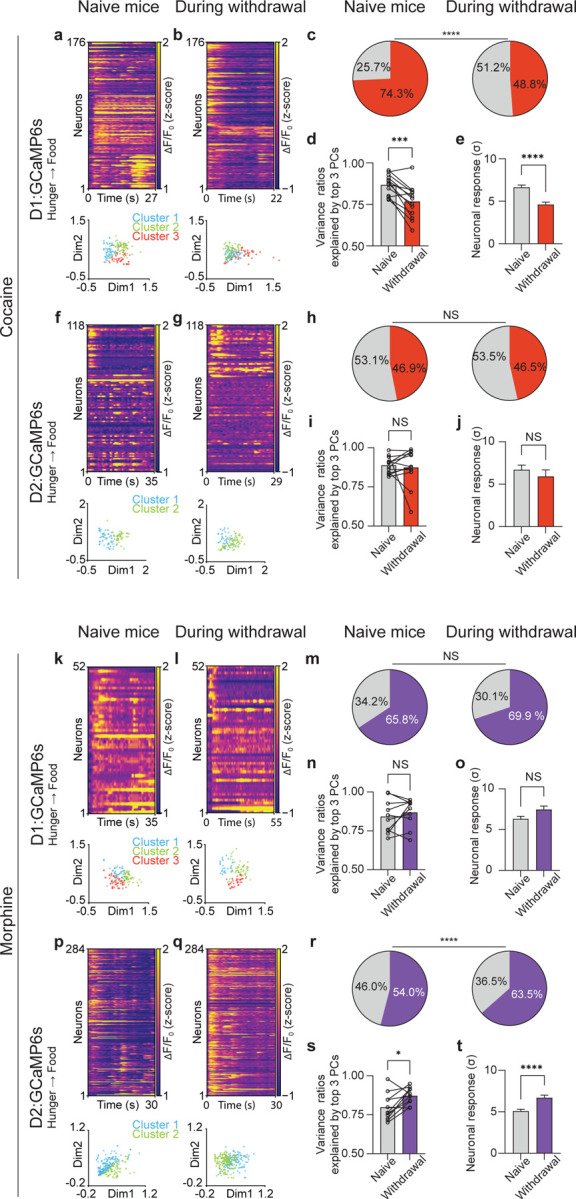
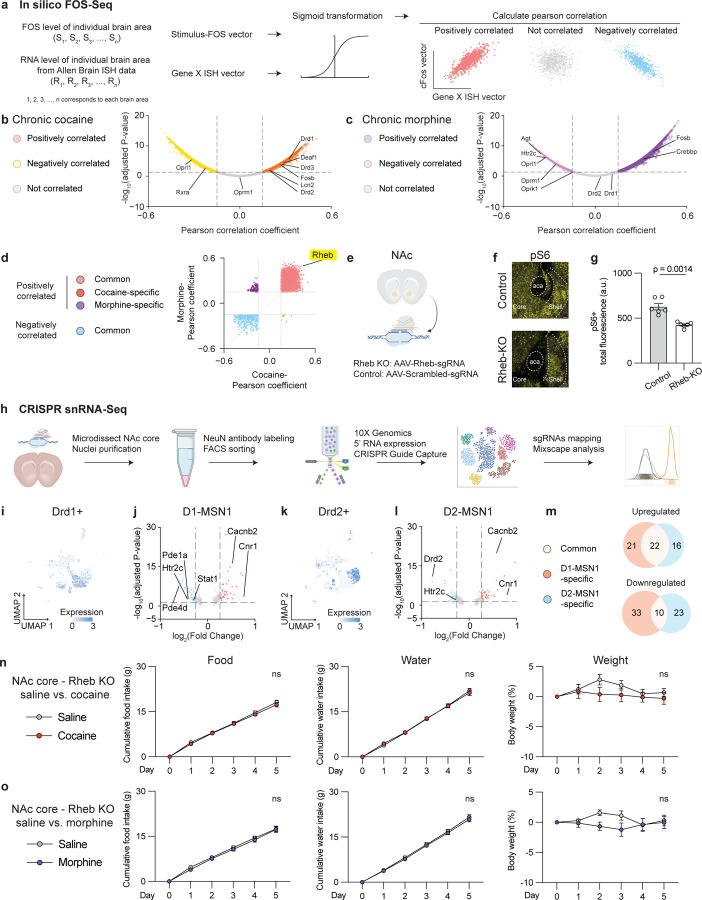
Addiction prioritizes drug use over innate needs by "hijacking" brain circuits that direct motivation, but how this develops remains unclear. Using whole-brain FOS mapping and in vivo single-neuron calcium imaging, we find that drugs of abuse augment ensemble activity in the nucleus accumbens (NAc) and disorganize overlapping ensemble responses to natural rewards in a cell-type-specific manner. Combining "FOS-Seq", CRISPR-perturbations, and snRNA-seq, we identify Rheb as a shared molecular substrate that regulates cell-type-specific signal transductions in NAc while enabling drugs to suppress natural reward responses. Retrograde circuit mapping pinpoints orbitofrontal cortex which, upon activation, mirrors drug effects on innate needs. These findings deconstruct the dynamic, molecular, and circuit basis of a common reward circuit, wherein drug value is scaled to promote drug-seeking over other, normative goals.


Figures

Figure. 1.
Figure. 1.. Whole-brain FOS mapping identifies shared regulation of NAc by chronic exposure to cocaine vs. morphine.
(a), Schematic of the experimental design for repeated exposure of drug rewards vs. saline. Three cohorts of mice received 20 mg/kg cocaine, 10 mg/kg morphine, saline, respectively via i.p. injections for 5 days. All cohorts had adlibitum access to food and water. Comparisons of (b), Cumulative food intake (g), Cumulative water intake (g), Weight (%) over the 5-day treatment (n = 10, 10, 10 for saline, cocaine, morphine group, respectively, two-way ANOVA with Dunnett’s multiple comparisons). (c), Schematic of the experiment design for chronic exposure of drug rewards vs. saline followed by whole-brain clearing and mapping to Allen Brain Atlas. Three cohorts of mice received saline, 20 mg/kg cocaine, 10 mg/kg morphine, respectively (n = 9, 6, 8 for each group) via i.p. injections for 5 days. (d), Heatmap overview of brain areas showing significant FOS activity across three groups (One-way ANOVA for each brain area with cut-off p < 0.05 classified as statistically significant, followed by K-means clustering). (e), Scatter plot of FOS activity of cortical areas in response to cocaine vs. morphine (left). Scatter plot of FOS activity of subcortical areas in response to cocaine vs. morphine (right). Common response: areas showed significant changes (P < 0.05) of FOS+ counts in cocaine and morphine groups compared to the saline group; Cocaine or Morphine specific: areas only showed significant changes of FOS+ counts in either the cocaine or morphine group compared to the saline group. (f), Similarity of FOS responses across different phases of exposure to cocaine vs. morphine (top). Heatmap representations of brain areas after acute and chronic exposure to cocaine or morphine and after spontaneous withdrawal (bottom). All error bars represent mean ± s.e.m. NS, not significant, *P < 0.05, **P < 0.01, ***P < 0.001, ****P < 0.0001.
Figure. 2.
Figure. 2.. NAc D1 and D2 neurons exhibit common physiological activity across natural and drug rewards.
(a), Schematic of the experimental design for comparing neuronal responses to natural vs. drug rewards. (b), Venn diagram of activated D1 neurons among food, water, cocaine. N = 111 neurons pooled from 3 mice across all sessions recorded. (c), Histogram distribution of averaged peak responses of the D1 neurons activated by food, water and cocaine. (d), Histogram distribution of preferential activation strength of D1 neurons between food/water vs. cocaine. (e), Comparison of the peaked responses of the above activated neurons (n = 44 neurons, two-tailed Wilcoxon test). (f), Venn diagram of activated D2 neurons among food, water, cocaine. n = 46 neurons pooled from 3 mice across all sessions recorded. (g), Histogram distribution of averaged peak responses of the D2 neurons activated by food, water and cocaine. (h), Histogram distribution of preferential activation strength of D2 neurons between food/water vs. cocaine. (i), Comparison of the peaked responses of the above activated neurons (n = 5 neurons, two-tailed Wilcoxon test). (j), Venn diagram of activated D1 neurons among food, water, morphine. n = 85 neurons pooled from 3 mice across all sessions recorded. (k), Histogram distribution of averaged peak responses of the D1 neurons activated by food, water and morphine. (l), Histogram distribution of preferential activation strength of D1 neurons between food/water vs. morphine. (m), Comparison of the peaked responses of the above activated neurons (n = 33 neurons, two-tailed Wilcoxon test). (n), Venn diagram of activated D2 neurons among food, water, morphine. n = 170 neurons pooled from 3 mice across all sessions recorded. (o), Histogram distribution of averaged peak responses of the D2 neurons activated by food, water and morphine. (p), Histogram distribution of preferential activation strength of D2 neurons between food/water vs. morphine. (q), Comparison of the peaked responses of the above activated neurons (n = 38 neurons, two-tailed Wilcoxon test). All error bars represent mean ± s.e.m. NS, not significant, *P < 0.05, **P < 0.01, ***P < 0.001, ****P < 0.0001.
Figure. 3.
Figure. 3.. Repeated cocaine or morphine exposure induces and amplifies NAc D1 and D2 neural activity.
(a), Schematic of tensor component analysis (TCA). (b), Neural state 1 of D1 neurons in response to cocaine and linear regression of the representation of neural state 1 across all sessions. (c), Neural state 2 of D1 neurons in response to cocaine and linear regression of the representation of neural state 2 across all sessions. (d), Loading factors of neurons contributing to state 1 relative to state 2 (n = 119 neurons merged from 3 mice across all 15 sessions). (e), Comparison of D1 neurons positively contributing to neural state 1 between session 1 (day 1) and session 5 (day 5) in response to cocaine (n = 46 neurons, two-tailed Wilcoxon test). (f), Neural state 1 of D2 neurons in response to cocaine and linear regression of the representation of neural state 1 across all sessions. (g), Neural state 2 of D2 neurons in response to cocaine and linear regression of the representation of neural state 2 across all sessions. (h), Loading factors of neurons contributing to state 1 relative to state 2 (n = 45 neurons merged from 3 mice across all 15 sessions). (i), Comparison of D2 neurons positively contributing to neural state 1 between session 1 (day 1) and session 5 (day 5) in response to cocaine (n = 26 neurons, two-tailed Wilcoxon test). (j), Neural state 1 of D1 neurons in response to morphine and linear regression of the representation of neural state 1 across all sessions. (k), Neural state 2 of D1 neurons in response to morphine and linear regression of the representation of neural state 2 across all sessions. (l), Loading factors of neurons contributing to state 1 relative to state 2 (n = 95 neurons merged from 3 mice across all 15 sessions). (m), Comparison of D1 neurons positively contributing to neural state 1 between session 1 (day 1) and session 5 (day 5) in response to cocaine (n = 68 neurons, two-tailed Wilcoxon test). (n), Neural state 1 of D2 neurons in response to morphine and linear regression of the representation of neural state 1 across all sessions. (o), Neural state 2 of D2 neurons in response to morphine and linear regression of the representation of neural state 2 across all sessions. (p), Loading factors of neurons contributing to state 1 relative to state 2 (n = 155 neurons merged from 3 mice across all 15 sessions). (q), Comparison of D2 neurons positively contributing to neural state 1 between session 1 (day 1) and session 5 (day 5) in response to cocaine (n = 97 neurons, two-tailed Wilcoxon test). All error bars represent mean ± s.e.m. NS, not significant, *P < 0.05, **P < 0.01, ***P < 0.001, ****P < 0.0001.
Figure. 4.
Figure. 4.. Preferential, cell-type-specific alteration of cocaine- or morphine-induced neuronal responses to natural reward.
(a), Top: Representative heatmap of D1 neuronal responses during food consumption from an example mouse before exposure to cocaine (n = 176 matched neurons). Bottom: non-negative matrix factorization (NMF) representation of neuronal states labeled by clusters. (b), Top: Representative heatmap of D1 neuronal responses during food consumption from an example mouse during acute withdrawal of cocaine (n = 176 matched neurons). Bottom: NMF representation of neuronal states labeled by k-means clusters. (c), Percentage of D1 neurons activated by food and water consumption in the same mice before and after cocaine exposure (n = 914 matched neurons combined from 13 matched sessions from 3 mice, Fisher’s exact test). (d), Variances explained by top 3 principal components (PCs) during food and water consumption in the same mice before and after cocaine exposure (n = 13 matched sessions from 3 mice). (e), Matched D1 neuronal responses in the same mice before and after cocaine exposure (n = 914 matched neurons, two-tailed Wilcoxon test). (f), Top: Representative heatmap of D2 neuronal responses during food consumption from an example mouse before exposure to cocaine (n = 118 matched neurons). Bottom: NMF representation of neuronal states labeled by clusters. (g), Top: Representative heatmap of D2 neuronal responses during food consumption from an example mouse during acute withdrawal of cocaine (n = 118 matched neurons). Bottom: NMF representation of neuronal states labeled by clusters. (h), Percentage of D2 neurons activated by food and water consumption in the same mice before and after cocaine exposure (n = 488 matched neurons combined from 12 sessions from 3 mice, Fisher’s exact test). (i), Variances explained by top 3 PCs during food and water consumption in the same mice before and after cocaine exposure (n = 12 matched sessions from 3 mice). (j), Matched D2 neuronal responses in the same mice before and after cocaine exposure (n = 488 matched neurons, two-tailed Wilcoxon test). (k), Top: Representative heatmap of D1 neuronal responses during food consumption from an example mouse before exposure to morphine (n = 52 matched neurons). Bottom: NMF representation of neuronal states labeled by clusters. (l), Top: Representative heatmap of D1 neuronal responses during food consumption from an example mouse during acute withdrawal of morphine (n = 52 matched neurons). Bottom: NMF representation of neuronal states labeled by clusters. (m), Percentage of D1 neurons activated by food and water consumption in the same mice before and after morphine exposure (n = 587 matched neurons combined from 10 sessions from 3 mice, Fisher’s exact test). (n), Variances explained by top 3 PCs during food and water consumption in the same mice before and after morphine exposure (n = 10 matched sessions from 3 mice). (o), Matched D1 neuronal responses in the same mice before and after morphine exposure (n = 587 matched neurons, two-tailed Wilcoxon test). (p), Top: Representative heatmap of D2 neuronal responses during food consumption from an example mouse before exposure to morphine (n = 284 matched neurons). Bottom: NMF representation of neuronal states labeled by clusters. (q), Top: Representative heatmap of D2 neuronal responses during food consumption from an example mouse during acute withdrawal of morphine (n = 284 matched neurons). Bottom: NMF representation of neuronal states labeled by cluster. (r), Percentage of D2 neurons activated by food and water consumption in the same mice before and after morphine exposure (n = 1174 matched neurons combined from 11 sessions from 3 mice, Fisher’s exact test). (s), Variances explained by top 3 PCs during food and water consumption in the same mice before and after morphine exposure (n = 11 matched sessions from 3 mice). (t), Matched D2 neuronal responses in the same mice before and after morphine exposure (n = 1174 matched neurons, two-tailed Wilcoxon test). All error bars represent mean ± s.e.m. NS, not significant, *P < 0.05, **P < 0.01, ***P < 0.001, ****P < 0.0001.
Figure. 5.
Figure. 5.. Rheb serves as a molecular link to enable disruption of natural reward processing induced by repeated exposure to either cocaine or morphine.
(a), Schematic of the in silico FOS-Seq approach to identify genes associated with brain-wide c-Fos activity patterns. Genes with Pearson Correlation Coefficient > 0.15 or < −0.15 and p < 0.05 are classified as positively correlated or negatively correlated genes, while the rest are considered to be not correlated. Adjusted P-values are FDR-corrected at 5% threshold. (b), Volcano plot of genes associated with chronic exposure of cocaine. (c), Volcano plot of genes associated with chronic exposure of morphine. (d), Scatter plot of Pearson coefficient from genes associated with chronic exposure of cocaine vs. Pearson coefficient from genes associated with chronic exposure of morphine. (e), Schematic of in vivo NAc region-specific knockout of Rheb gene by co-expressing Cre and Rheb-sgRNAs or their control scrambled-sgRNAs in NAc core in LSL-Cas9 transgenic mice. (f), Immunohistochemistry validation of pS6 levels in Rheb knockout (KO) vs. Control (WT) at baseline. (g), Quantification of total pS6 fluorescent intensity in the NAc. (h), Schematic of snRNA-seq after CRISPR perturbations (n = 7001 cells mapped with either sgRNAs). (i), Distribution of Drd1+ cells in the UMAP. (j), Differentially expressed genes in Rheb-perturbed cells vs. control cells in the D1-MSN1 cluster (n = 598, 390 cells respectively). (k), Distribution of Drd2+ cells in the UMAP. (l), Differentially expressed genes in Rheb-perturbed cells vs. control cells in the D2-MSN1 cluster (n = 449, 375 cells respectively). (m), Venn diagram of genes significantly regulated by Rheb perturbation between D1-MSN1 and D2-MSN1 clusters. (n), Comparisons of cumulative food intake (g), water intake (g), weight (%) in the Rheb-KO group treated with saline for 5 days followed by another 5-day cocaine treatment (n = 8, 8 for each group, two-way ANOVA w’th Šídák's multiple comparisons). (o), Comparisons of cumulative food intake (g), water intake (g), weight (%) in the Rheb-KO group treated with saline for 5 days followed by another 5-day morphine treatment (n = 8, 8 for each group, two-way ANOVA w’th Šídák's multiple comparisons). All error bars represent mean ± s.e.m. NS, not significant, *P < 0.05, **P < 0.01, ***P < 0.001, ****P < 0.0001.

References

    1. Hyman S. E., Malenka R. C., Nestler E. J., Neural mechanisms of addiction: the role of reward-related learning and memory. Annu Rev Neurosci 29, 565–598 (2006). - PubMed
    1. Koob G. F., Le Moal M., Drug addiction, dysregulation of reward, and allostasis. Neuropsychopharmacology 24, 97–129 (2001). - PubMed
    1. Kalivas P. W., Volkow N. D., The neural basis of addiction: a pathology of motivation and choice. Am J Psychiatry 162, 1403–1413 (2005). - PubMed
    1. Robinson T. E., Berridge K. C., The neural basis of drug craving: an incentive-sensitization theory of addiction. Brain Res Brain Res Rev 18, 247–291 (1993). - PubMed
    1. Ahmed S. H., Koob G. F., Transition from moderate to excessive drug intake: change in hedonic set point. Science 282, 298–300 (1998). - PubMed

Publication types