[Preprint]. 2023 Sep 5:2023.09.04.556156.
doi: 10.1101/2023.09.04.556156.

KAT2 paralogs prevent dsRNA accumulation and interferon signaling to maintain intestinal stem cells

Affiliations

KAT2 paralogs prevent dsRNA accumulation and interferon signaling to maintain intestinal stem cells

Mai-Uyen Nguyen et al. bioRxiv. .

Update in

Abstract

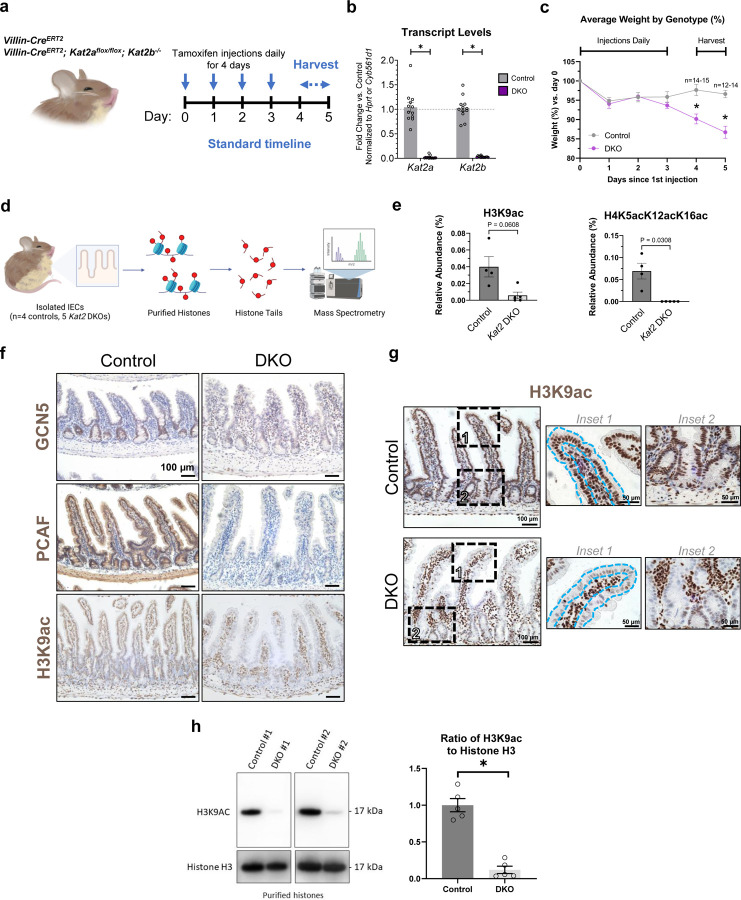
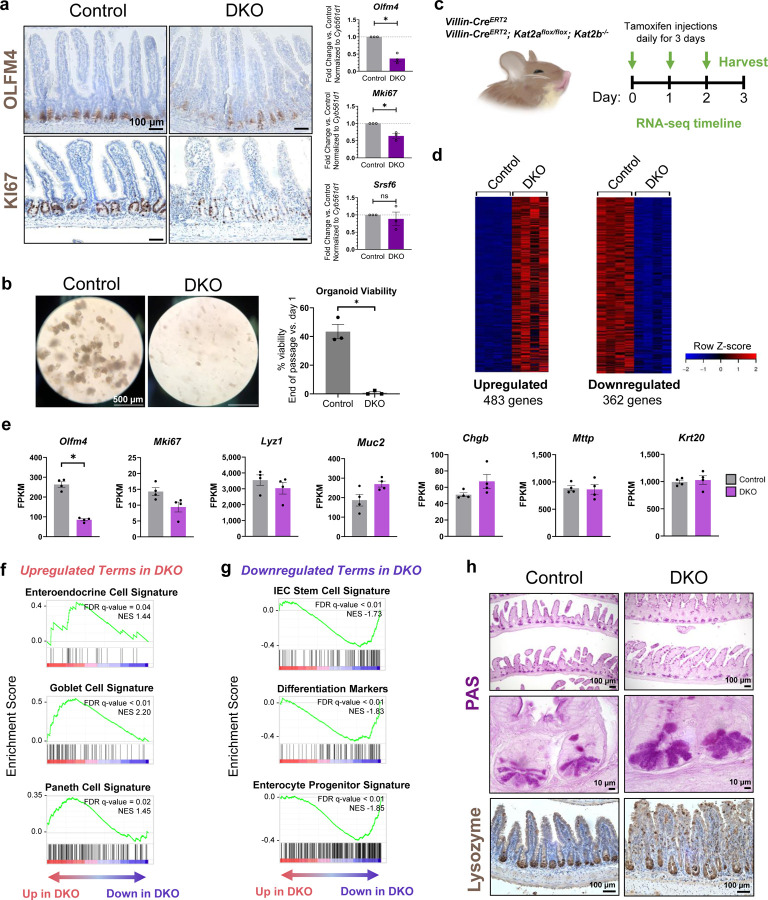
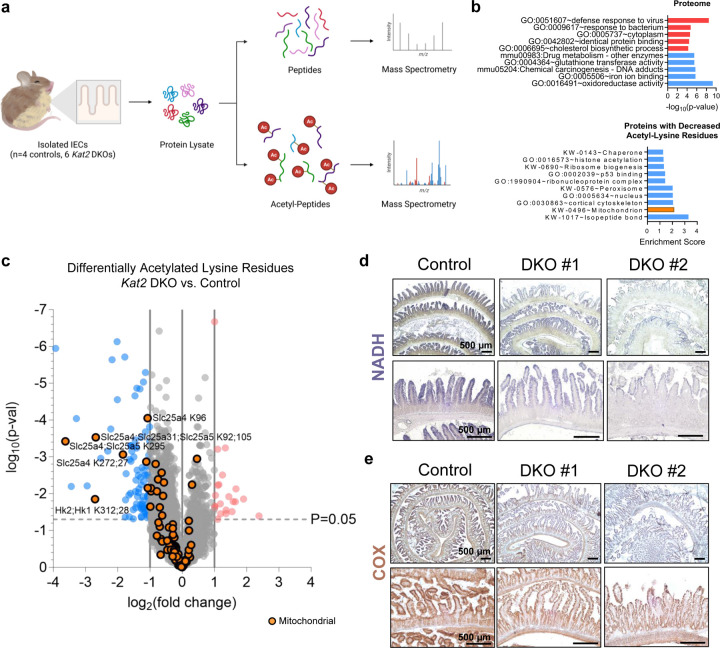
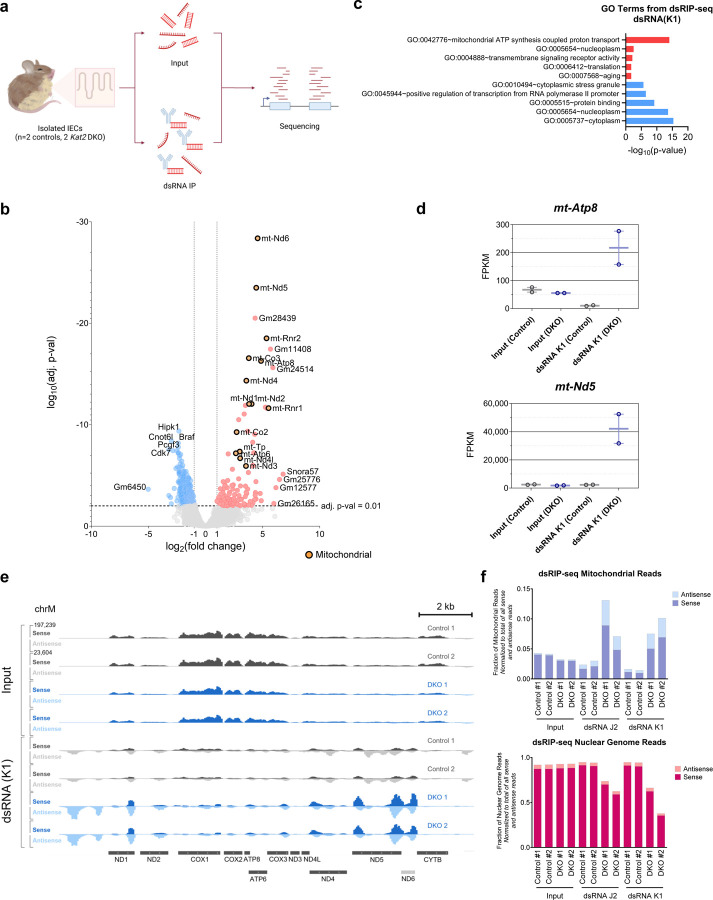
Histone acetyltransferases KAT2A and KAT2B are paralogs highly expressed in the intestinal epithelium, but their functions are not well understood. In this study, double knockout of murine Kat2 genes in the intestinal epithelium was lethal, resulting in robust activation of interferon signaling and interferon-associated phenotypes including the loss of intestinal stem cells. Use of pharmacological agents and sterile organoid cultures indicated a cell-intrinsic double-stranded RNA trigger for interferon signaling. Acetyl-proteomics and dsRIP-seq were employed to interrogate the mechanism behind this response, which identified mitochondria-encoded double-stranded RNA as the source of intrinsic interferon signaling. Kat2a and Kat2b therefore play an essential role in regulating mitochondrial functions as well as maintaining intestinal health.


Conflict of interest statement

CONFLICT OF INTEREST The authors declare that they have no conflict of interest.

Figures

Figure 1.
Figure 1.. Intestinal epithelium-specific double knockout (DKO) of Kat2a and Kat2b depletes H3K9ac and is required for survival.
(a) Timeline of induction of genetic knockouts and harvest. Vertical arrows indicate the days of tamoxifen injection. Horizontal arrows indicate the average time range for tissue collection. (b) Transcript levels of Kat2a and Kat2b from Kat2 DKO mice in vivo, normalized to housekeeping gene controls (two-way ANOVA with Bonferroni’s multiple comparisons test, * adj. p-val < 0.05, n=12–13/group). (c) Average weights over time in percent, relative to first day of tamoxifen injection, of DKO and control mice show that loss of Kat2 in the intestine leads to rapid weight loss and death (n=12–15 per group, mixed-effects ANOVA analysis, * adj. p-value < 0.05). (d) Schematic of the pipeline for histone PTM mass spectrometry. Created with Biorender.com. (e) Relative abundance (in percent) of H3K9ac and H45acK12acK16ac from histone PTM mass spectrometry of histones from Kat2 DKO IECs (n=4–5/group, Welch’s t-test). (f) Immunohistochemistry of jejunal sections using the indicated antibodies in control and DKO mice (n=3–4 per group), scale bar = 100 µm. Note efficient depletion of GCN5, PCAF, and H3K9ac in DKO tissues. (g) Additional H3K9ac immunostaining; insets outline the intestinal epithelium to highlight the epithelial-specific reduction of H3K9ac immunoreactivity. Scale bar = 100 µm for center images and 50 µm for insets. Immunostaining is representative of 4 biological replicates. (h) Left: immunoblots of two representative samples for H3K9ac and histone H3 expression on purified histones. Right: ratios of H3K9ac to histone H3 in DKOs from densitometric analysis using ImageJ (n=5/group, unpaired t-test, * p-val < 0.01). All graphs show means with error bars in SEM.
Figure 2.
Figure 2.. Intestinal epithelium-specific Kat2a/Kat2b DKO leads to loss of stem cell renewal and skews expression of distinct intestinal lineage markers.
(a) Left: Immunohistochemistry on mouse jejunum for antibodies against OLFM4 and KI67 at 4–7 days after onset of tamoxifen treatment (n=3/group, scale bar = 100 µm). Right: RT-qPCR of Olfm4 and Ki67 transcript changes in DKO. Srsf6 was used as an additional reference gene, and all transcript expression was normalized to housekeeping gene control (n=3/group, unpaired t-test, * p-val < 0.01). (b) Left: Crypts were collected from mice 4–5 days after the onset of tamoxifen treatment, then seeded in Matrigel for organoid culture. Ex vivo primary epithelium-derived intestinal organoids grown for 6 days (n=3/group), scale bar = 500 µm. Right: Survival graph of intestinal organoids (n=3/group, unpaired t-test, * p-val < 0.01). (c) Experimental design for RNA-seq. Arrows indicate the days of tamoxifen injection, with tissue collection occurring on day 3. (d) Heatmap of significantly upregulated or downregulated RNA transcripts in Kat2a/Kat2b DKO mice (n=4/group, average FPKM > 1, DESeq2 adj. p-val < 0.05, fold change >2 or < −2). (e) FPKM values of Olfm4, Mki67, and select intestinal cell lineage markers from RNA-seq (n=4/group, DESeq2, * adj. p-val < 0.05). GSEA enrichment profiles from RNA-seq that are (f) upregulated or (g) downregulated (n=4/group). (h) PAS staining and IHC for lysozyme of intestinal tissue (n=3/group, scale bar = 10 or 100 µm). All graphs show means with error bars in SEM.
Figure 3.
Figure 3.. Kat2a/Kat2b DKO induces epithelial-intrinsic interferon signaling, which can be suppressed with pharmacological inhibitors of cytoplasmic double-stranded nucleic acid-sensing pathways.
(a) Top upregulated (red) and top downregulated (blue) GO terms in DKO samples (483 and 362 genes respectively, from RNA-seq figure 2d) using DAVID GO. (b) Expression profile of immune-related genes populated from RNA-seq and GO analysis (from 5 GO terms: GO:0051607, GO:0009615, GO:0002376, GO:0045087, and GO:0045071). (c) GSEA profiles demonstrate enrichment of IFN-β and IFN-λ targets from GSE142166 and downregulation of mitochondrial complex V in Kat2a/Kat2b DKO. (d) Timeline of events for ex vivo epithelium-derived intestinal organoid experiments, where mice are harvested on day 0 for 3D organoid culture containing antimicrobials (0.1 mg/mL Primocin, 100 U/mL penicillin-streptomycin). Induction of DKO with 16-hour tamoxifen (1 µM) treatment in ex vivo culture begins on day 4. Inhibitor treatment also begins on day 4 and ends on day 8 at the time of organoid collection. (e) RT-qPCR of ISGs from epithelium-derived intestinal organoids with DKO induced in culture, which were treated with pharmacological inhibitors targeting TBK1 (GSK8612, 10 µM), JAK (ruxolitinib, 2 µM), and STING (H-151, 2 µM) for 4 days. Inhibitors were added during and after induction of DKO in culture, with media and inhibitors refreshed daily (n=3 per group, two-way ANOVA with Tukey post-hoc analysis, * adj. p-val < 0.05 for the indicated gene versus 0.2% DMSO vehicle-treated DKO, normalized to Hprt). Mean shown with error bars in SEM. (f) Schematic of interferon signaling pathway activation via double-stranded nucleic acids. Targets of select inhibitors are shown in red.
Figure 4.
Figure 4.. Determination of H3K9ac status at ISGs induced in the Kat2 DKO.
(a) Mean H3K9ac coverage of all murine genes in the jejunal epithelium is shown at a metagene (transcription start site (TSS) to transcription end site (TES) ± 2 Kb (top) and only the TSS ± 2 Kb (bottom)). Positive and negative sense strands were reoriented into the same direction for analysis. Data visuals were generated with deepTools (v3.5.0) using ChIP-seq of H3K9ac from WT mice in GSE86996. (b) Left: K-means clustering of H3K9ac signal within 2 Kb of the TSS forms 5 distinct patterns in the murine jejunal epithelium. Positive and negative sense strands were reoriented into the same direction for analysis. Heatmap visual was generated with deepTools 3.5.0. Right: Pie charts indicating the percentage of upregulated ISGs from Kat2 DKO RNA-seq belonging to each cluster, highlighting that the presence of H3K9ac in wild type mice does not coincide with interferon stimulated gene expression upon Kat2 DKO. (c) Bar charts indicating the percentage of ISGs, all DEGs upregulated, and all DEGs downregulated from Kat2 DKO RNA-seq in each H3K9ac ChIP-seq cluster from Figure 4b. (d) Scatter plots showing the log fold change of Kat2 DKO FPKM values versus control FPKM values from RNA-seq versus the H3K9ac counts from ChIP-seq (GSE86996) for DEGs (top, from Fig. 4d) or all genes (bottom) from Kat2 DKO RNA-seq. There does not appear to be a strong correlation between H3K9ac levels and changes in RNA levels in the Kat2 DKO.
Figure 5.
Figure 5.. Mitochondrial proteins are differentially acetylated and mitochondrial enzyme activity is compromised in Kat2 DKO.
(a) Schematic of the pipeline for acetylomics mass spectrometry. Created with Biorender.com. (b) GO term analysis of the proteome (top) and non-histone proteins with downregulated acetyl-lysine residues (bottom) from Kat2 DKO IECs (n=4 controls, 6 DKOs). (c) Volcano plot of acetyl-lysine residues from acetylomics of Kat2 DKO IECs. Orange points indicate lysine residues on mitochondrial proteins (n=4 controls, 6 DKOs). Stains for activity of mitochondrial enzymes (d) NADH and (e) COX in jejunal intestine sections (n=2–4/group, scale bar = 500 µm).
Figure 6.
Figure 6.. Mitochondrial double stranded RNA (dsRNA) is a likely source of ISG induction in Kat2a/Kat2b DKO.
(a) Schematic of the workflow for dsRIP-seq. Created with Biorender.com. (b) Volcano plot of dsRIP-seq for dsRNA (K1 antibody) pulldown (n=2/group, DESeq2 adj. p-val < 0.01, likelihood ratio test, average FPKM > 1) shows enrichment in dsRNA from mitochondrial transcripts that are specific to anti-dsRNA antibodies in the DKO versus controls and normalized for baseline levels of RNA in input samples. Orange points indicate mitochondrial genes. (c) Top upregulated (red) and top downregulated (blue) GO terms for DKO from dsRIP-seq using dsRNA (K1) antibody and DAVID GO. (d) FPKM values of select dsRNA species upregulated in DKO. Min values, max values, and mean of the values are shown. (e) IGV tracks for input and dsRNA (K1) pulldown samples from dsRIP-seq along the mitochondrial genome. Sense reads are on the same scale (0–197,239) in the upper half of the track and antisense reads on the same scale (0–23,604) in the lower half for each sample. (f) Number of unique mitochondrial (top) or nuclear (bottom) sense or antisense reads from each dsRIP-seq sample, normalized to the total number of all dsRIP-seq reads (including both sense and antisense transcripts).

References

    1. Li T. & Chen Z. J. The cGAS-cGAMP-STING pathway connects DNA damage to inflammation, senescence, and cancer. J Exp Med 215, 1287–1299 (2018). 10.1084/jem.20180139 - DOI - PMC - PubMed
    1. Yu L. & Liu P. Cytosolic DNA sensing by cGAS: regulation, function, and human diseases. Signal Transduct Target Ther 6, 170 (2021). 10.1038/s41392-021-00554-y - DOI - PMC - PubMed
    1. Sadeq S., Al-Hashimi S., Cusack C. M. & Werner A. Endogenous Double-Stranded RNA. Noncoding RNA 7 (2021). 10.3390/ncrna7010015 - DOI - PMC - PubMed
    1. Dhir A. et al. Mitochondrial double-stranded RNA triggers antiviral signalling in humans. Nature 560, 238–242 (2018). 10.1038/s41586-018-0363-0 - DOI - PMC - PubMed
    1. Schlee M. & Hartmann G. Discriminating self from non-self in nucleic acid sensing. Nat Rev Immunol 16, 566–580 (2016). 10.1038/nri.2016.78 - DOI - PMC - PubMed

Publication types