. 2023 Sep 5:17:1249119.
doi: 10.3389/fnins.2023.1249119. eCollection 2023.

Age-related asymmetry in left-right ears of sound lateralization with respect to four different rise times

Affiliations

Age-related asymmetry in left-right ears of sound lateralization with respect to four different rise times

Kazumoto Morita et al. Front Neurosci. .

Abstract

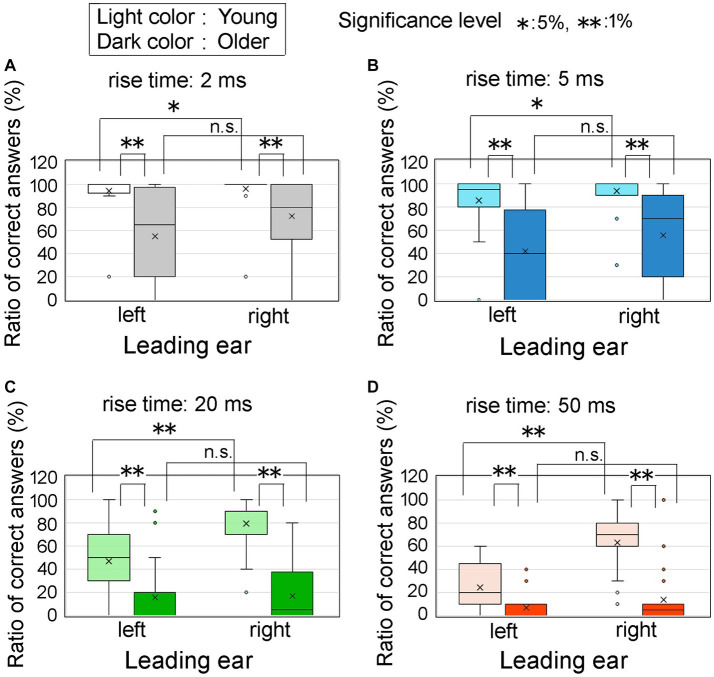
An experimental investigation was conducted to elucidate the auditory characteristics of the older adult population. The study involved 24 older adult and 24 young participants, with the aim of exploring their horizontal lateralization ability. This was achieved by presenting 1-kHz pure tones to the participants' right and left ears while introducing interaural time differences (ITDs). We examined the impact of four rise times (2, 5, 20, and 50 ms) on the onset of the test sound. The findings revealed that older adult participants exhibited lower levels of lateralization than young participants. Moreover, both older adult and young participants demonstrated diminished recognition of the onset portion as the rise time increased. Of particular significance was the conspicuous presence of a right ear advantage (REA) among young participants as the rise time was extended (statistically significant between the left and right ears at the 1% level, considering an ITD of 0.8 ms and a rise time of 50 ms). In contrast, older adult participants did not exhibit REA, even with a prolonged rise time (not significant at the 5% level at the same condition). These results indicate that the REA is not only present in language, as previously observed, but also extends to a pure tone in young participants. The older adult participants exhibited reduced performance in both left-and right-ear sound recognition. The influence of hearing threshold and preferred ear on sound lateralization performance was minimal. Therefore, it can be inferred that factors other than hearing threshold or preferred ear contribute to the presence of REA in young participants or its decline with age. The central and/or corpus callosum functions may also contribute to this phenomenon.

Keywords: aging; auditory; brain asymmetry; interaural time difference; lateralization; older adults.


Conflict of interest statement

The authors declare that the research was conducted in the absence of any commercial or financial relationships that could be construed as a potential conflict of interest.

Figures

Figure 1
Figure 1
A sample of a 1 kHz sound wave leading in the right ear by 0.8 ms. When participants judged the direction based on the ongoing portion, they concluded that the sound was leading in the left ear by 0.2 ms because of phase reversion. Reproduced from Morita et al. (2023a) with the permission of the Acoustical Society of America.
Figure 2
Figure 2
Four distinct shapes of smoothed onsets, each characterized by durations of 2, 5, 20, and 50 ms, respectively. The amplitude of the sound at the onset increased to the maximum, following each function. Conversely, the amplitude decay of the offset component of the sound was maintained for a constant duration of 2 ms.
Figure 3
Figure 3
Spectral diagrams illustrating the characteristics of four distinct rise times within the initial 50 ms of the presented auditory stimulus. The spectral graphs represent rise times of (A) 2 ms, (B) 5 ms, (C) 20 ms, and (D) 50 ms. The extent of frequency dispersion remained relatively restricted to a frequency of 1 kHz.
Figure 4
Figure 4
Hearing thresholds observed in a group of 24 older adult participants and 24 young participants. The thresholds are depicted for four distinct categories: (A) the left ear of the older adult participants, (B) the right ear of the older adult participants, (C) the left ear of the young participants, and (D) the right ear of the young participants. Within each graph, the thin lines represent the individual thresholds for each participant, with a step size of 5 dB hearing levels, and the bold line represents the mean threshold.
Figure 5
Figure 5
Relative significance of each predictor utilized during the construction of the NN, with normalization performed to establish the ITD value as 100. Building on our previous investigations of ITD (Morita et al., 2019, 2021, 2023b), this study focuses on exploring the impact of rise time, which represents, as shown in the figure, the second strongest association (i.e., normalized importance) with lateralization in our findings. HL, hearing level; ITD, interaural time difference; NN, neural network.
Figure 6
Figure 6
Percentage of correct answers when the sound of 1 kHz was presented with respect to four rise times, left panel (A): older adult participants, right panel (B): young participants. The horizontal axis displays ITD values, wherein negative values signify stimuli presented to the left ear first, while positive values indicate stimuli presented to the right ear first. Error bars mean the standard errors (SEs). ITD, interaural time difference.
Figure 7
Figure 7
Percentage of correct answers at an ITD of 0.8 ms for the four rise time conditions. In the figure, (A) refers to older adult participants with left-ear precedence, (B) refers to older adult participants with right-ear precedence, (C) refers to young participants with left-ear precedence, and (D) refers to young participants with right-ear precedence. These conditions were examined at an ITD of 0.8 ms. Asterisks denote significant differences observed among the rise time conditions, as determined by Friedman’s test. To address the issue of multiple comparisons, the Bonferroni correction was employed. The legends for the boxplot are shown in the figure. ITD, interaural time difference.
Figure 8
Figure 8
Percentage of correct answers at an ITD of 0.8 ms for the age groups and leading ear. In the figure, Panels (A–D) represent the different leading ears and the rise times of 2, 5, 20, and 50 ms, respectively. The horizontal axis represents the leading ears, specifically the left and right ears. The light and dark colored boxes represent the results obtained from young participants and older adult participants, respectively. Asterisks denote statistically significant differences in test conditions, which were determined using t-tests or nonparametric tests such as the Wilcoxon signed-rank sum test for paired samples or the Mann–Whitney test for two-independent samples. The legends for the boxplot are the same as those shown in Figure 7. ITD, interaural time difference.
Figure 9
Figure 9
Results for the correlation between hearing thresholds and the ratio of correct answers at an ITD of 0.8 ms and rise time of 20 ms. In the figure, panel (A) refers to older adult participants, panel (B) refers to young participants. Blue marks indicate data for the left ear and red marks for the right ear. The figures include the regression equations for both the left ear (blue line) and right ear (red line) for each age group. The results of correlational analysis are shown in Table 3. ITD, interaural time difference.
Figure 10
Figure 10
Percentage of correct answers at an ITD of 0.8 ms, focusing on the superior auditory abilities of participants. The analysis distinguishes between different conditions: (A) older adult participants with left-ear precedence, (B) older adult participants with right-ear precedence, (C) young participants with left-ear precedence, and (D) young participants with right-ear precedence. The utilization of light colored and dark colored boxes in the figure represent the better left and right ears, respectively. The horizontal axis corresponds to four distinct rise times. Notably, if we exclude a particular case (i.e., the rise time of 20 ms for older adult participants with left-ear precedence; A), the Mann–Whitney test indicates no significant differences in the remaining comparisons between the better left and right ears. The legends for the boxplot are the same as those in Figure 7. ITD, interaural time difference.
Figure 11
Figure 11
Percentage of correct answers at an ITD of 0.8 ms, specifically pertaining to the preferred ear of the participants. The older adult participants were divided into two groups: (A) older adult participants with left-ear precedence, (B) older adult participants with right-ear precedence, (C) young participants with left-ear precedence, and (D) young participants with right-ear precedence. The preferred left ear and preferred right ear are denoted by the light and dark colored boxes, respectively. The horizontal axis represents four different rise times. Statistical analysis using the Mann–Whitney test revealed no significant differences between the preferred left and right ear conditions. The legends for the boxplot are the same as those in Figure 7. ITD, interaural time difference.
Figure 12
Figure 12
Comparison of the MMNs at F3, Fz, and F4 of 19 older adult participants with incorrect (red box) and correct (blue box) lateralization responses. A correct judgment was defined as a lateralization to the side of the leading ear in the onset part. In the figure, (A) “Right” responses by seven participants to a sound with an ITD of 0.8 ms leading in the left ear were considered incorrect, while “Left” responses by 12 participants were considered correct; (B) seven participants incorrectly responded “Left” and 12 correctly responded “Right.” The legends for the boxplot are the same as those in Figure 7. Significant differences in MMN were recognized at F3 (p = 0.019) and Fz (p = 0.041) in the right ear-leading condition. The MMN values did not significantly differ between correct and incorrect responses for the electrode sites in the left ear-leading condition. Reproduced from Morita et al. (2023a) with the permission of the Acoustical Society of America. The figure was slightly modified to describe symbols indicating significant differences between correct and incorrect responses. MMN, mismatch negativity.

Similar articles

References

    1. Abel S. M., Kunov H. (1983). Lateralization based on interaural phase differences: effects of frequency, amplitude, duration, and shape of rise/decay. J. Acoust. Soc. Am. 73, 955–960. doi: 10.1121/1.389020 - DOI - PubMed
    1. Anderson S., Gordon-Salant S., Dubno J. R. (2019). Hearing and aging effects on speech understanding: challenges and solutions. Acoust. Today. 14, 10–18. doi: 10.1121/AT.2018.14.4.12 - DOI
    1. Balakrishnan U., Freyman R. L. (2002). Lateralization and detection of pulse trains with alternating interaural time delays. J. Acoust. Soc. Am. 112, 1605–1616. doi: 10.1121/1.1504859 - DOI - PubMed
    1. Belin P., Zilbovicius M., Crozier S., Thivard L., Fontaine A., Masure M. C., et al. . (1998). Lateralization of speech and auditory temporal processing. J. Cogn. Neurosci. 10, 536–540. doi: 10.1162/089892998562834, PMID: - DOI - PubMed
    1. Buell T. N., Trahiotis C., Bernstein L. R. (1991). Lateralization of low-frequency tones: relative potency of gating and ongoing interaural delays. J. Acoust. Soc. Am. 90, 3077–3085. doi: 10.1121/1.401782 - DOI - PubMed

LinkOut - more resources