. 2023 Oct 31;14(5):e0093423.
doi: 10.1128/mbio.00934-23. Epub 2023 Sep 21.

PKR-mediated stress response enhances dengue and Zika virus replication

Affiliations

PKR-mediated stress response enhances dengue and Zika virus replication

Taissa Ricciardi-Jorge et al. mBio. .

Abstract

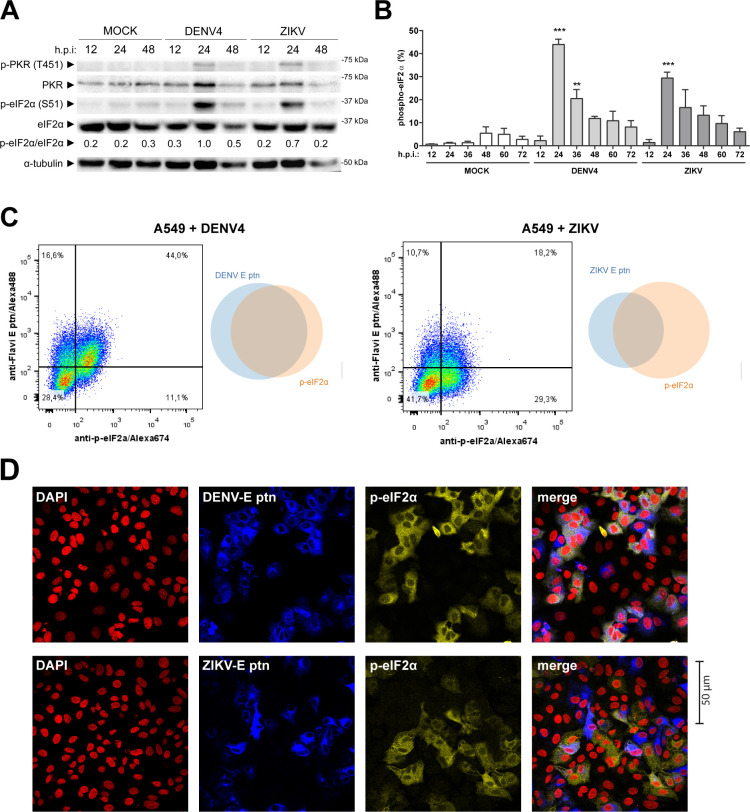
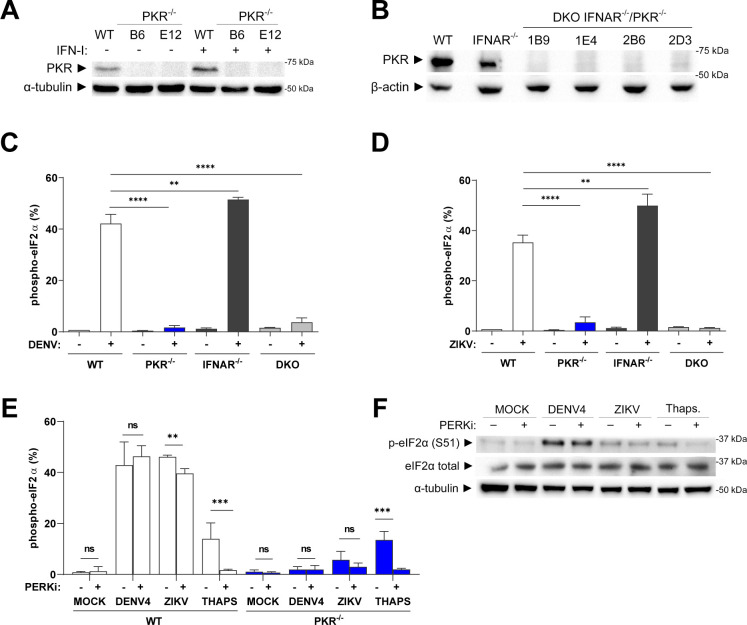
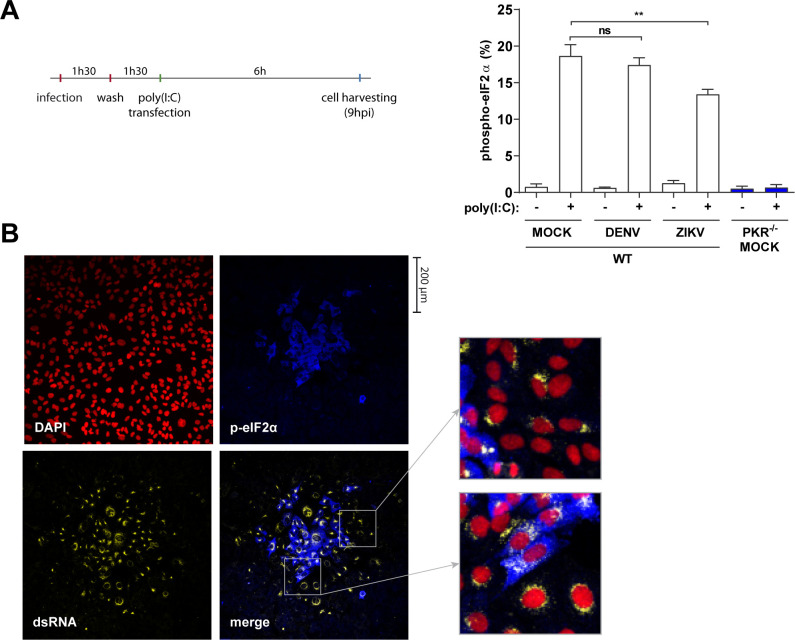
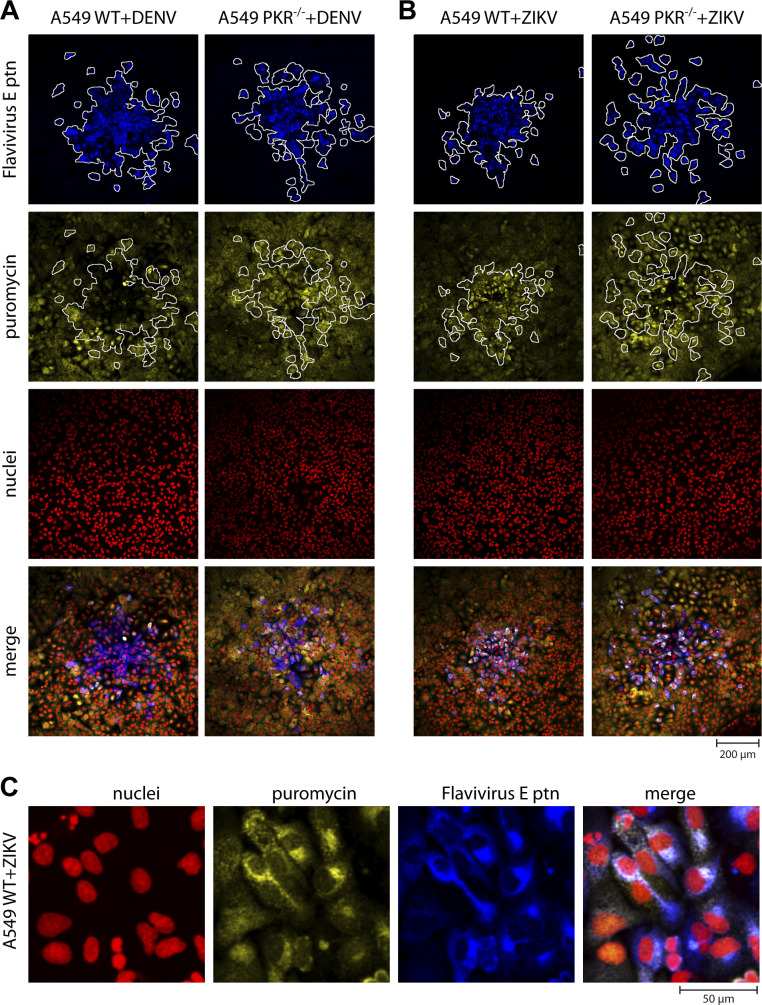
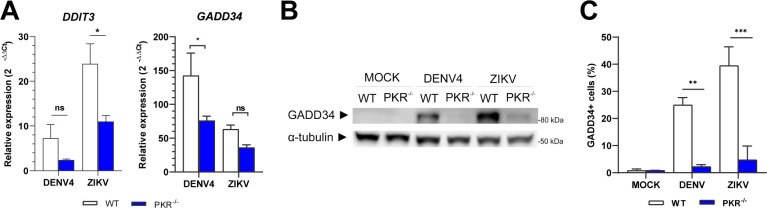
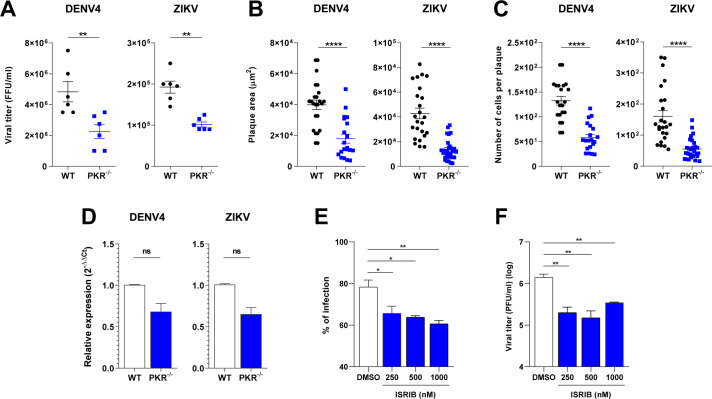
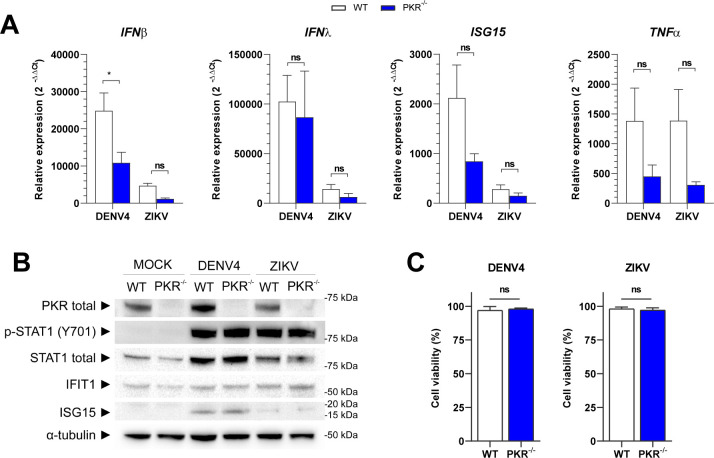
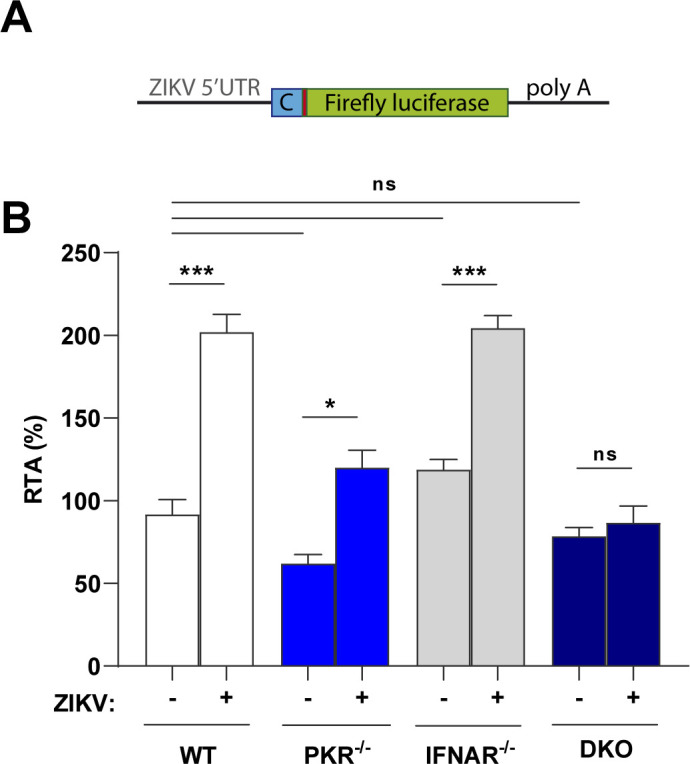
One of the fundamental features that make viruses intracellular parasites is the necessity to use cellular translational machinery. Hence, this is a crucial checkpoint for controlling infections. Here, we show that dengue and Zika viruses, responsible for nearly 400 million infections every year worldwide, explore such control for optimal replication. Using immunocompetent cells, we demonstrate that arrest of protein translations happens after sensing of dsRNA and that the information required to avoid this blocking is contained in viral 5'-UTR. Our work, therefore, suggests that the non-canonical translation described for these viruses is engaged when the intracellular stress response is activated.

Keywords: PKR; Zika virus; dengue virus; innate immunity; protein translation.


Conflict of interest statement

The authors declare no conflict of interest.

Figures

FIG 1
FIG 1
DENV4 and ZIKV promote phosphorylation of eIF2α in A549 cells. A549 cells were infected with DENV4 multiplicity of infection (MOI 2) or ZIKV (MOI 3) and harvested at the indicated times for analysis. (A) Immunoblot analysis of cell extracts resolved in denaturing SDS-PAGE. (B) Bar graph representative of flow cytometry analysis for quantification of cells expressing p-eIF2α within the total population (C) Dot plot and Venn diagram of representative results from co-staining with anti-flavivirus E protein and anti-p-eIF2α at 24 h.p.i. analyzed by flow cytometry and (D) immunofluorescence of infections under the same conditions, representative images of three independent experiments. In the column chart, the bars represent the means ± standard error of the mean from three independent experiments. Statistical analysis was performed by paired t test comparing infected samples to the respective uninfected control. **P ≤ 0.01, ***P ≤ 0.001. h.p.i., hours post-infection.
FIG 2
FIG 2
Phosphorylation of eIF2α during DENV4 or ZIKV infections is PKR dependent and IFN independent. (A) Characterization of A549 PKR−/− by immunoblot of unstimulated and stimulated cells with 100 IU/mL of IFN-α2a for 12 hours demonstrating successful PKR deletion. (B) Characterization of A549 IFNAR−/−/PKR−/− after stimulation with 100 IU/mL of IFN-α2a for 12 hours demonstrating the deletion of PKR on the parental IFNAR−/− cells. (C) Flow cytometry analysis for quantification of cells expressing p-eIF2α within the total population of the indicated lineages of A549 cells infected with DENV4 (MOI 2) at 24 h.p.i. and (D) same experiment using ZIKV (MOI 3). (E) Flow cytometry analysis for quantification of cells expressing p-eIF2α within the total population A549 WT and PKR−/− cells infected with DENV4 (MOI 2) or ZIKV (MOI 3) or treated with thapsigargin 2 µM for 45 minutes in the presence or absence of the PERK inhibitor GSK2656157 (5 µM) for 24 hours and (F) immunoblot analysis of cell extracts from the same experiment resolved in denaturing SDS-PAGE. Representative image of two independent experiments. In column charts, bars represent the mean ± standard error of the mean from three independent experiments. Statistical analysis was performed by one-way analysis of variance, followed by Tukey’s test for multiple comparisons. ** ≤ 0.05, *** ≤ 0.01, **** ≤ 0.0001. DKO, double IFNAR//PKR/− knockout; IFN, interferon; ns/no markup, no statistical difference.
FIG 3
FIG 3
PKR is not blocked by DENV4 or ZIKV but shows delayed activation. (A) Cells were infected with DENV4 (MOI 2) and ZIKV (MOI 3) and incubated for 1 hour 30 minutes before the virus inoculum was removed. Then, cells were stimulated with poly(I:C) at 3 h.p.i. with 10 µg/mL for 6 hours. Analysis for quantification of the cell population expressing p-eIF2α after stimulation with poly(I:C) was performed by flow cytometry. Data from three independent experiments. (B) Immunofluorescence of A549 WT cells infected with DENV4 for 48 h.p.i. in semi-solid medium. Cells fixed, permeabilized, and co-stained with 4′,6-diamidino-2-phenylindole (DAPI), anti-dsRNA and anti-p-eIF2α. Representative image of three independent experiments. In the column chart, bars represent the means ± standard error of the mean. Statistical analysis was performed by one-way analysis of variance, followed by Tukey’s test for multiple comparisons. **P ≤ 0.01. ns, no statistical difference.
FIG 4
FIG 4
DENV4, but not ZIKV, induces PKR-dependent translation arrest in infected cells. Immunofluorescence of A549 WT or PKR−/− cells infected with DENV4 (A) or ZIKV (B) at 20 PFU of FFU/well for 48 h.p.i. in semi-solid medium. Cells labeled with puromycin before fixation and permeabilization. Co-staining with DAPI, anti-puromycin, anti-flavivirus envelope (E) and secondary antibodies. (C) Zoom on WT cells infected with ZIKV for a better appreciation of the immunostaining pattern. Representative images of three independent experiments. FFU, focus forming unit.
FIG 5
FIG 5
PKR is required for expression of eIF2α-downstream genes and proteins during DENV4/ZIKV infections. A549 WT or PKR−/− cells infected with DENV4 (MOI 2) or ZIKV (MOI 3) and harvested at 24 h.p.i. for analysis. (A) Quantification by RT-qPCR of DDIT3 and GADD34 gene expression. Relative expression calculated by 2−ΔΔCt methods using mock cells as reference. (B) Immunoblot analysis of GADD34 protein expression. Representative image of two independent experiments. (C) Flow cytometry analysis for quantification of cells expressing GADD34 within the total population. In the column charts, bars represent the means ± standard error of the mean from three independent experiments. Statistical analysis was performed by paired t test comparing the two cell lineages under the same conditions. *P ≤ 0.05, **P ≤ 0.01, ***P ≤ 0.001. ns/no markup, no statistical difference.
FIG 6
FIG 6
Disruption of the PKR-eIF2α pathway impairs DENV4 and ZIKV replication. (A) Viral titration from A549 WT or PKR−/− cells infected with DENV4 (MOI 2) or ZIKV (MOI 3) and harvested at 24 h.p.i. for analysis (three independent experiments). Plaque size comparison of virus in A549 WT or PKR−/− cells infected with DENV4 and incubated for 8 days or infected with ZIKV and incubated for 5 days: measurements of (B) plaque areas and (C) number of cells per plaque from immunofluorescence. (D) Quantification by RT-qPCR of DENV4 or ZIKV viral RNA from A549 WT or PKR−/− cells infected with DENV4 (MOI 2) or ZIKV (MOI 3) and harvested at 24 h.p.i. for analysis (three independent experiments). Relative expression calculated by 2−ΔΔCt method using mock cells as a reference for cell genes and WT cells as reference for viral genome. Statistical analysis was performed by paired t test comparing the two cell lineages under the same conditions. A549 cells infected with ZIKV, treated with the indicated concentration of integrated stress response inhibitor (ISRIB) ordimethyl sulfoxide (DMSO), and harvested at 24 h.p.i. (two independent experiments). (E) Quantification by flow cytometry of infected population labeled with anti-E protein. (F) Viral titration from experiment supernatant in VERO cells. Statistical analysis was performed by one-way analysis of variance with Dunnett’s multiple comparisons test. In all charts, bars represent the means ± standard error of the mean. Statistical analysis was performed by paired t test comparing the two cell lineages under the same conditions. *P ≤ 0.05, **P ≤ 0.01, ****P ≤ 0.0001. FFU, focus forming unit; ns/no markup, no statistical difference.
FIG 7
FIG 7
PKR deletion does not affect the innate immune response or cell viability. A549 WT or PKR−/− cells infected with DENV4 (MOI 2) or ZIKV (MOI 3) and harvested at 24 h.p.i. for analysis. (A) Quantification by RT-qPCR of IFNβ, IFNλ, ISG15, and TNF-α gene expression. Relative expression calculated by 2−ΔΔCt methods using mock cells as a reference. (B) Immunoblot analysis of cell extracts resolved in denaturing SDS-PAGE. Representative image of two independent experiments. (C) Flow cytometry analysis for quantification of living cells by staining with Zombie NIR viability dye. Mock WT cells set as 100% reference. In the column charts, bars represent the means ± standard error of the mean from three independent experiments. Statistical analysis was performed by paired t test comparing the two cell lineages under the same conditions. *P ≤ 0.05. ns/no markup, no statistical difference.
Fig 8
Fig 8
ZIKV 5′-UTR is sufficient to increase relative reporter translation in PKR-eIF2α competent cells. (A) Diagram of reporter construct used for the assay, containing the first 87 nt of viral capsid protein. (B) Relative translation of ZIKV reporter in A549 (WT/PKR−/−/IFNAR−/−/DKO) cells infected with ZIKV (MOI 3), transfected at 12 h.p.i. and analyzed at 36 h.p.i. In the column chart, the bars represent the means ± standard error of the mean from three independent experiments analyzed by two-way analysis of variance and Šidák’s multiple comparison test. *P ≤ 0.01, **P ≤ 0.001, ***P ≤ 0.0001. ns, no statistical difference.

Similar articles

Cited by

References

    1. Chambers TJ, Hahn CS, Galler R, Rice CM. 1990. Flavivirus genome organization, expression, and replication. Annu Rev Microbiol 44:649–688. doi:10.1146/annurev.mi.44.100190.003245 - DOI - PubMed
    1. Gillespie LK, Hoenen A, Morgan G, Mackenzie JM. 2010. The endoplasmic reticulum provides the membrane platform for biogenesis of the flavivirus replication complex. J Virol 84:10438–10447. doi:10.1128/JVI.00986-10 - DOI - PMC - PubMed
    1. Edgil D, Polacek C, Harris E. 2006. Dengue virus utilizes a novel strategy for translation initiation when cap-dependent translation is inhibited. J Virol 80:2976–2986. doi:10.1128/JVI.80.6.2976-2986.2006 - DOI - PMC - PubMed
    1. Song Y, Mugavero J, Stauft CB, Wimmer E, Shenk T, Sarnow P, Rice C. 2019. Dengue and Zika virus 5′ untranslated regions harbor internal ribosomal entry site functions. mBio 10:e00459-19. doi:10.1128/mBio.00459-19 - DOI - PMC - PubMed
    1. Fernández-García L, Angulo J, Ramos H, Barrera A, Pino K, Vera-Otarola J, López-Lastra M. 2021. The internal ribosome entry site of the Dengue virus mRNA is active when cap-dependent translation initiation is inhibited. J Virol 95:e01998-20. doi:10.1128/JVI.01998-20 - DOI - PMC - PubMed

MeSH terms