

Blood Flow Energy Identifies Coronary Lesions Culprit of Future Myocardial Infarction
- PMID: 37733110
- PMCID: PMC11252236
- DOI: 10.1007/s10439-023-03362-3
Blood Flow Energy Identifies Coronary Lesions Culprit of Future Myocardial Infarction
Abstract
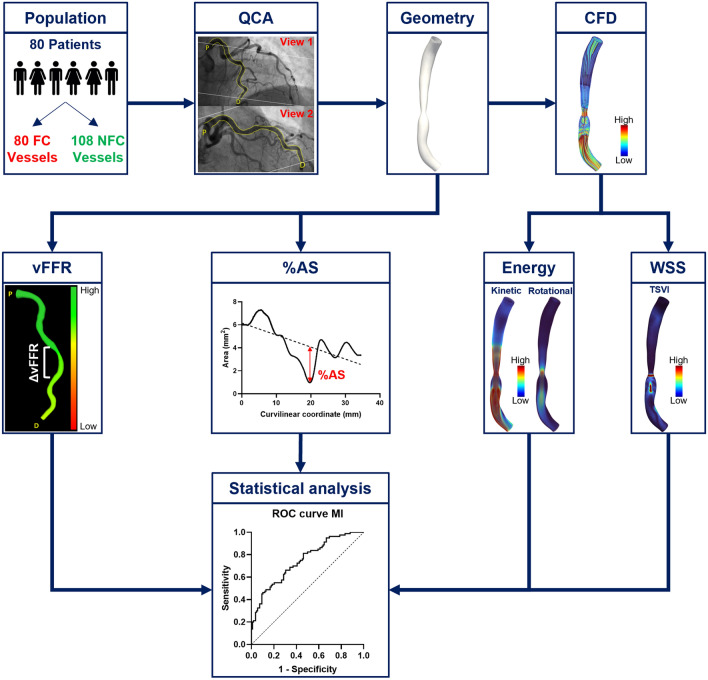
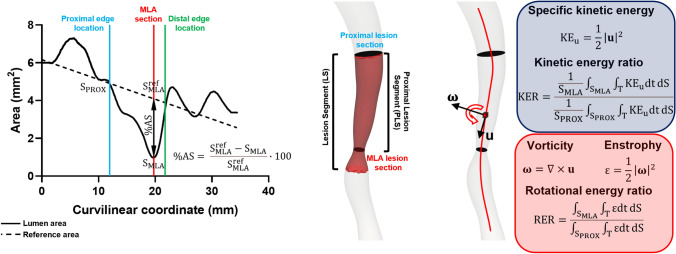
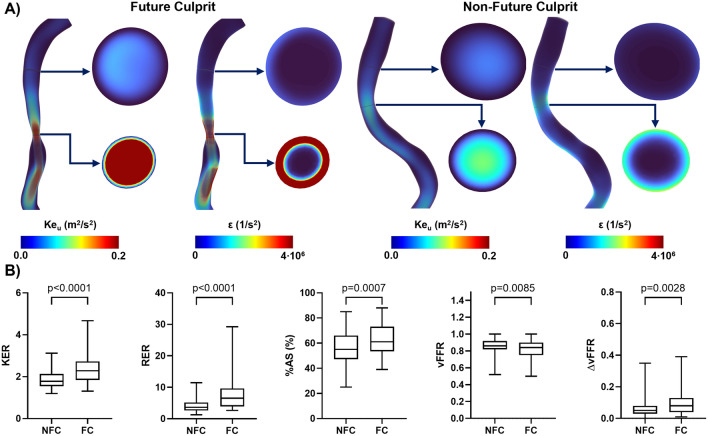
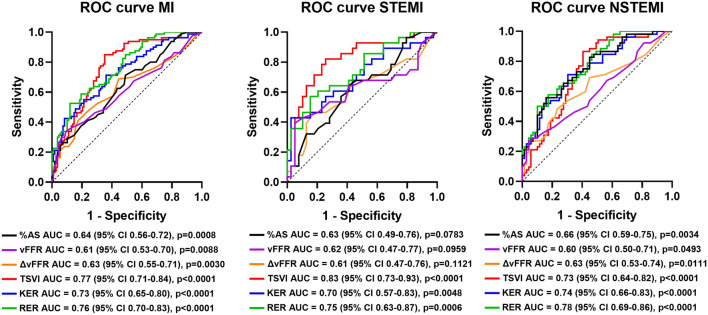
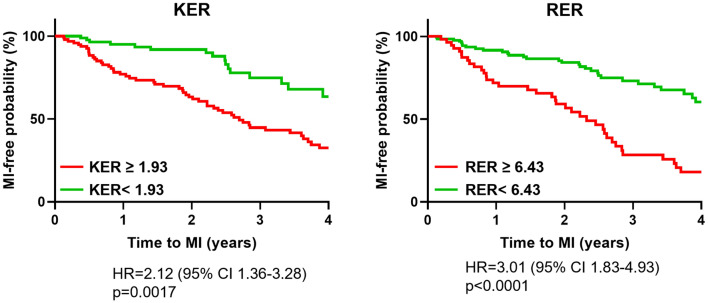
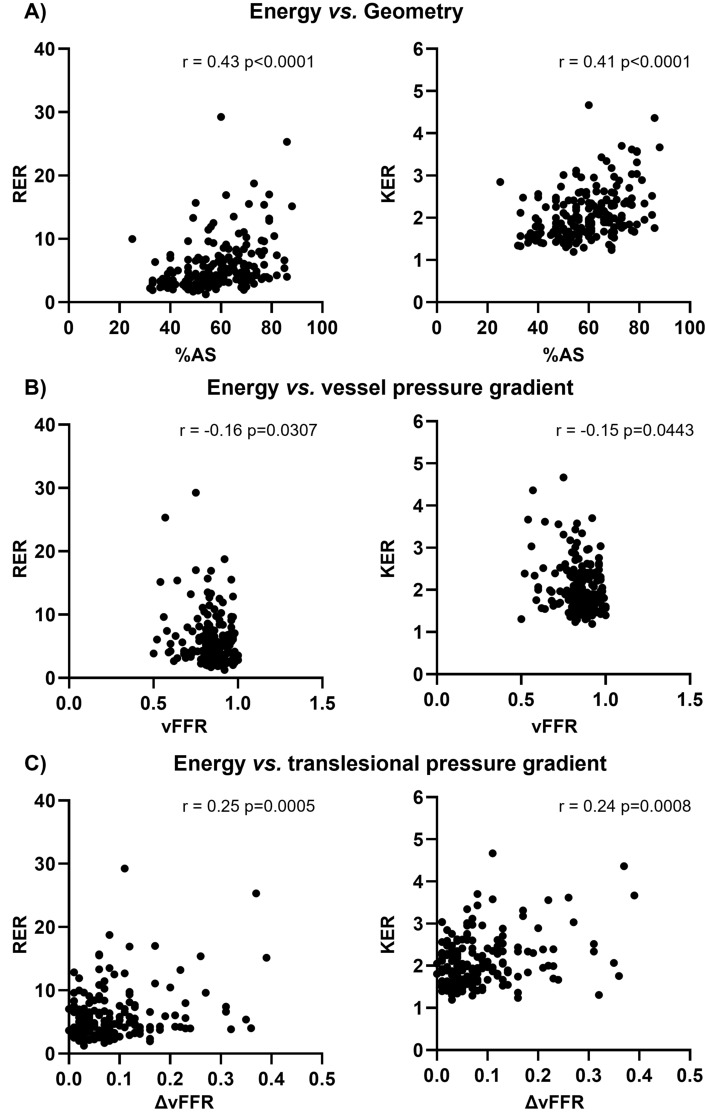
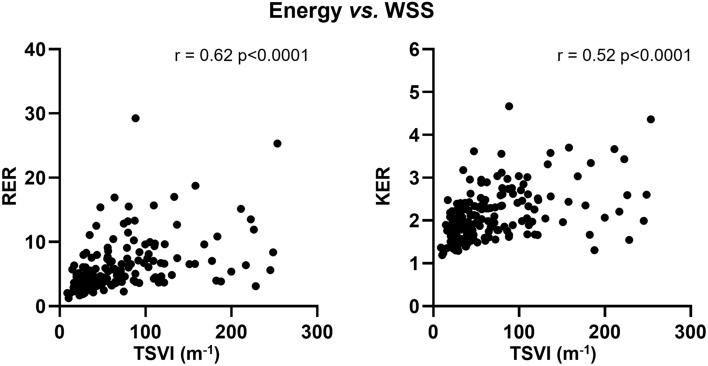
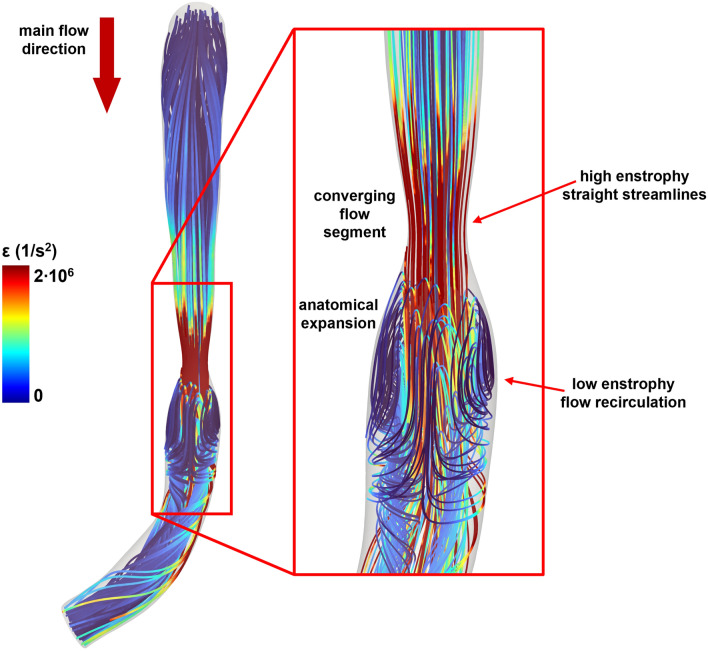
The present study establishes a link between blood flow energy transformations in coronary atherosclerotic lesions and clinical outcomes. The predictive capacity for future myocardial infarction (MI) was compared with that of established quantitative coronary angiography (QCA)-derived predictors. Angiography-based computational fluid dynamics (CFD) simulations were performed on 80 human coronary lesions culprit of MI within 5 years and 108 non-culprit lesions for future MI. Blood flow energy transformations were assessed in the converging flow segment of the lesion as ratios of kinetic and rotational energy values (KER and RER, respectively) at the QCA-identified minimum lumen area and proximal lesion sections. The anatomical and functional lesion severity were evaluated with QCA to derive percentage area stenosis (%AS), vessel fractional flow reserve (vFFR), and translesional vFFR (ΔvFFR). Wall shear stress profiles were investigated in terms of topological shear variation index (TSVI). KER and RER predicted MI at 5 years (AUC = 0.73, 95% CI 0.65-0.80, and AUC = 0.76, 95% CI 0.70-0.83, respectively; p < 0.0001 for both). The predictive capacity for future MI of KER and RER was significantly stronger than vFFR (p = 0.0391 and p = 0.0045, respectively). RER predictive capacity was significantly stronger than %AS and ΔvFFR (p = 0.0041 and p = 0.0059, respectively). The predictive capacity for future MI of KER and RER did not differ significantly from TSVI. Blood flow kinetic and rotational energy transformations were significant predictors for MI at 5 years (p < 0.0001). The findings of this study support the hypothesis of a biomechanical contribution to the process of plaque destabilization/rupture leading to MI.
Keywords: Computational fluid dynamics; Fractional flow reserve; Kinetic energy; Myocardial infarction; Quantitative coronary angiography; Rotational energy; Wall shear stress.
© 2023. The Author(s).
Conflict of interest statement
Candreva reports having consultancy agreements with Medyria, HiD-Imaging and Nanoflex Robotics; De Bruyne discloses institutional consulting fees from Abbott Vascular and Boston Scientific and equities in Philips, Siemens, GE, Bayer, HeartFlow, Edwards Lifesciences and Ceyliad; Collet reports receiving research grants from Biosensors, Heart Flow Inc., ShockWave Medical, Pie Medical Imaging, SIEMENS, GE, Medis Medical Imaging and Abbott Vascular; and consultancy fees from Opsens, Boston Scientific, Medyria, HeartFlow Inc. and Philips Volcano; Aben JP is an employee of Pie Medical Imaging. The remaining authors have nothing to disclose.
Figures
Similar articles
-
Association Between Automated 3D Measurement of Coronary Luminal Narrowing and Risk of Future Myocardial Infarction.J Cardiovasc Transl Res. 2024 Aug;17(4):893-900. doi: 10.1007/s12265-024-10500-2. Epub 2024 Mar 1. J Cardiovasc Transl Res. 2024. PMID: 38427153 Free PMC article.
-
Risk of myocardial infarction based on endothelial shear stress analysis using coronary angiography.Atherosclerosis. 2022 Feb;342:28-35. doi: 10.1016/j.atherosclerosis.2021.11.010. Epub 2021 Nov 16. Atherosclerosis. 2022. PMID: 34815069
-
Wall shear stress estimated by 3D-QCA can predict cardiovascular events in lesions with borderline negative fractional flow reserve.Atherosclerosis. 2021 Apr;322:24-30. doi: 10.1016/j.atherosclerosis.2021.02.018. Epub 2021 Feb 24. Atherosclerosis. 2021. PMID: 33706080
-
Identification of High-Risk Plaques Destined to Cause Acute Coronary Syndrome Using Coronary Computed Tomographic Angiography and Computational Fluid Dynamics.JACC Cardiovasc Imaging. 2019 Jun;12(6):1032-1043. doi: 10.1016/j.jcmg.2018.01.023. Epub 2018 Mar 14. JACC Cardiovasc Imaging. 2019. PMID: 29550316
-
Non-invasive imaging software to assess the functional significance of coronary stenoses: a systematic review and economic evaluation.Health Technol Assess. 2021 Sep;25(56):1-230. doi: 10.3310/hta25560. Health Technol Assess. 2021. PMID: 34588097
Cited by
-
Advances in the Computational Assessment of Disturbed Coronary Flow and Wall Shear Stress: A Contemporary Review.J Am Heart Assoc. 2024 Oct;13(19):e037129. doi: 10.1161/JAHA.124.037129. Epub 2024 Sep 18. J Am Heart Assoc. 2024. PMID: 39291505 Free PMC article. Review.
-
Prediction of Hemodynamic-Related Hemolysis in Carotid Stenosis and Aiding in Treatment Planning and Risk Stratification Using Computational Fluid Dynamics.Biomedicines. 2023 Dec 22;12(1):37. doi: 10.3390/biomedicines12010037. Biomedicines. 2023. PMID: 38255144 Free PMC article.
-
Association Between Automated 3D Measurement of Coronary Luminal Narrowing and Risk of Future Myocardial Infarction.J Cardiovasc Transl Res. 2024 Aug;17(4):893-900. doi: 10.1007/s12265-024-10500-2. Epub 2024 Mar 1. J Cardiovasc Transl Res. 2024. PMID: 38427153 Free PMC article.
References
-
- Brandts A, Roes SD, Doornbos J, Weiss RG, de Roos A, Stuber M, Westenberg JJM. Right coronary artery flow velocity and volume assessment with spiral K-space sampled breathhold velocity-encoded MRI at 3 tesla: accuracy and reproducibility. J. Magn. Reson. Imaging. 2010;31:1215–1223. doi: 10.1002/jmri.22144. - DOI - PMC - PubMed
-
- De Bruyne B, Paulus WJ, Vantrimpont PJ, Sys SU, Heyndrickx GR, Pijls NHJ. Transstenotic coronary pressure gradient measurement in humans: In vitro and in vivo evaluation of a new pressure monitoring angioplasty guide wire. J. Am. Coll. Cardiol. 1993;22:119–126. doi: 10.1016/0735-1097(93)90825-L. - DOI - PubMed
-
- Candreva A, De Nisco G, Lodi Rizzini M, D’Ascenzo F, De Ferrari GM, Gallo D, Morbiducci U, Chiastra C. Current and future applications of computational fluid dynamics in coronary artery disease. Rev. Cardiovasc. Med. 2022;23:377. doi: 10.31083/j.rcm2311377. - DOI
MeSH terms
Grants and funding
LinkOut - more resources
Full Text Sources
Medical
Research Materials
Miscellaneous
