Review
. 2023 Sep 21;87(4):60.
doi: 10.1007/s00285-023-01984-8.

The effect of dispersal on asymptotic total population size in discrete- and continuous-time two-patch models

Affiliations
Review

The effect of dispersal on asymptotic total population size in discrete- and continuous-time two-patch models

Carolin Grumbach et al. J Math Biol. .

Abstract

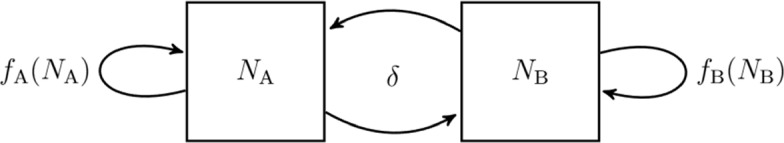
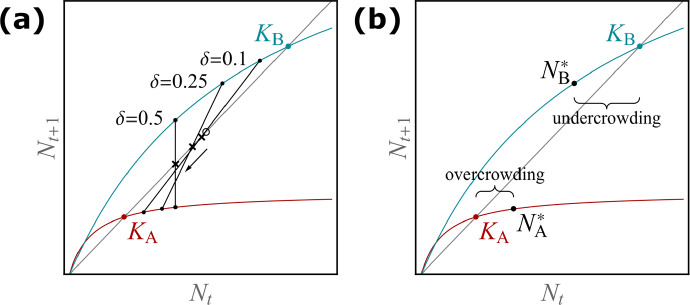
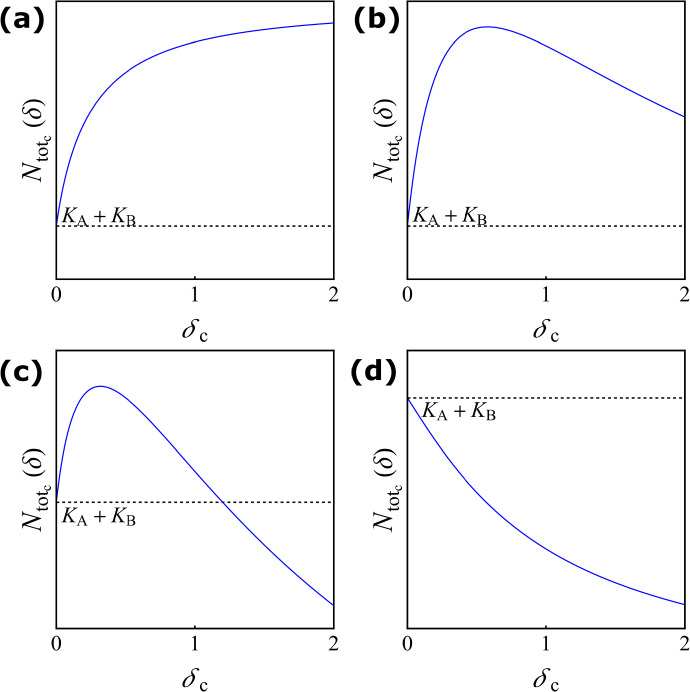
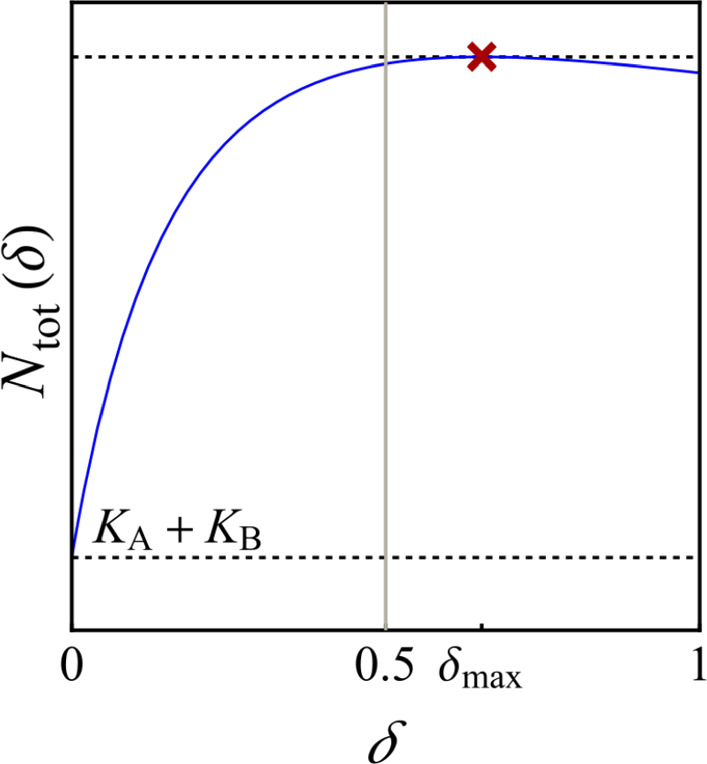
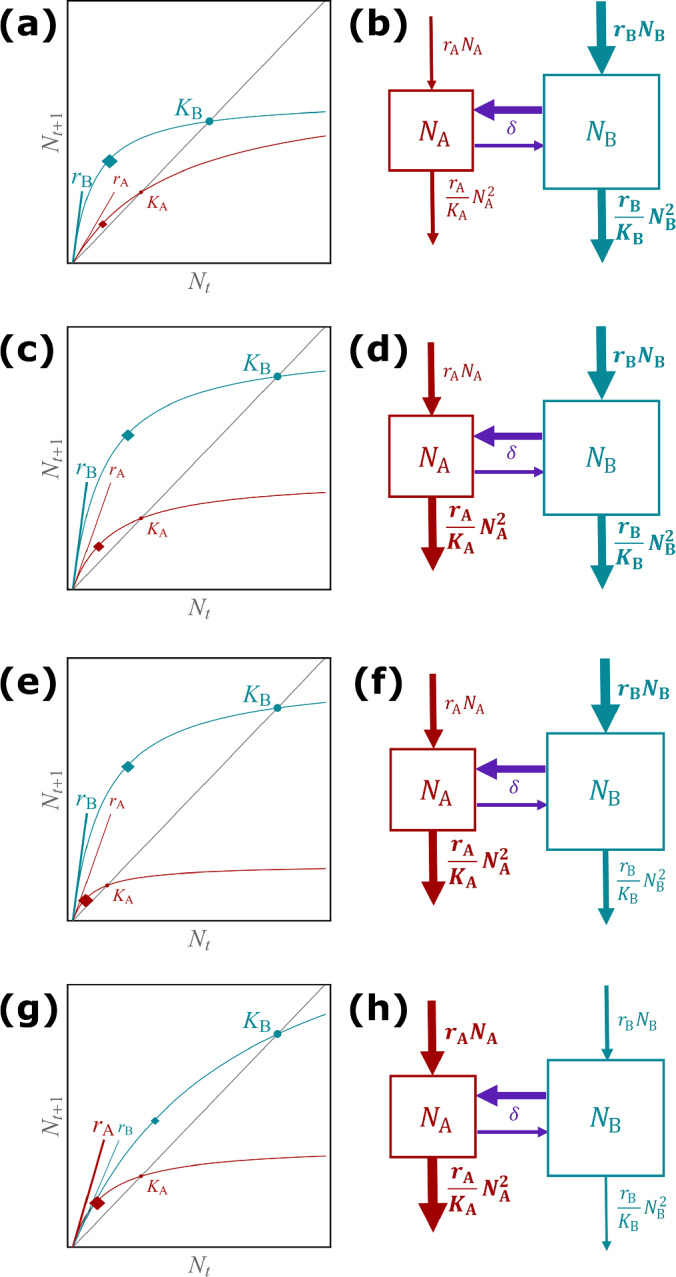
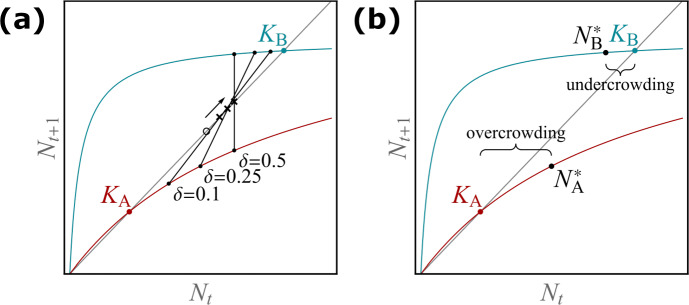
Many populations occupy spatially fragmented landscapes. How dispersal affects the asymptotic total population size is a key question for conservation management and the design of ecological corridors. Here, we provide a comprehensive overview of two-patch models with symmetric dispersal and two standard density-dependent population growth functions, one in discrete and one in continuous time. A complete analysis of the discrete-time model reveals four response scenarios of the asymptotic total population size to increasing dispersal rate: (1) monotonically beneficial, (2) unimodally beneficial, (3) beneficial turning detrimental, and (4) monotonically detrimental. The same response scenarios exist for the continuous-time model, and we show that the parameter conditions are analogous between the discrete- and continuous-time setting. A detailed biological interpretation offers insight into the mechanisms underlying the response scenarios that thus improve our general understanding how potential conservation efforts affect population size.

Keywords: Dispersal; Population dynamics; Spatial fragmentation; Total population size; Two-patch model.


Conflict of interest statement

The authors declare that they have no conflict of interest.

Figures

Fig. 1
Fig. 1
Two-patch model: the subpopulations NA and NB reproduce with growth functions fA(NA) and fB(NB), respectively. Individuals disperse between the patches symmetrically with dispersal rate δ
Fig. 2
Fig. 2
The asymptotic total population size in the discrete-time model in terms of the dispersal rate for the four different response scenarios in Theorem 1. The dashed horizontal line corresponds to the sum of the two carrying capacities, KA+KB. The grey vertical lines correspond to δ=0.5. The red cross indicates the maximal asymptotic total population size. a Monotonically beneficial with the parameter values rA=3,rB=1.5,KA=2,KB=1.5; b unimodally beneficial with rA=3.2,rB=1.5,KA=3.85,KB=1.37; c beneficial turning detrimental with rA=3.4,rB=1.5,KA=8.4,KB=1.37; d monotonically detrimental with rA=2,rB=1.25,KA=1,KB=1.25 (colour figure online)
Fig. 3
Fig. 3
A graphical approach to understand the influence of dispersal on the equilibrium population size in the discrete-time two-patch model. The growth functions in the two patches A and B are shown as red and blue curves, respectively. The carrying capacities are marked by a filled circle in the respective colour. The grey diagonal line is the identity function. a Illustrates the trend of the asymptotic total population size with increasing dispersal rate. The empty circle between the two carrying capacities marks half of the sum of the two carrying capacities. The crosses indicate half of the asymptotic total population size, and the thin lines connect the asymptotic subpopulation sizes for a fixed δ. The arrow highlights that, here, this sum decreases with increasing dispersal. b The magnitude of undercrowding resulting from dispersal is larger than the magnitude of overcrowding resulting from dispersal. The width of the curly brackets indicates the absolute difference between the equilibrium at δ=0 (i.e. the carrying capacity) and a nonzero δ (colour figure online)
Fig. 4
Fig. 4
The asymptotic total population size in the continuous-time model in terms of the dispersal rate for the four different response scenarios in Theorem 2. The dashed horizontal line corresponds to the sum of the two carrying capacities KAc+KBc. a Monotonically beneficial with the parameter values rAc=0.5,rBc=2,KAc=0.5,KBc=1; b Unimodally beneficial with rAc=1.1,rBc=2,KAc=0.5,KBc=1; c Beneficial turning detrimental with rAc=1,rBc=2,KAc=0.5,KBc=1.5; d Monotonically detrimental with rAc=1.1,rBc=2,KAc=2,KBc=1 (colour figure online)
Fig. 5
Fig. 5
The asymptotic total population size in the discrete-time model taking a maximum for a dispersal rate beyond perfect mixing, δ>0.5. The dashed horizontal line corresponds to the sum of the two carrying capacities KA+KB. Parameter values: rA=2.35,rB=1.7,KA=2.35,KB=1.75 (colour figure online)
Fig. 6
Fig. 6
Visualisation of the biological mechanisms driving the four response scenarios in the discrete-time (left column) and continuous-time model (right column). a, b Monotonically beneficial, c, d unimodally beneficial, e, f beneficial turning detrimental, g, h monotonically detrimental. In the left column, a larger font size indicates larger carrying capacities and/or intrinsic growth rates. The diamond symbolises the strength of intraspecific competition; its location is explained in the main text. A larger diamond indicates stronger intraspecific competition. In the right column, a larger box for the patch indicates a larger carrying capacity, and thicker arrows indicate larger in- or outflows (colour figure online)
Fig. 7
Fig. 7
Analogue of Fig. 3 for the monotonically beneficial response scenario: The growth functions in the two patches A and B are shown as red and blue curves, respectively. The carrying capacities are marked by a filled circle in the respective colour. The grey diagonal line is the identity function. a Illustrates the trend of the asymptotic total population size with increasing dispersal rate. The empty circle between the two carrying capacities marks half of the sum of the two carrying capacities. The crosses indicate half of the asymptotic total population size, and the thin lines connect the asymptotic subpopulation sizes for a fixed δ. The arrow highlights that, here, this sum increases with increasing dispersal. b The magnitude of overcrowding resulting from dispersal is larger than the magnitude of undercrowding resulting from dispersal. The width of the curly brackets indicates the absolute difference between the equilibrium at δ=0 (i.e. the carrying capacity) and a nonzero δ (colour figure online)

Similar articles

References

    1. Adler FR. Migration alone can produce persistence of host-parasitoid models. Am Nat. 1993;141:642–650. doi: 10.1086/285496. - DOI
    1. Allen LJS, Bolker BM, Lou Y, et al. Asymptotic profiles of the steady states for an SIS epidemic patch model. SIAM J Appl Math. 2007;67:1283–1309. doi: 10.1137/060672522. - DOI
    1. Arditi R, Lobry C, Sari T. Is dispersal always beneficial to carrying capacity? New insights from the multi-patch logistic equation. Theor Popul Biol. 2015;106:45–59. doi: 10.1016/j.tpb.2015.10.001. - DOI - PubMed
    1. Arditi R, Lobry C, Sari T. Asymmetric dispersal in the multi-patch logistic equation. Theor Popul Biol. 2018;120:11–15. doi: 10.1016/j.tpb.2017.12.006. - DOI - PubMed
    1. Arino J, Bajeux N, Kirkland S. Number of source patches required for population persistence in a source-sink metapopulation with explicit movement. Bull Math Biol. 2019;81:1916–1942. doi: 10.1007/s11538-019-00593-1. - DOI - PubMed

Publication types

LinkOut - more resources