. 2023 Oct 23;8(20):e163022.
doi: 10.1172/jci.insight.163022.

Cancer-associated fibroblasts reuse cancer-derived lactate to maintain a fibrotic and immunosuppressive microenvironment in pancreatic cancer

Affiliations

Cancer-associated fibroblasts reuse cancer-derived lactate to maintain a fibrotic and immunosuppressive microenvironment in pancreatic cancer

Fumimasa Kitamura et al. JCI Insight. .

Abstract

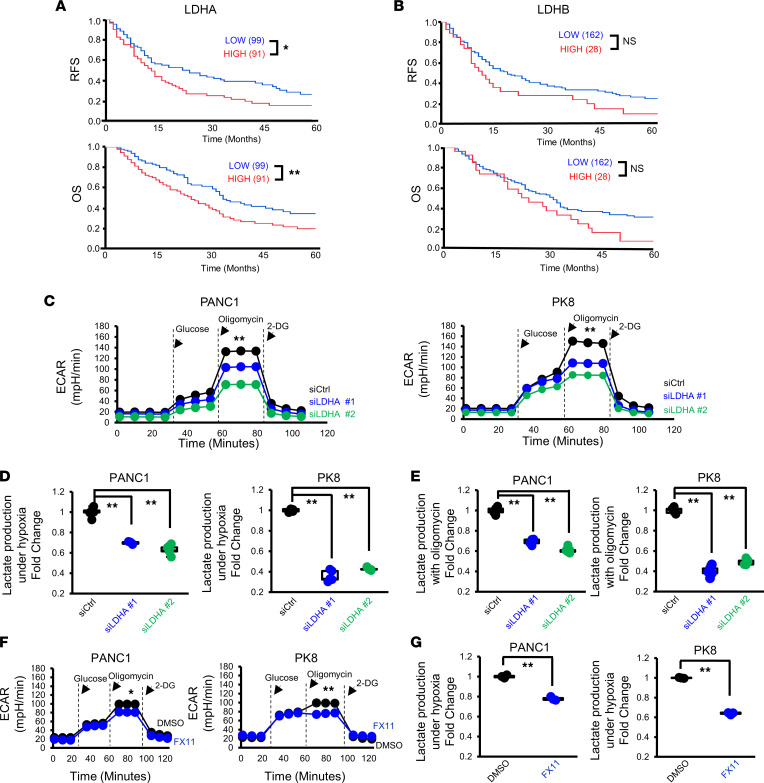
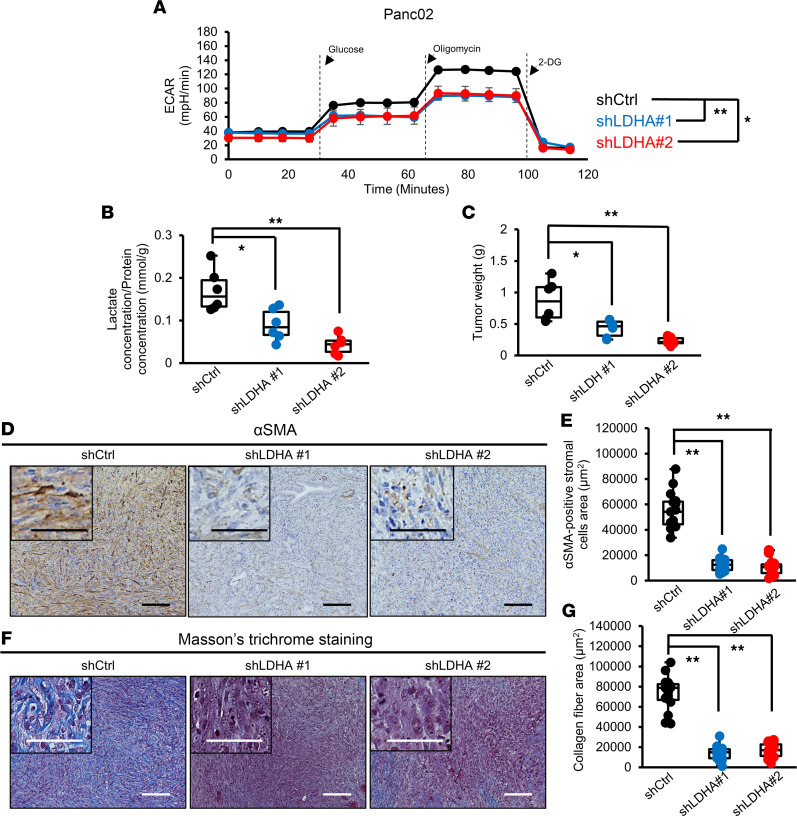
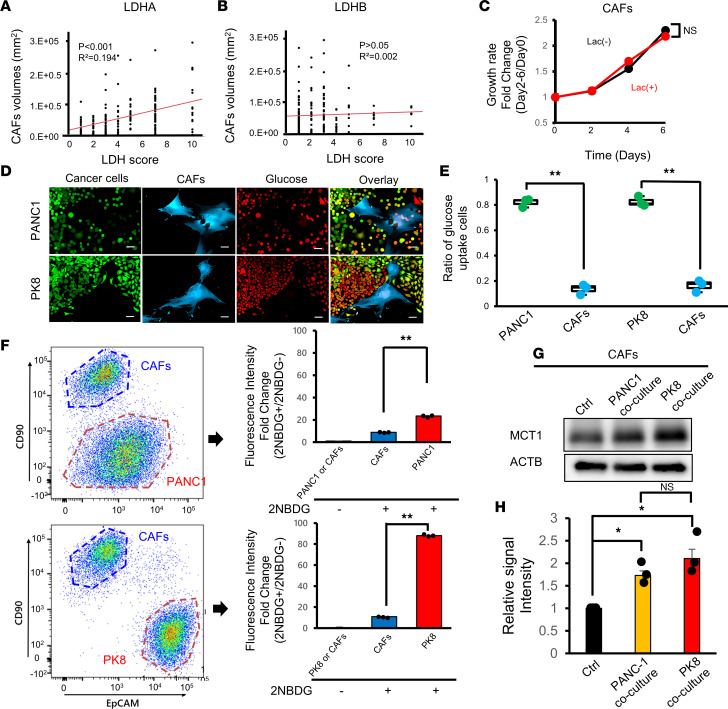
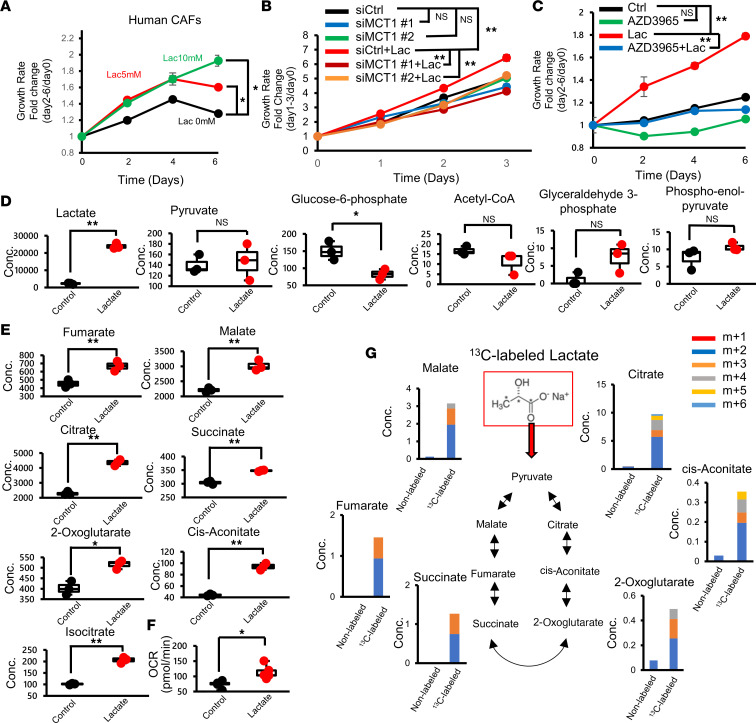
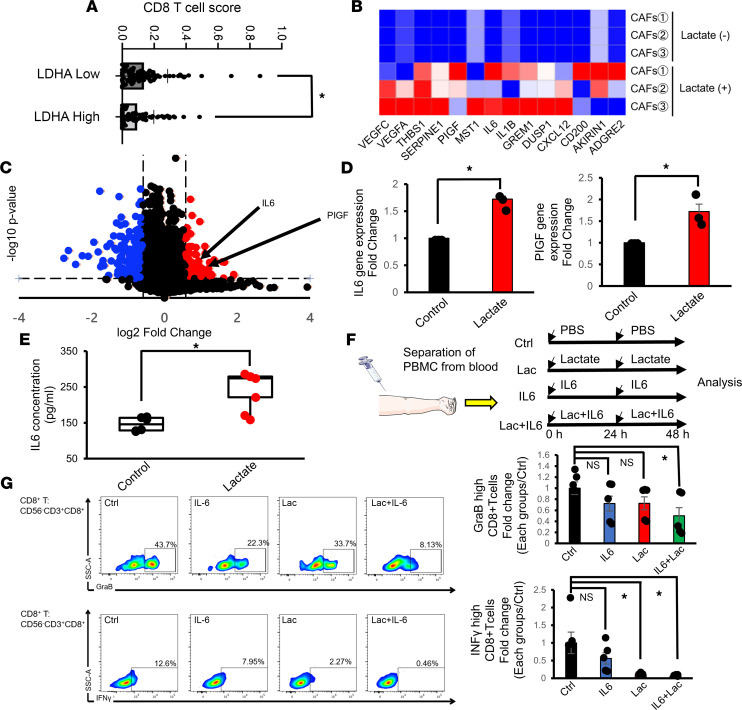
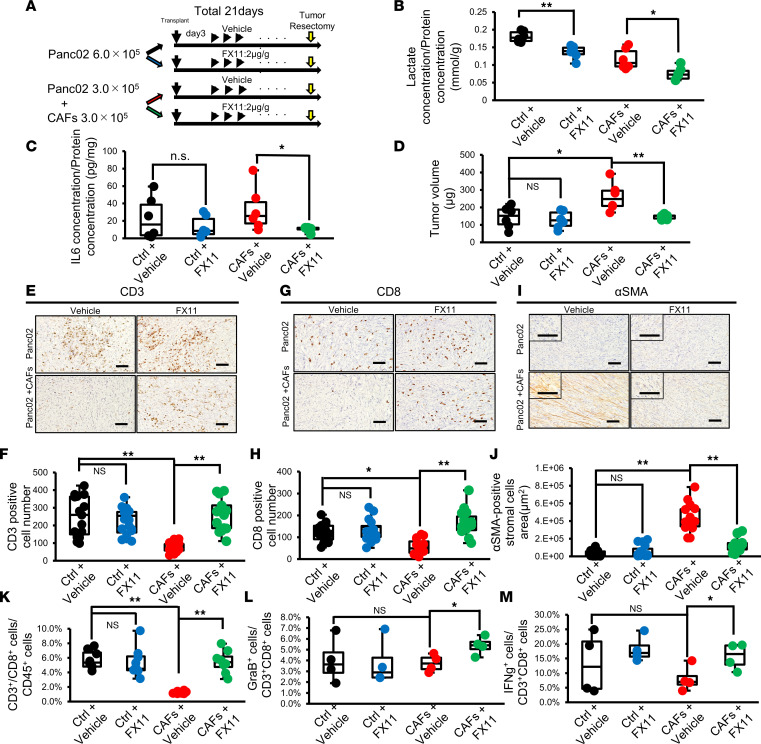
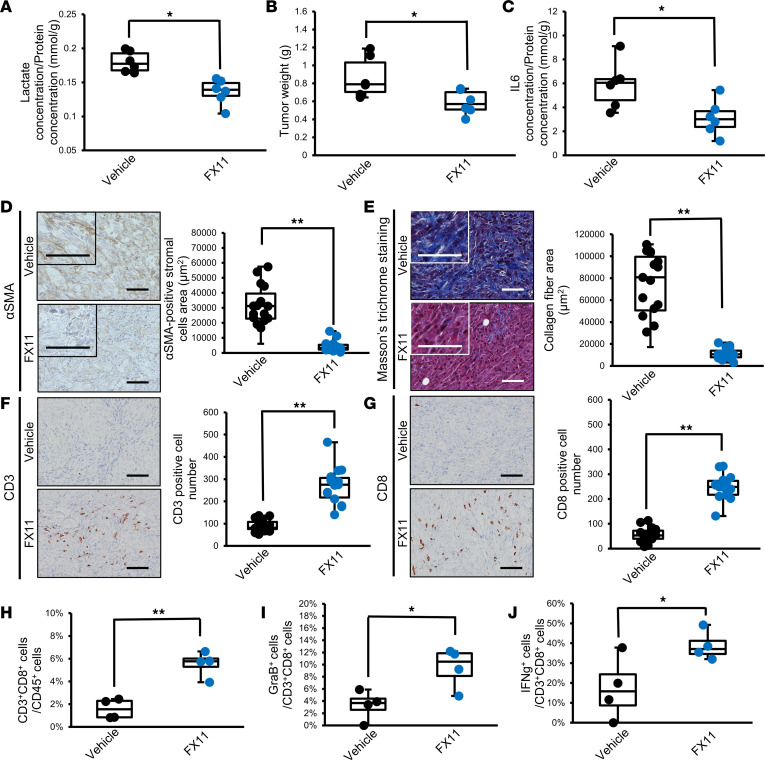
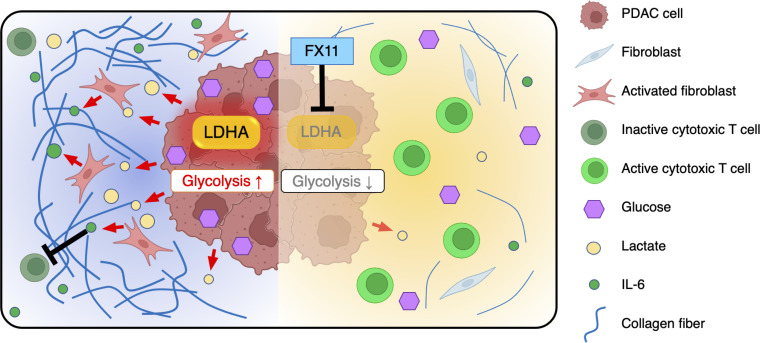
Glycolysis is highly enhanced in pancreatic ductal adenocarcinoma (PDAC) cells; thus, glucose restrictions are imposed on nontumor cells in the PDAC tumor microenvironment (TME). However, little is known about how such glucose competition alters metabolism and confers phenotypic changes in stromal cells in the TME. Here, we report that cancer-associated fibroblasts (CAFs) with restricted glucose availability utilize lactate from glycolysis-enhanced cancer cells as a fuel and exert immunosuppressive activity in the PDAC TME. The expression of lactate dehydrogenase A (LDHA), which regulates lactate production, was a poor prognostic factor for patients with PDAC, and LDHA depletion suppressed tumor growth in a CAF-rich murine PDAC model. Coculture of CAFs with PDAC cells revealed that most of the glucose was taken up by the tumor cells and that CAFs consumed lactate via monocarboxylate transporter 1 to enhance proliferation through the TCA cycle. Moreover, lactate-stimulated CAFs upregulated IL-6 expression and suppressed cytotoxic immune cell activity synergistically with lactate. Finally, the LDHA inhibitor FX11 reduced tumor growth and improved antitumor immunity in CAF-rich PDAC tumors. Our study provides insight regarding the crosstalk among tumor cells, CAFs, and immune cells mediated by lactate and offers therapeutic strategies for targeting LDHA enzymatic activity in PDAC cells.

Keywords: Cancer; Metabolism; Oncology.


Figures

Figure 1
Figure 1. LDHA in PDAC cells regulates lactate production.
(A and B) Kaplan-Meier survival analysis of the RFS (top) and OS (bottom) of patients with PDAC (n = 190) according to the LDHA (A) and LDHB (B) immunostaining indexes. The log-rank test was used to calculate P values. (C) Analysis of the glycolytic abilities of PANC-1 and PK8 cells using a flux analyzer after transfection with siCtrl or siLDHA (n = 3). (D) Measurement of the lactate concentration in the culture supernatants of PANC-1 and PK8 cells after transfection with siCtrl or siLDHA under hypoxic conditions (n = 3). (E) Measurement of the lactate concentration in the culture supernatants after administration of oligomycin to PANC-1 and PK8 cells transfected with siCtrl or siLDHA (n = 5). (F) Analysis of the glycolytic abilities of PANC-1 and PK8 cells treated with FX11 (n = 3). (G) The lactate concentration in the culture supernatants after administration of oligomycin to PANC-1 and PK8 cells treated with FX11. *P < 0.05; **P < 0.01. A Student’s t test was used to compare continuous variables between 2 groups. One-way ANOVA followed by Tukey’s multiple-comparison test was used to compare multiple groups. 2-DG, 2-deoxy-d-glucose.
Figure 2
Figure 2. CAF numbers in the PDAC TME are reduced by LDHA KD in tumor cells.
(A) Analysis of the glycolytic ability of Panc02 cells using a flux analyzer after knockdown of LDHA (n = 3). (B) Measurement of the lactate concentration in tumors from the Ctrl and LDHA-KD groups (n = 6). (C) Weight of tumors from the Ctrl and LDHA-KD groups (n = 6). (D) Representative images of αSMA immunohistochemical staining in resected tumors from the Ctrl and LDHA-KD groups. (E) Quantification of the αSMA-positive stromal area in Ctrl and LDHA-KD tumors (n = 15). (F) Representative images of Masson’s trichrome staining in tumors from the Ctrl and LDHA-KD groups. (G) Quantification of the blue-stained collagen fibers in the stromal area in Ctrl and LDHA-KD tumors (n = 15). Scale bars: 100 μm. Box plots show the interquartile range (box), median (line), and minimum and maximum (whiskers). *P < 0.05; **P < 0.01. A Student’s t test was used to compare continuous variables between 2 groups. One-way ANOVA followed by Tukey’s multiple-comparison test was used to compare multiple groups.
Figure 3
Figure 3. Metabolic competition between PDAC tumor cells and CAFs.
(A and B) Correlations between the number of CAFs and the expression of LDHA (A) or LDHB (B) in PDAC patients (n = 190). (C) Growth assay performed with human CAFs stimulated with lactate in complete medium (n = 3). (D) Representative fluorescence microscopy images of PANC-1 (top) or PK8 (bottom) cells cultured with human CAFs and fluorescently labeled glucose. Scale bars: 50 μm. (E) Quantification of glucose uptake by PDAC cells or CAFs counted under a fluorescence microscope (n = 3). (F) Quantification of glucose uptake by PDAC cells or CAFs by flow cytometry. (G) Western blotting analysis of MCT1 expression in CAFs cocultured with PANC-1 or PK8 cells. (H) Quantification of the intensity of MCT1 in Western blot analysis in G (n = 3). *P < 0.05; **P < 0.01. A Student’s t test was used to compare continuous variables between 2 groups. One-way ANOVA followed by Tukey’s multiple-comparison test was used to compare multiple groups. 2NBDG, 2-[N-(7-nitrobenz-2-oxa-1,3-diazol-4-yl)amino]-2-deoxy-d-glucose.
Figure 4
Figure 4. CAFs use lactate as a fuel via the TCA cycle.
(A) Growth assay performed with human CAFs with or without lactate in glucose-free medium (n = 3). (B) Growth curve of MCT1-KD CAFs stimulated with lactate (n = 3). (C) Growth assay performed with human CAFs with or without lactate ± AZD3965 in glucose-free medium (n = 3). (D) Comprehensive metabolite analysis of CAFs in the presence of lactate in glucose metabolism (n = 3). (E) Comprehensive metabolite analysis of CAFs in the presence of lactate in the TCA cycle (n = 3). (F) Oxygen consumption rate (OCR) of human CAFs after 24 hours of lactate stimulation (n = 5). Box plots show the interquartile range (box), median (line), and minimum and maximum (whiskers). (G) Isotopologue distribution of metabolites associated with the TCA cycle in CAFs treated with 13C-labeled or unlabeled lactate. *P < 0.05; **P < 0.01. A Student’s t test was used to compare continuous variables between 2 groups. One-way ANOVA followed by Tukey’s multiple-comparison test was used to compare multiple groups.
Figure 5
Figure 5. Lactate-stimulated CAFs produce IL-6 and suppress antitumor immunity.
(A) CIBERSORT analysis of estimated CD8+ T cell infiltration in tumors in the LDHA-high and LDHA-low subgroups of PDAC patients from the TCGA cohort (n = 177). (B) Heatmap of the mRNA expression of immunosuppression-related genes in CAFs stimulated with or without lactate (n = 3). (C) Volcano plot of the mRNA expression of CAFs stimulated with or without lactate (n = 3). (D) Quantification of IL6 and PIGF expression in CAFs stimulated with or without lactate by quantitative PCR (n = 3). (E) Quantification of the IL-6 concentration in the conditioned medium of CAFs stimulated with or without lactate (n = 6). Box plots show the interquartile range (box), median (line), and minimum and maximum (whiskers). (F) Schematic of the experimental model for analysis of the cytotoxic activity of CD8+ T cells. PBMCs were isolated from healthy donors and stimulated with PBS, lactate, IL-6, or lactate plus IL-6. After 48 hours, the cells were analyzed by flow cytometry. (G) Quantification of GraB (top) and IFN-γ (bottom) expression in CD8+ T cells stimulated as described in F by flow cytometry (n = 3). *P < 0.05. A Student’s t test was used to compare continuous variables between 2 groups. One-way ANOVA followed by Tukey’s multiple-comparison test was used to compare multiple groups.
Figure 6
Figure 6. Pharmacological inhibition of LDHA decreases lactate production in PDAC cells, reduces CAFs, and improves antitumor immunity in a subcutaneous PDAC mouse model.
(A) Schematic representation of the experimental protocol. Panc02 cells with or without murine CAFs were inoculated into C57BL/6 mice. After 3 days, the mice were treated daily with vehicle control or FX11 until day 20. The mice were sacrificed on day 21. (B) Measurement of the lactate concentration in tumors from the Ctrl or CAF group treated with vehicle or FX11 (n = 6). (C) Measurement of the IL-6 concentration in tumors from the Ctrl or CAF group treated with vehicle or FX11 (n = 6). (D) Weight of tumors from the Ctrl or CAF group harvested at 21 days after transplantation (n = 6). (EJ) Representative images for CD3 (E), CD8 (G), or αSMA (I) immunohistochemical staining and quantification of the number of CD3+ (F) or CD8+ (H) lymphocytes or αSMA-positive cells (J) in resected tumors from the Ctrl or CAF group treated with vehicle control or FX11. Scale bars: 100 μm. (KM) Flow cytometric analysis for quantification of the percentages of CD3+CD8+ T cells in CD45+ cells (K), GraB+ cells in CD3+CD8+ T cells (L), and IFN-γ+ cells in CD3+CD8+ T cells (M) infiltrated into tumors from the Ctrl or CAF group treated with vehicle control or FX11 (n = 8). Box plots show the interquartile range (box), median (line), and minimum and maximum (whiskers). *P < 0.05; **P < 0.01. A Student’s t test was used to compare continuous variables between 2 groups. One-way ANOVA followed by Tukey’s multiple-comparison test was used to compare multiple groups.
Figure 7
Figure 7. LDHA inhibition ameliorates the fibrotic and immunosuppressive TME in orthotopic PDAC mouse models.
(A) Measurement of the lactate concentration in tumors from the vehicle- or FX11-treated group (n = 6). (B) Weights of tumors from the vehicle- or FX11-treated groups (n = 6). (C) The IL-6 concentration in tumor lysates from vehicle- or FX11-treated mice (n = 6). (D) Representative images of αSMA immunohistochemical staining and quantification of the αSMA-positive cell area in the vehicle or FX11 group (n = 15). (E) Representative images of Masson’s trichrome staining and quantification of the blue-stained collagen fiber area in the vehicle or FX11 group (n = 15). (F and G) Representative images of CD3 (F) and CD8 (G) immunohistochemical staining and quantification of the number of CD3+ (F) or CD8+ (G) lymphocytes in tumors from the vehicle- or FX11-treated group (n = 15). Scale bars: 100 µm. (HJ) Flow cytometric analysis for quantification of the percentages of CD3+CD8+ T cells in CD45+ cells (H), GraB+ cells in CD3+CD8+ T cells (I), and IFN-γ+ cells in CD3+CD8+ T cells (J) infiltrated into tumors treated with vehicle control or FX11 (n = 4). Box plots show the interquartile range (box), median (line), and minimum and maximum (whiskers). *P < 0.05; **P < 0.01. A Student’s t test was used to compare continuous variables between 2 groups. One-way ANOVA followed by Tukey’s multiple-comparison test was used to compare multiple groups.
Figure 8
Figure 8. Schematic model.
Lactate produced by LDHA-active PDAC cells promotes the proliferation of CAFs, which suppress antitumor immunity by secreting IL-6. Inhibition of LDHA by FX11 decreases lactate production in PDAC cells, leading to amelioration of immunosuppression in the TME.

References

    1. Park W, et al. Pancreatic cancer: a review. JAMA. 2021;326(9):851–862. doi: 10.1001/jama.2021.13027. - DOI - PMC - PubMed
    1. Rose DM, et al. 18Fluorodeoxyglucose-positron emission tomography in the management of patients with suspected pancreatic cancer. Ann Surg. 1999;229(5):729–737; discussion 737–738. doi: 10.1097/00000658-199905000-00016. - DOI - PMC - PubMed
    1. Koppenol WH, et al. Otto Warburg’s contributions to current concepts of cancer metabolism. Nat Rev Cancer. 2011;11(5):325–337. doi: 10.1038/nrc3038. - DOI - PubMed
    1. Rickes S, et al. Contrast-enhanced ultrasound in the diagnosis of pancreatic tumors. JOP. 2006;7(6):584–592. - PubMed
    1. Schneider G, et al. Pancreatic cancer: basic and clinical aspects. Gastroenterology. 2005;128(6):1606–1625. doi: 10.1053/j.gastro.2005.04.001. - DOI - PubMed

Publication types